| Param | Original file | Final file |
|---|---|---|
| Filename | modeM0/AS1A14_070T08_9000006576_57602cztM0_level2.fits | modeM0/AS1A14_070T08_9000006576_57602cztM0_level2_quad_clean.evt |
| Size (bytes) | 466,234,560 | 111,617,280 |
| Size | 444.6 MB | 106.4 MB |
| Events in quadrant A | 3,373,285 | 733,895 |
| Events in quadrant B | 3,855,071 | 781,949 |
| Events in quadrant C | 4,197,903 | 689,519 |
| Events in quadrant D | 5,233,434 | 638,597 |
| Mode M0 | |||
|---|---|---|---|
| Quadrant | BADHDUFLAG | Total packets | Discarded packets |
| A | 0 | 15741 | 0 |
| B | 0 | 16980 | 0 |
| C | 0 | 17991 | 0 |
| D | 0 | 20985 | 0 |
| Mode SS | |||
|---|---|---|---|
| Quadrant | BADHDUFLAG | Total packets | Discarded packets |
| A | 0 | 154 | 0 |
| B | 0 | 154 | 0 |
| C | 0 | 154 | 0 |
| D | 0 | 154 | 0 |
| Quadrant | Total seconds | Saturated seconds | Saturation percentage |
|---|---|---|---|
| A | 7701 | 12 | 0.155824% |
| B | 7702 | 88 | 1.142560% |
| C | 7701 | 162 | 2.103623% |
| D | 7701 | 392 | 5.090248% |
Noise dominated data is calculated using 1-second bins in cleaned event files. If a bin has >2000 counts, and if more than 50% of those come from <1% of pixels, then it is considered to be noise-dominated and hence unusable.
| Quadrant | # 1 sec bins | Bins with >0 counts | Bins with >2000 counts | High rate bins dominated by noise | Noise dominated (total time) | Noise dominated (detector-on time) | Marked lightcurve |
|---|---|---|---|---|---|---|---|
| A | 7701 | 7701 | 4 | 4 | 0.05% | 0.05% | 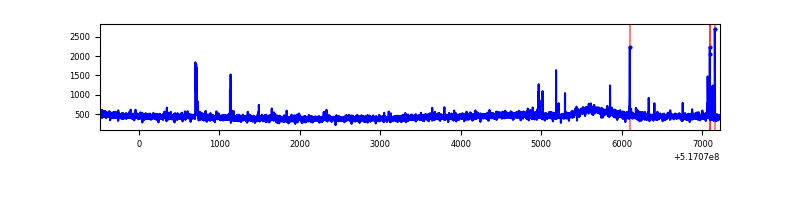 |
| B | 7702 | 7702 | 40 | 40 | 0.52% | 0.52% | 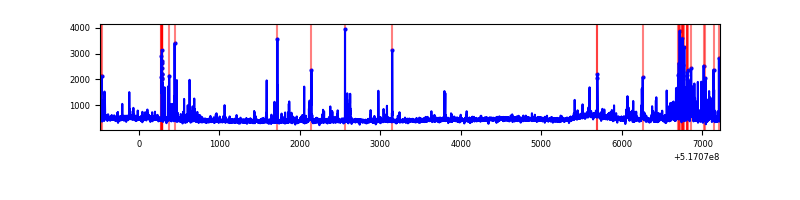 |
| C | 7701 | 7701 | 137 | 137 | 1.78% | 1.78% | 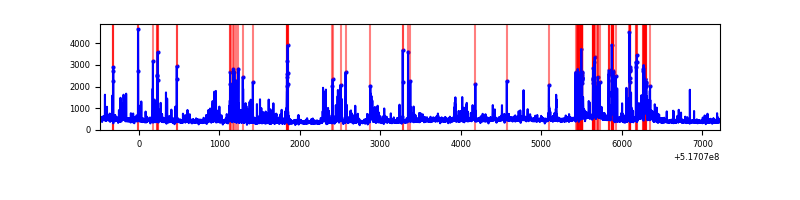 |
| D | 7701 | 7701 | 396 | 396 | 5.14% | 5.14% | 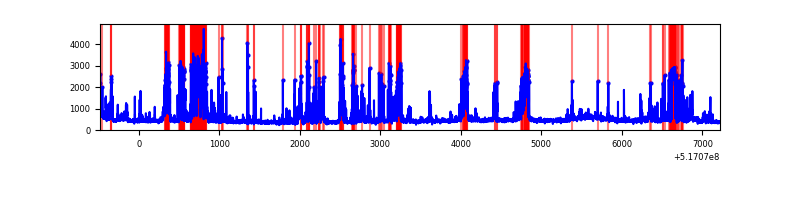 |
Top three noisy pixels from each quadrant. If the there are fewer than three noisy pixels in the level2.evt file, extra rows are filled as -1
| Pixel properties | Quadrant properties | ||||||
|---|---|---|---|---|---|---|---|
| Quadrant | DetID | PixID | Counts | Sigma | Mean | Median | Sigma |
| A | 3 | 14 | 44096 | 209.83 | 834 | 810 | 206.3 |
| A | 3 | 128 | 29801 | 140.54 | 834 | 810 | 206.3 |
| A | 13 | 248 | 27710 | 130.4 | 834 | 810 | 206.3 |
| B | 10 | 247 | 297458 | 1700.34 | 817 | 784 | 174.5 |
| B | 0 | 245 | 99118 | 563.59 | 817 | 784 | 174.5 |
| B | 5 | 185 | 63677 | 360.46 | 817 | 784 | 174.5 |
| C | 15 | 224 | 748681 | 3444.81 | 797 | 788 | 217.1 |
| C | 9 | 38 | 138386 | 633.78 | 797 | 788 | 217.1 |
| C | 8 | 7 | 47427 | 214.82 | 797 | 788 | 217.1 |
| D | 8 | 240 | 826901 | 3703.46 | 792 | 756 | 223.1 |
| D | 15 | 142 | 522129 | 2337.22 | 792 | 756 | 223.1 |
| D | 7 | 253 | 268073 | 1198.34 | 792 | 756 | 223.1 |
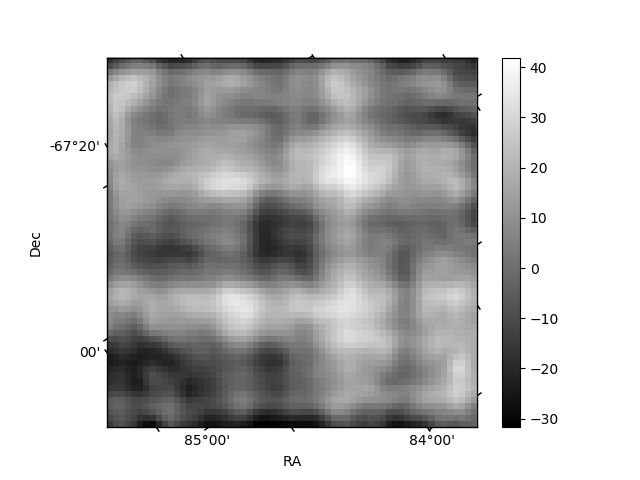
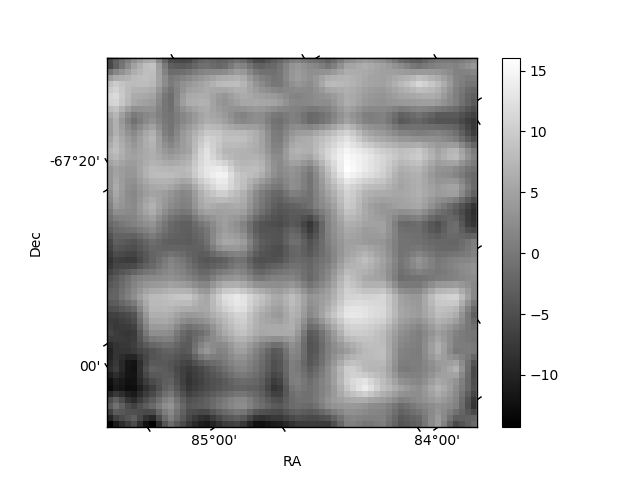
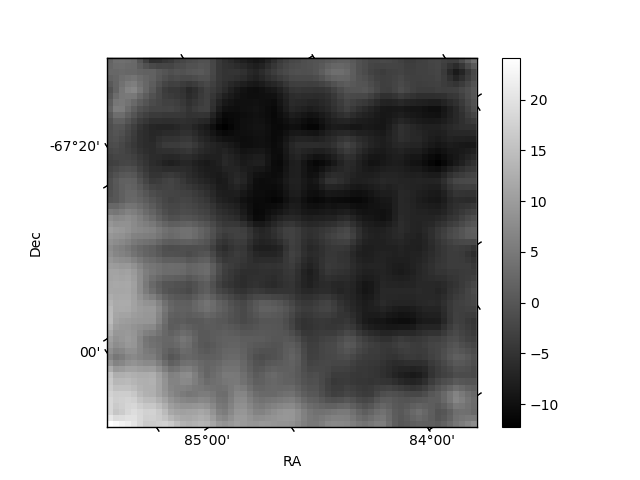
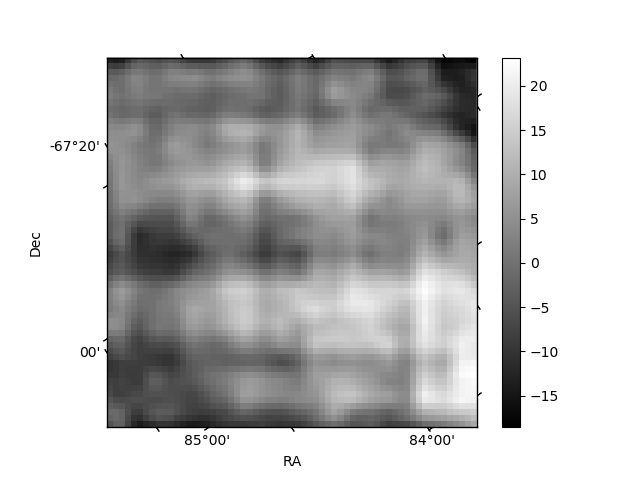
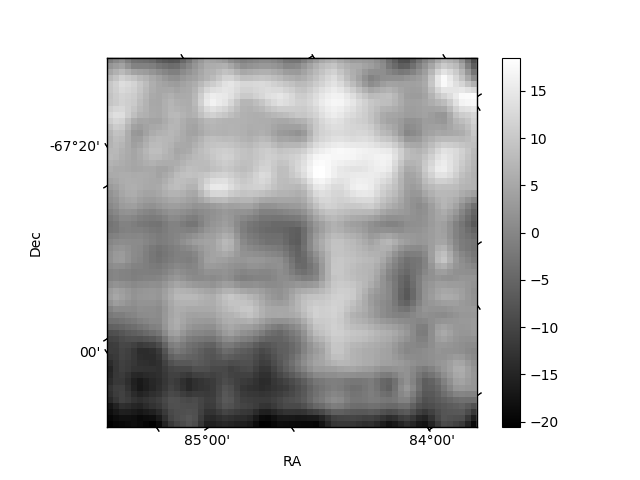
Histogram calculated using DETX and DETY for each event in the final _common_clean file
| Quadrant A | 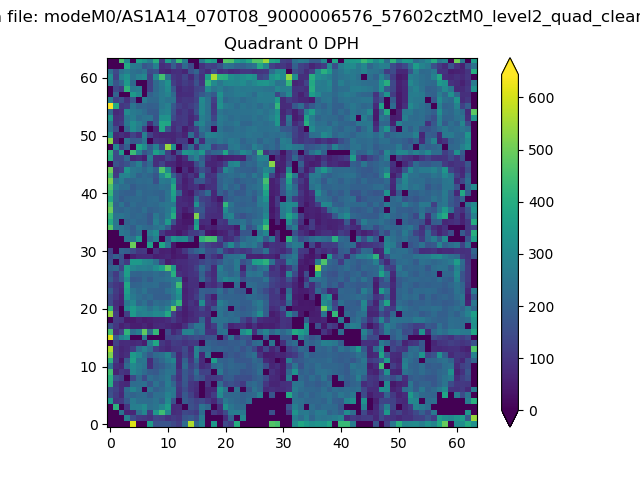 |
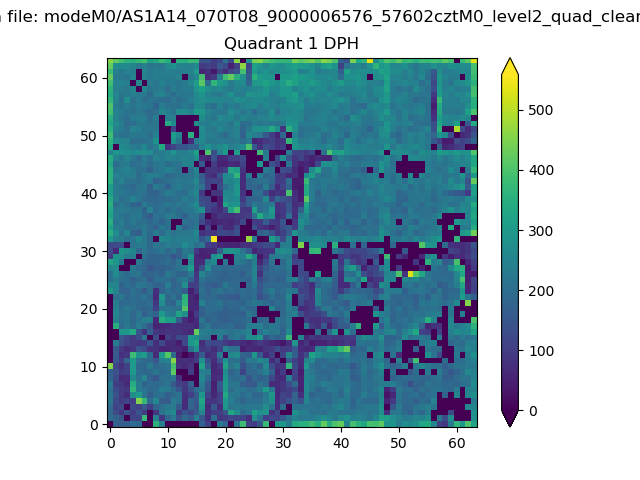 |
Quadrant B |
|---|---|---|---|
| Quadrant D | 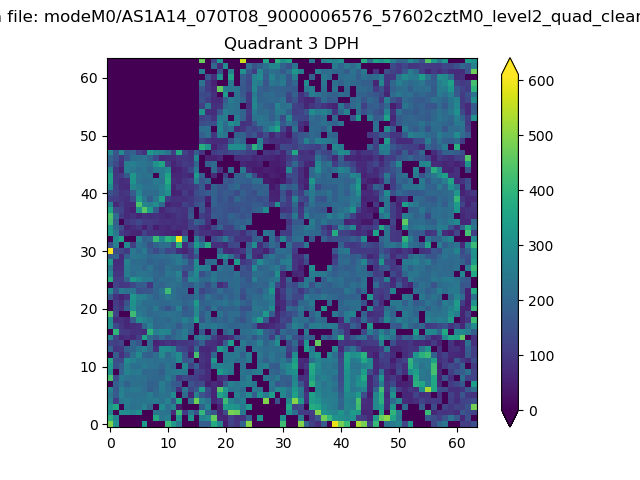 |
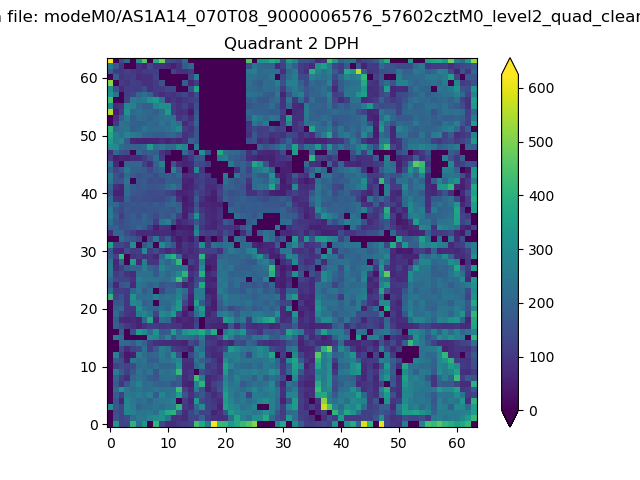 |
Quadrant C |
| Plot type | Count rate plots | Images |
|---|---|---|
| Comparison with Poisson distribution Blue bars denote a histogram of data divided into 1 sec bins. Red curve is a Poisson curve with rate = median count rate of data. |
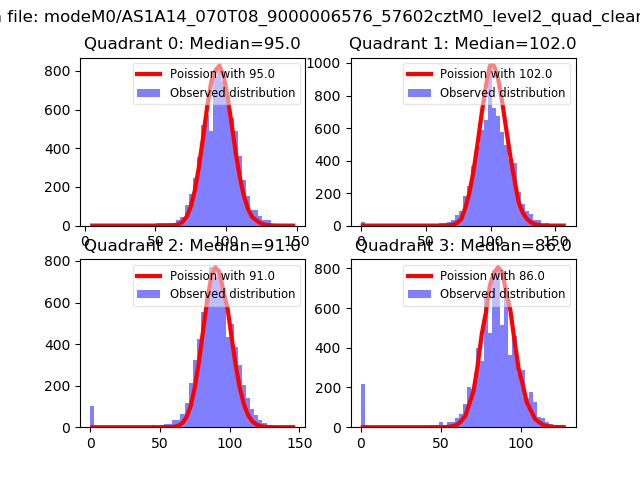 |
 |
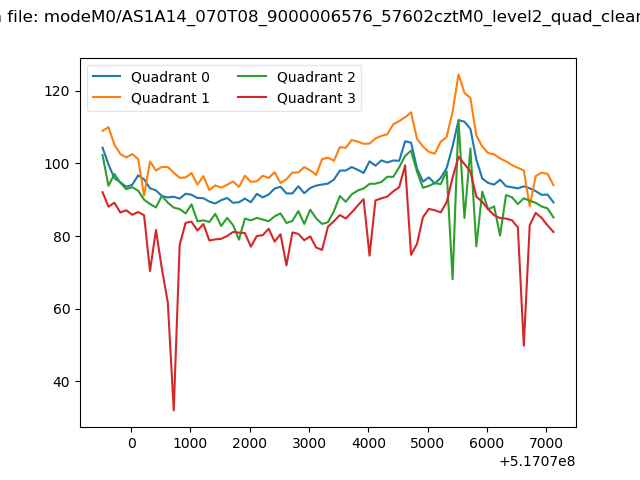
| Quadrant-wise count rates Data is divided into 100 sec bins |
 |
|
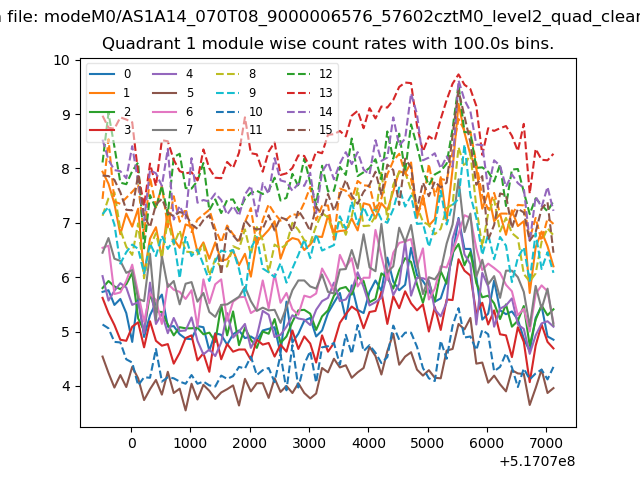
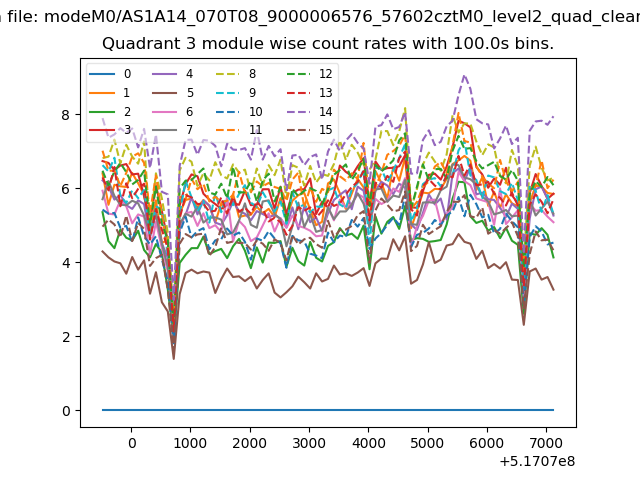
| Module-wise count rates for Quadrant A Data is divided into 100 sec bins |
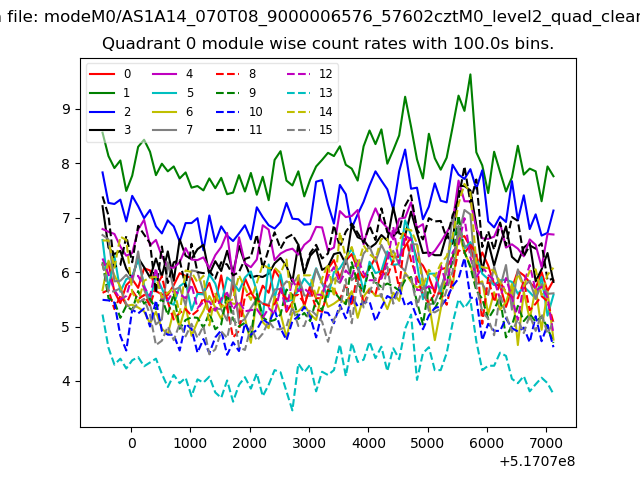 |
 |
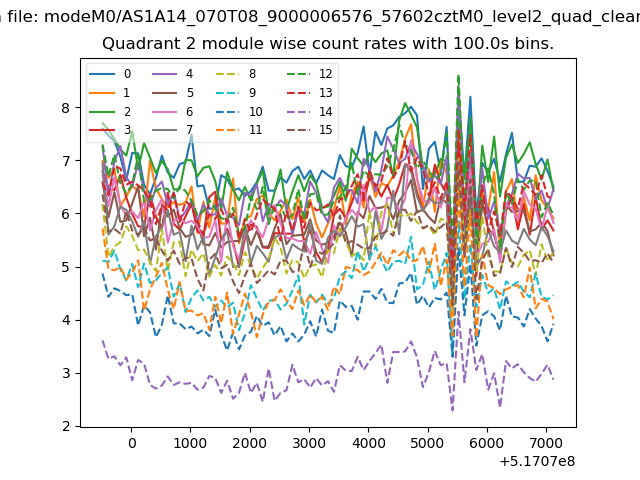
| Module-wise count rates for Quadrant B Data is divided into 100 sec bins |
 |
 |
| Module-wise count rates for Quadrant C Data is divided into 100 sec bins |
 |
 |
| Module-wise count rates for Quadrant D Data is divided into 100 sec bins |
 |
 |
| Parameter | Plot |
|---|---|
| CZT HV Monitor | 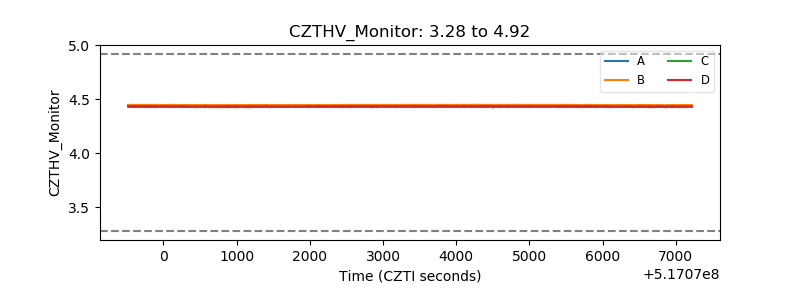 |
| D_VDD | 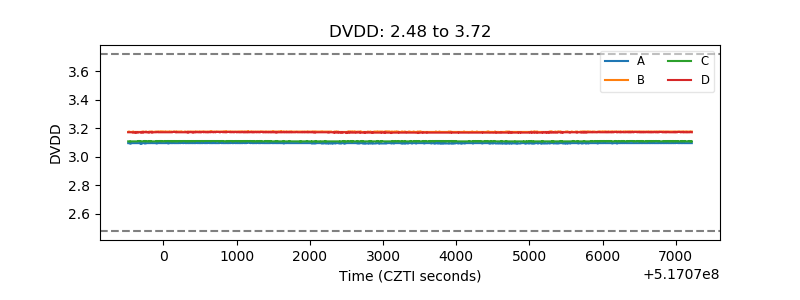 |
| Temperature 1 | 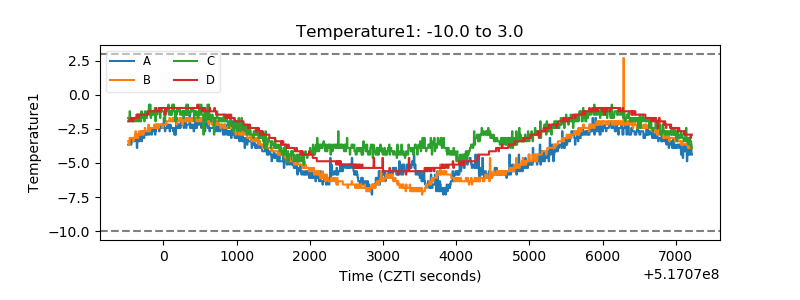 |
| Veto HV Monitor | 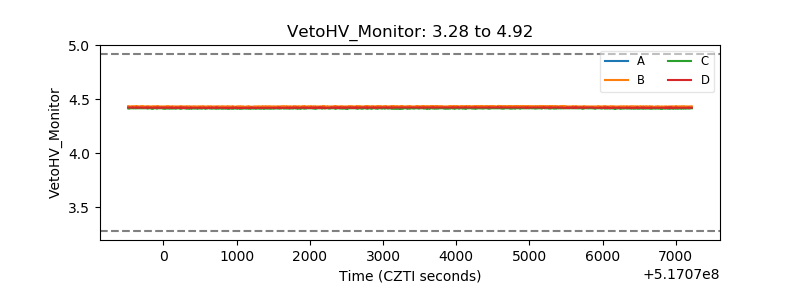 |
| Veto LLD | 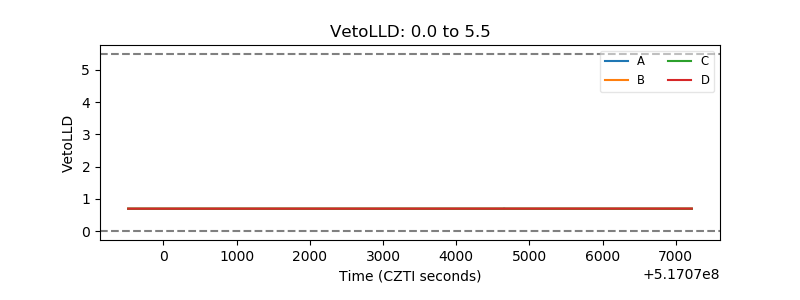 |
| Alpha Counter | 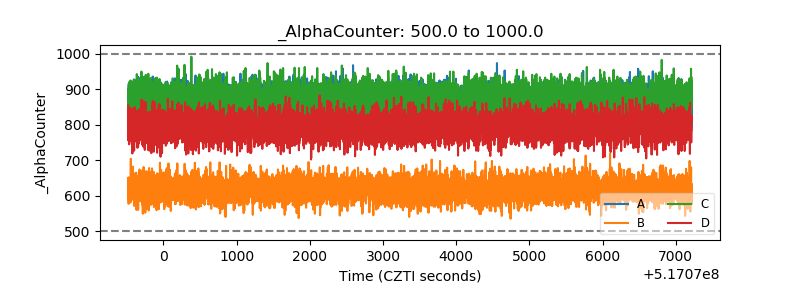 |
| _CPM_Rate | 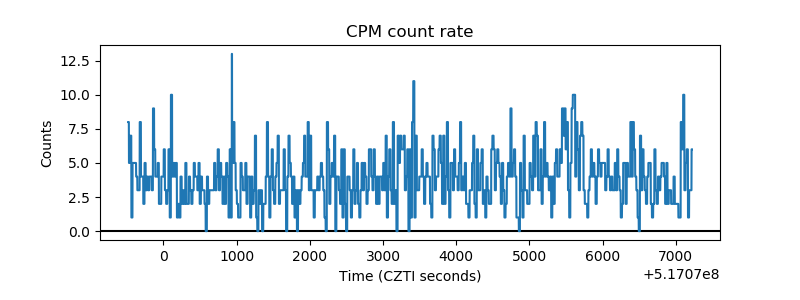 |
| CZT Counter | 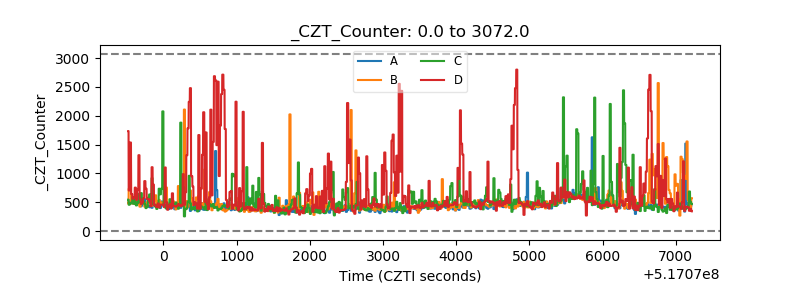 |
| +2.5 Volts monitor | 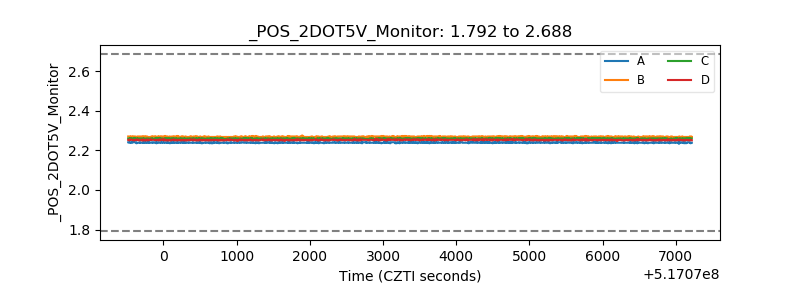 |
| +5 Volts monitor |  |
| _ROLL_ROT | 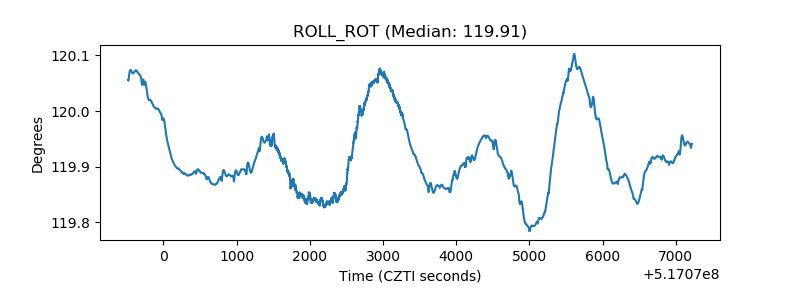 |
| _Roll_DEC | 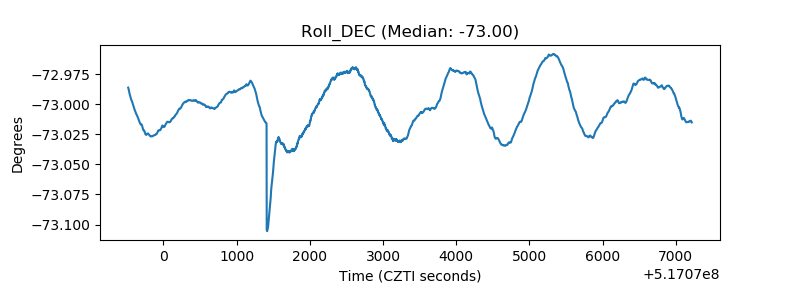 |
| _Roll_RA | 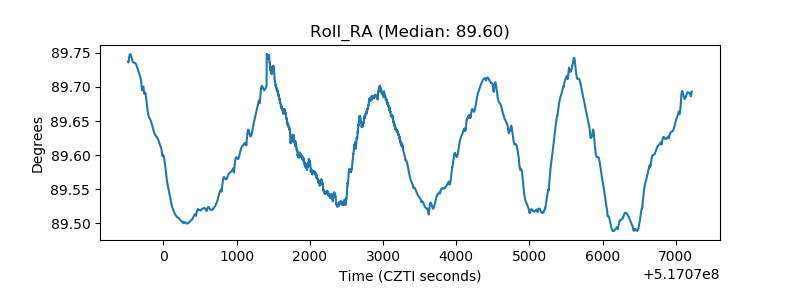 |
| Veto Counter | 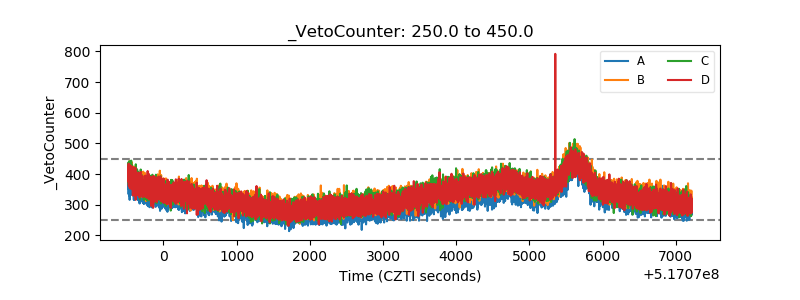 |