| Param | Original file | Final file |
|---|---|---|
| Filename | modeM0/AS1A14_070T08_9000006576_57607cztM0_level2.fits | modeM0/AS1A14_070T08_9000006576_57607cztM0_level2_quad_clean.evt |
| Size (bytes) | 1,925,294,400 | 412,021,440 |
| Size | 1.8 GB | 392.9 MB |
| Events in quadrant A | 12,716,521 | 2,754,722 |
| Events in quadrant B | 13,891,734 | 2,922,818 |
| Events in quadrant C | 22,499,653 | 2,436,113 |
| Events in quadrant D | 19,895,011 | 2,348,953 |
| Mode M0 | |||
|---|---|---|---|
| Quadrant | BADHDUFLAG | Total packets | Discarded packets |
| A | 0 | 59861 | 4 |
| B | 0 | 62798 | 4 |
| C | 0 | 87972 | 4 |
| D | 0 | 80134 | 4 |
| Mode M9 | |||
|---|---|---|---|
| Quadrant | BADHDUFLAG | Total packets | Discarded packets |
| A | 0 | 29 | 0 |
| B | 0 | 29 | 0 |
| C | 0 | 29 | 0 |
| D | 0 | 29 | 0 |
| Mode SS | |||
|---|---|---|---|
| Quadrant | BADHDUFLAG | Total packets | Discarded packets |
| A | 0 | 592 | 0 |
| B | 0 | 592 | 0 |
| C | 0 | 592 | 0 |
| D | 0 | 592 | 0 |
| Quadrant | Total seconds | Saturated seconds | Saturation percentage |
|---|---|---|---|
| A | 29270 | 247 | 0.843867% |
| B | 29271 | 517 | 1.766253% |
| C | 29270 | 2633 | 8.995559% |
| D | 29270 | 1857 | 6.344380% |
Noise dominated data is calculated using 1-second bins in cleaned event files. If a bin has >2000 counts, and if more than 50% of those come from <1% of pixels, then it is considered to be noise-dominated and hence unusable.
| Quadrant | # 1 sec bins | Bins with >0 counts | Bins with >2000 counts | High rate bins dominated by noise | Noise dominated (total time) | Noise dominated (detector-on time) | Marked lightcurve |
|---|---|---|---|---|---|---|---|
| A | 32388 | 29558 | 11 | 11 | 0.03% | 0.04% | 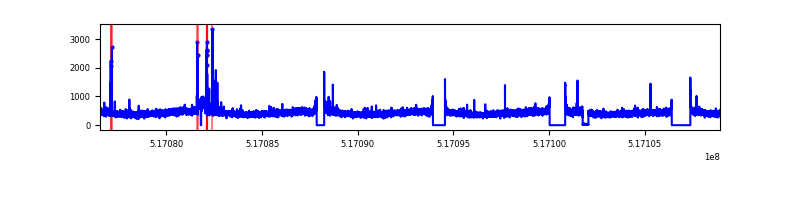 |
| B | 32389 | 29557 | 95 | 95 | 0.29% | 0.32% | 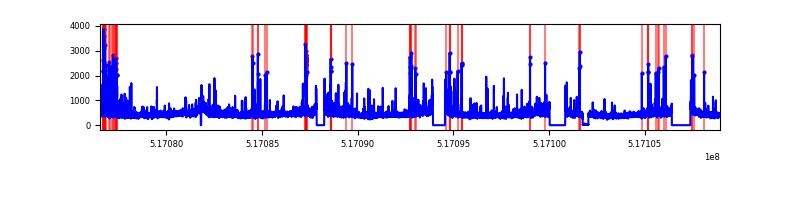 |
| C | 32388 | 29556 | 2114 | 2114 | 6.53% | 7.15% | 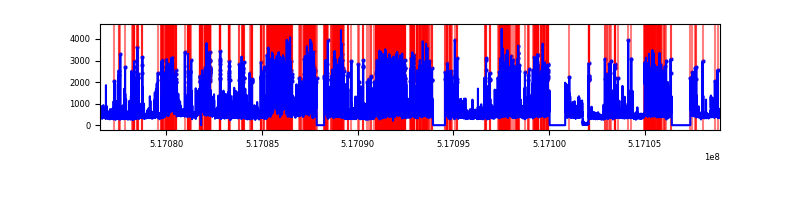 |
| D | 32388 | 29558 | 1690 | 1690 | 5.22% | 5.72% | 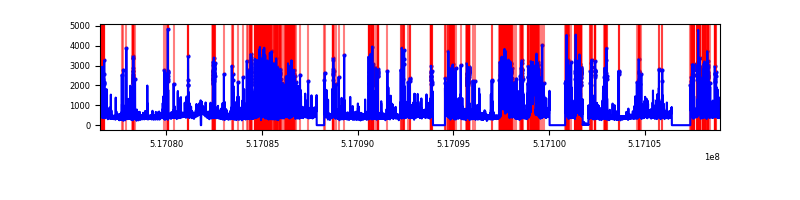 |
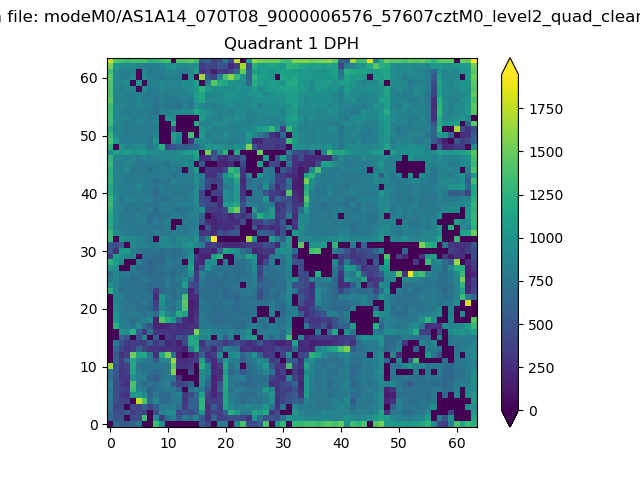
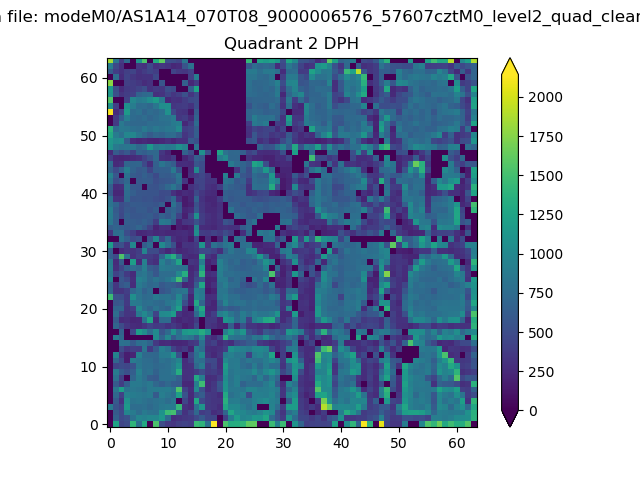
Top three noisy pixels from each quadrant. If the there are fewer than three noisy pixels in the level2.evt file, extra rows are filled as -1
| Pixel properties | Quadrant properties | ||||||
|---|---|---|---|---|---|---|---|
| Quadrant | DetID | PixID | Counts | Sigma | Mean | Median | Sigma |
| A | 3 | 14 | 164319 | 210.22 | 3162 | 3087 | 767.0 |
| A | 3 | 128 | 153985 | 196.75 | 3162 | 3087 | 767.0 |
| A | 4 | 3 | 84380 | 105.99 | 3162 | 3087 | 767.0 |
| B | 10 | 247 | 487535 | 733.58 | 3117 | 2993 | 660.5 |
| B | 5 | 185 | 374263 | 562.09 | 3117 | 2993 | 660.5 |
| B | 7 | 252 | 138286 | 204.83 | 3117 | 2993 | 660.5 |
| C | 15 | 224 | 6893335 | 8650.33 | 2956 | 2922 | 796.5 |
| C | 9 | 38 | 2146140 | 2690.63 | 2956 | 2922 | 796.5 |
| C | 14 | 254 | 448178 | 558.98 | 2956 | 2922 | 796.5 |
| D | 15 | 142 | 3644514 | 4360.68 | 2984 | 2847 | 835.1 |
| D | 8 | 240 | 1448303 | 1730.85 | 2984 | 2847 | 835.1 |
| D | 15 | 94 | 1003750 | 1198.52 | 2984 | 2847 | 835.1 |
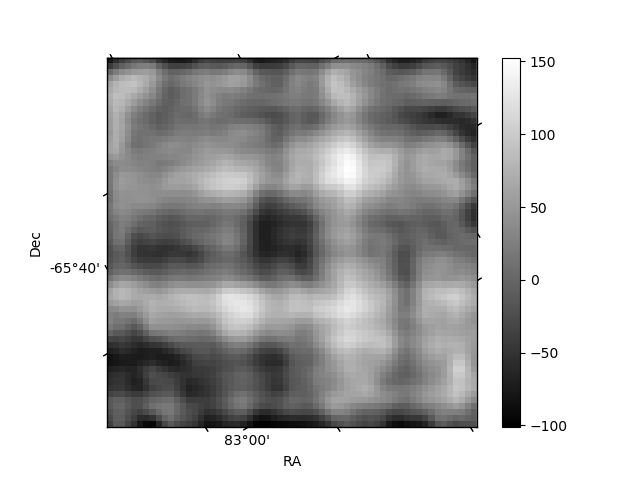
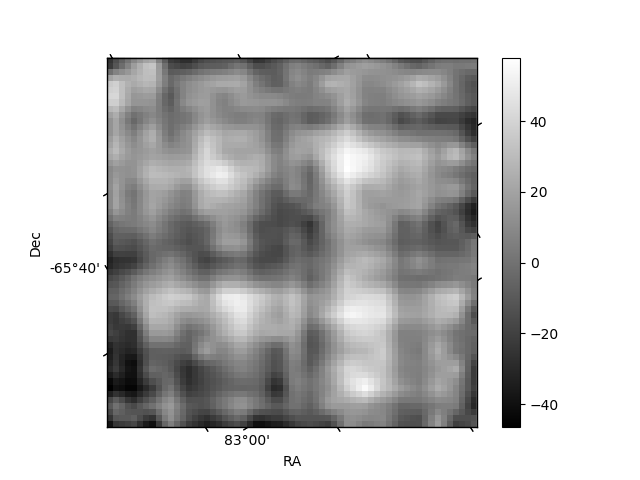
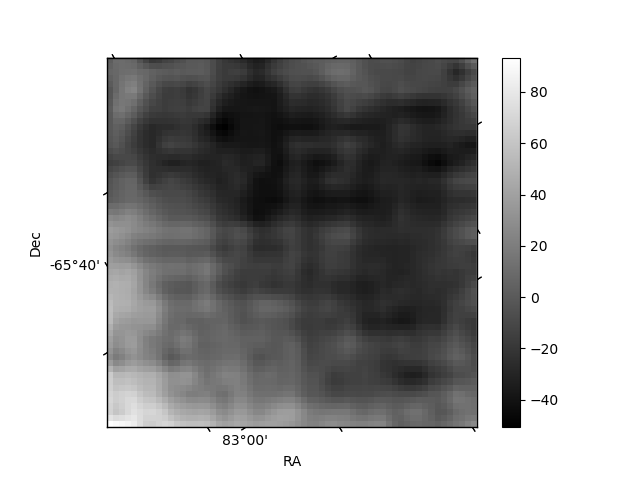
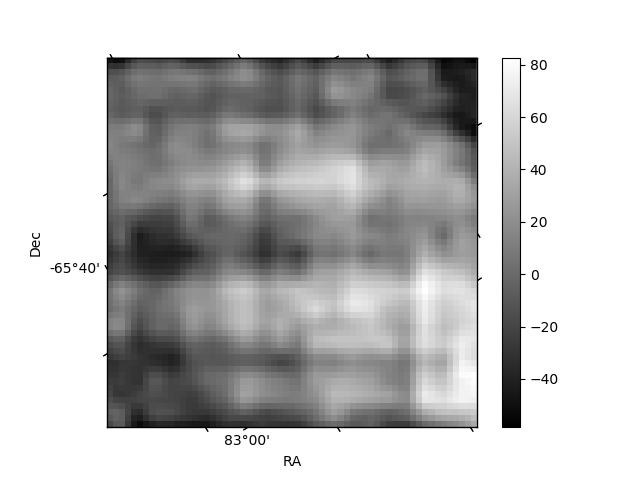
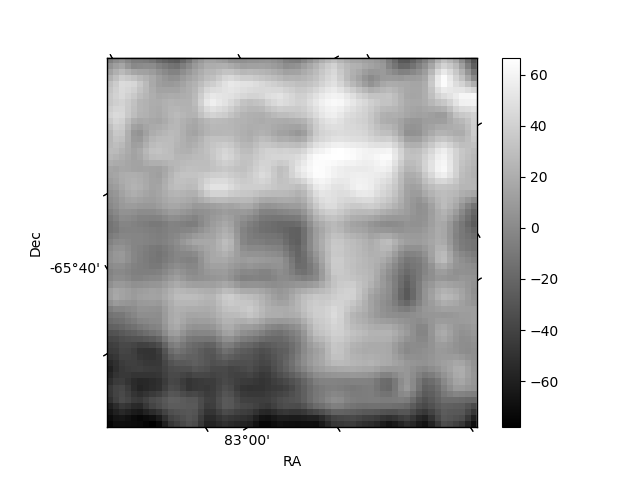
Histogram calculated using DETX and DETY for each event in the final _common_clean file
| Quadrant A | 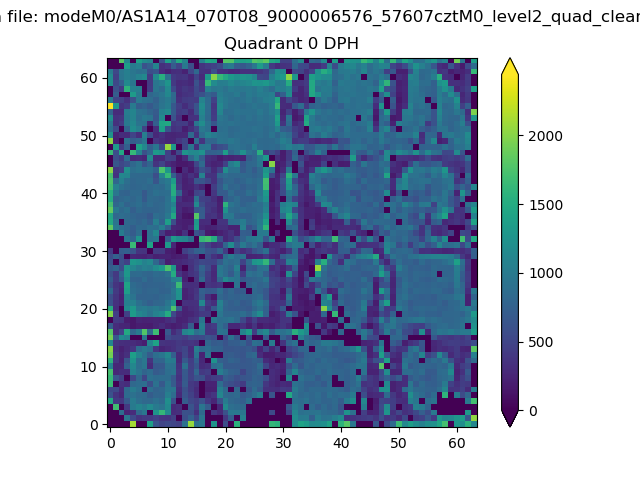 |
 |
Quadrant B |
|---|---|---|---|
| Quadrant D | 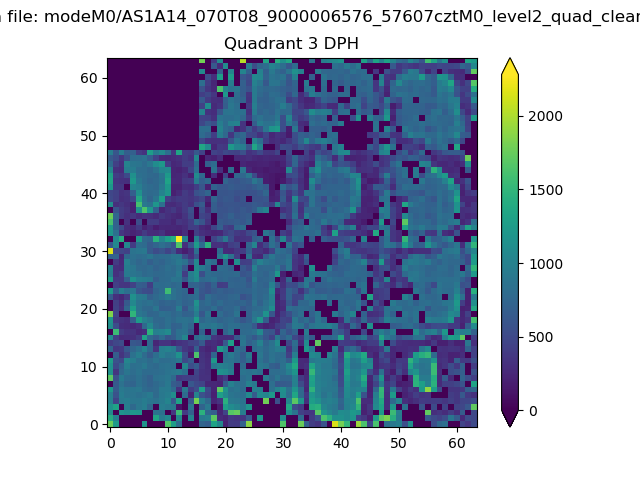 |
 |
Quadrant C |
| Plot type | Count rate plots | Images |
|---|---|---|
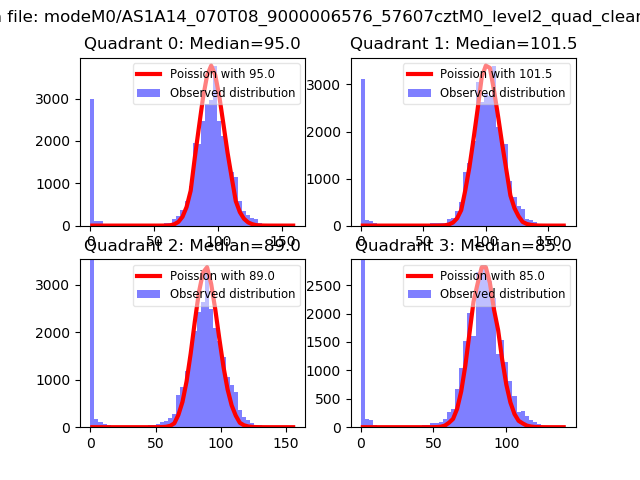
| Comparison with Poisson distribution Blue bars denote a histogram of data divided into 1 sec bins. Red curve is a Poisson curve with rate = median count rate of data. |
 |
 |
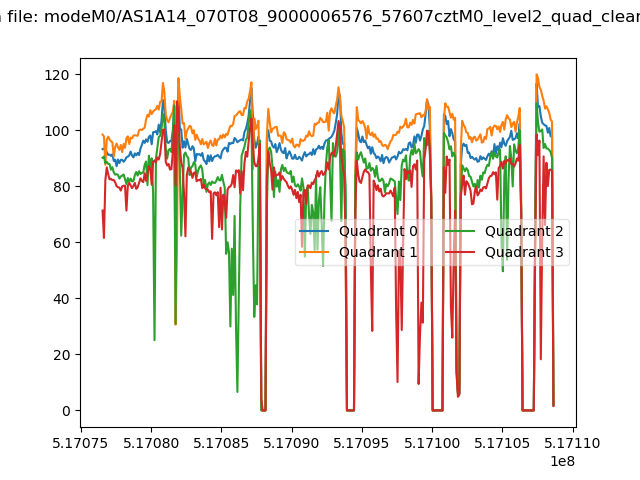
| Quadrant-wise count rates Data is divided into 100 sec bins |
 |
|
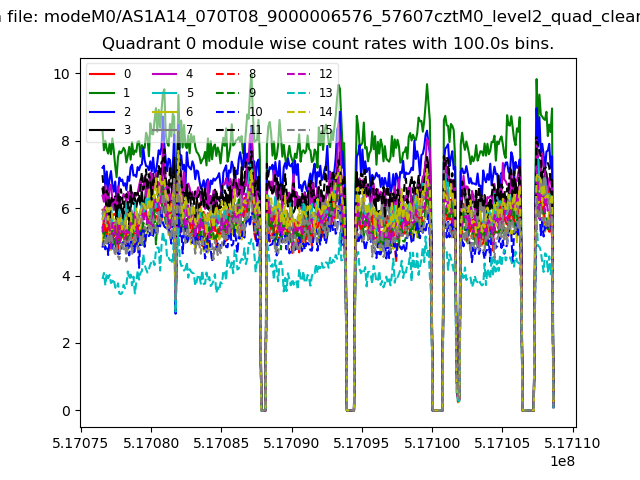
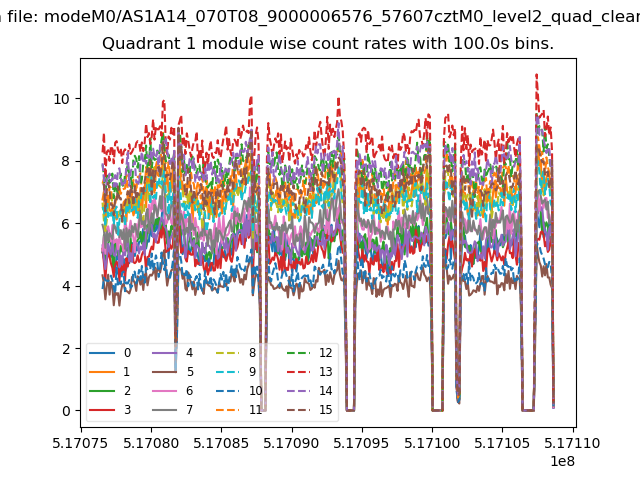
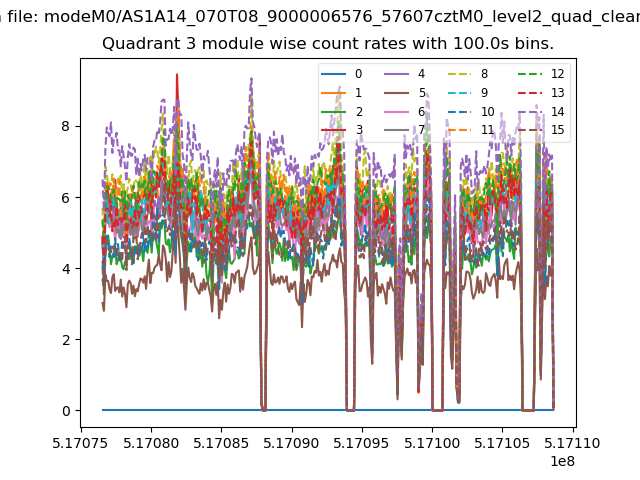
| Module-wise count rates for Quadrant A Data is divided into 100 sec bins |
 |
 |
| Module-wise count rates for Quadrant B Data is divided into 100 sec bins |
 |
 |
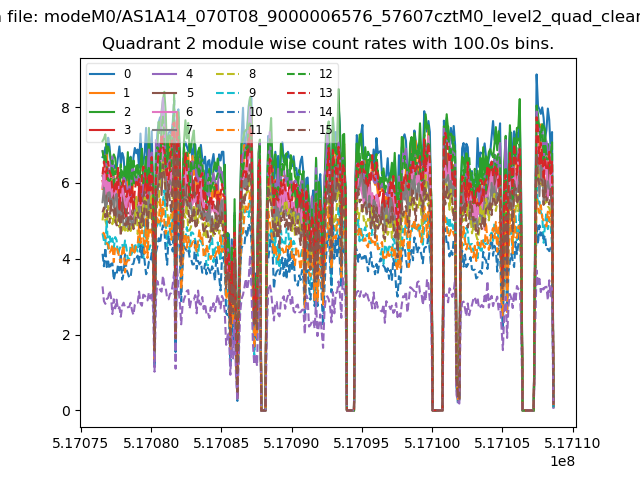
| Module-wise count rates for Quadrant C Data is divided into 100 sec bins |
 |
 |
| Module-wise count rates for Quadrant D Data is divided into 100 sec bins |
 |
 |
| Parameter | Plot |
|---|---|
| CZT HV Monitor | 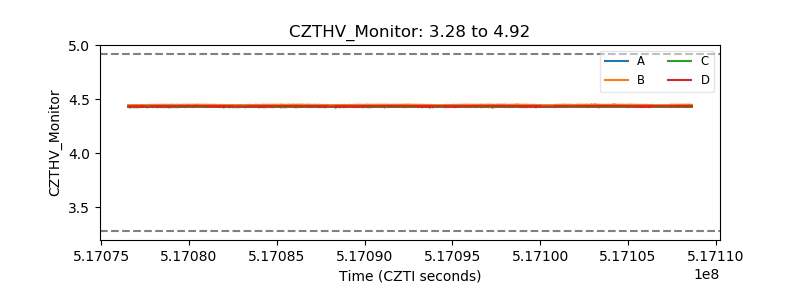 |
| D_VDD | 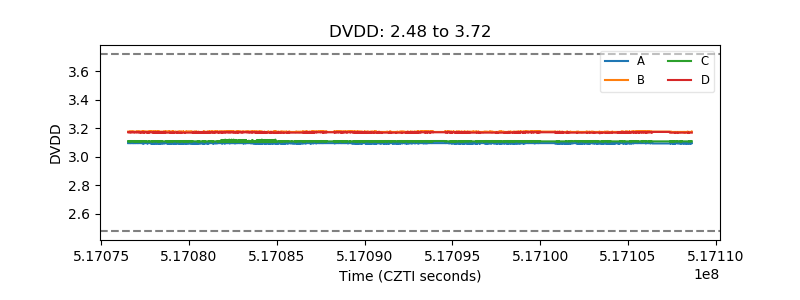 |
| Temperature 1 | 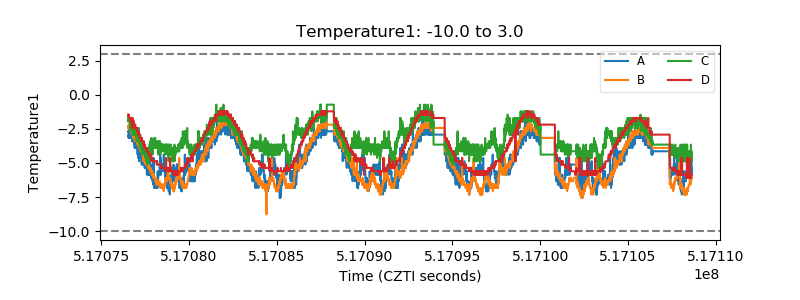 |
| Veto HV Monitor | 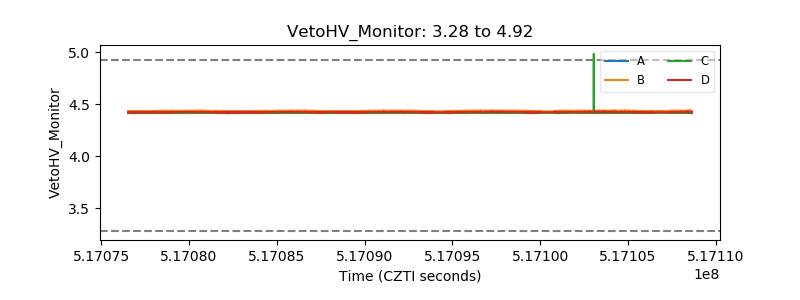 |
| Veto LLD | 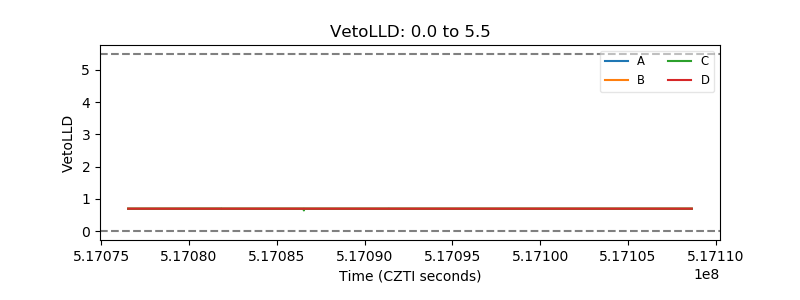 |
| Alpha Counter | 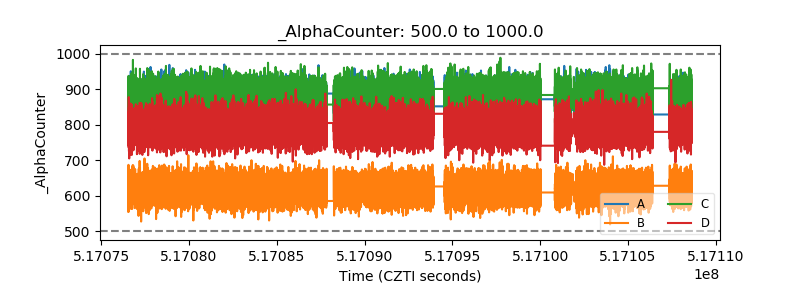 |
| _CPM_Rate | 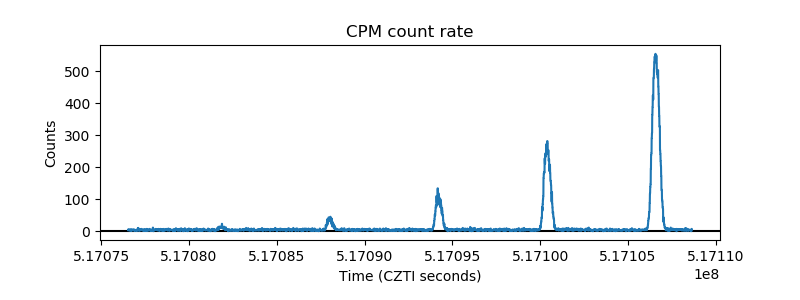 |
| CZT Counter | 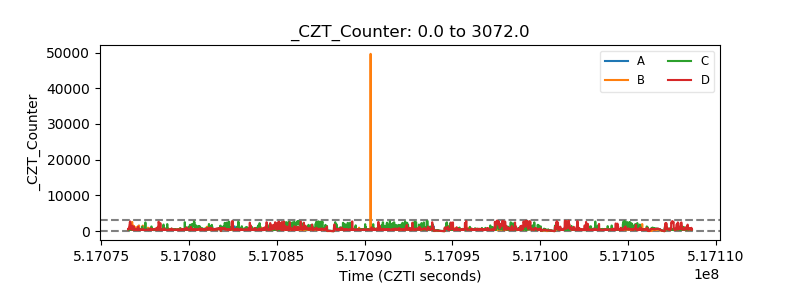 |
| +2.5 Volts monitor | 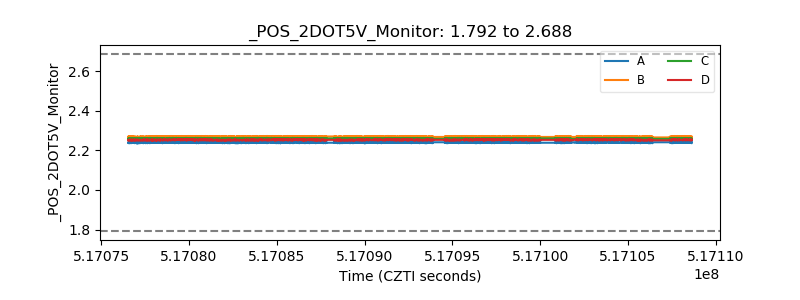 |
| +5 Volts monitor | 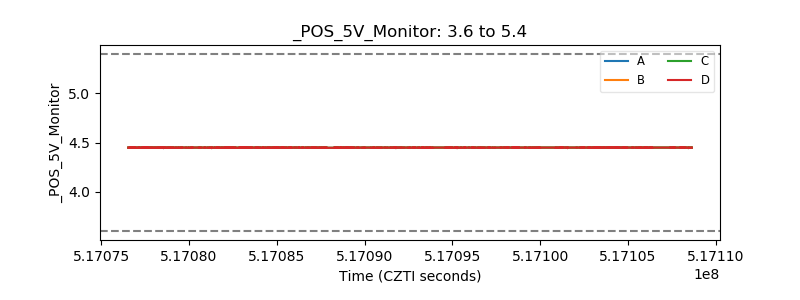 |
| _ROLL_ROT | 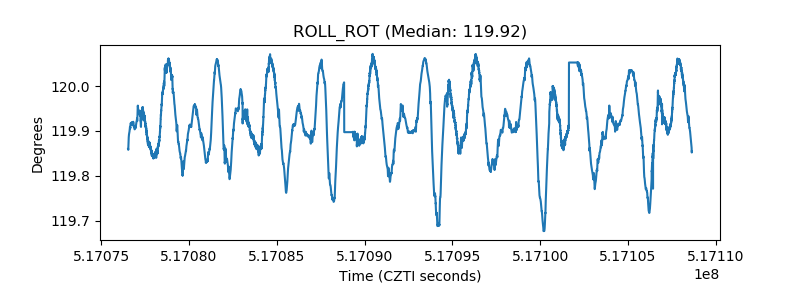 |
| _Roll_DEC | 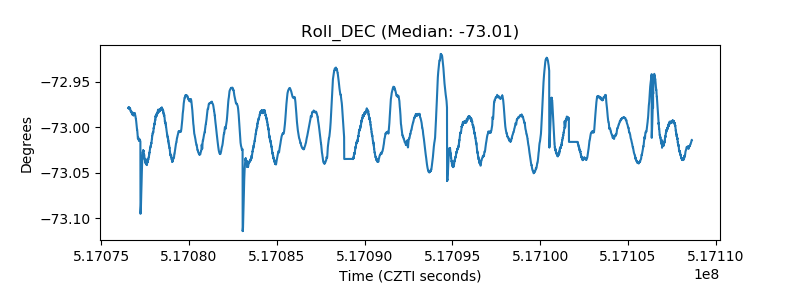 |
| _Roll_RA | 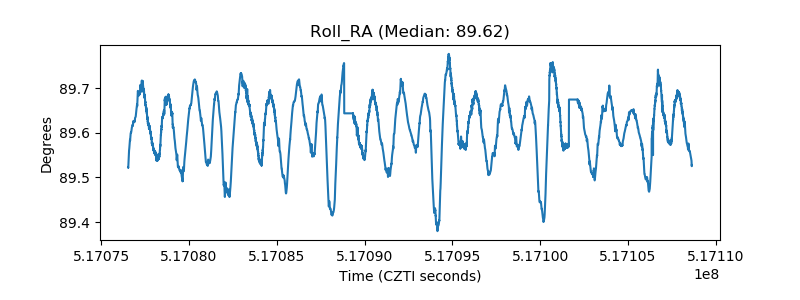 |
| Veto Counter | 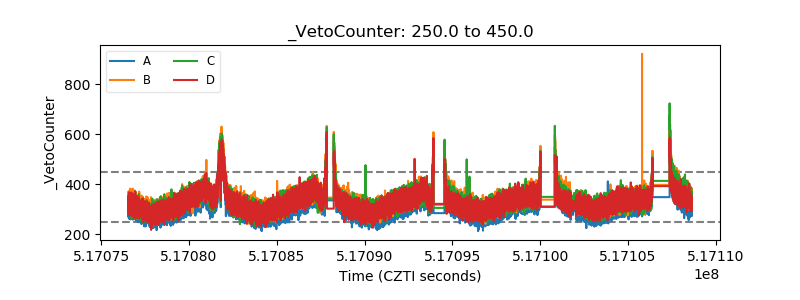 |