| Param | Original file | Final file |
|---|---|---|
| Filename | modeM0/AS1A14_070T08_9000006576_57610cztM0_level2.fits | modeM0/AS1A14_070T08_9000006576_57610cztM0_level2_quad_clean.evt |
| Size (bytes) | 427,878,720 | 92,139,840 |
| Size | 408.1 MB | 87.9 MB |
| Events in quadrant A | 2,961,653 | 610,681 |
| Events in quadrant B | 3,340,607 | 654,703 |
| Events in quadrant C | 3,985,000 | 571,863 |
| Events in quadrant D | 5,036,289 | 491,454 |
| Mode M0 | |||
|---|---|---|---|
| Quadrant | BADHDUFLAG | Total packets | Discarded packets |
| A | 0 | 13520 | 2 |
| B | 0 | 14556 | 2 |
| C | 0 | 16373 | 2 |
| D | 0 | 19536 | 4 |
| Mode M9 | |||
|---|---|---|---|
| Quadrant | BADHDUFLAG | Total packets | Discarded packets |
| A | 0 | 17 | 0 |
| B | 0 | 18 | 0 |
| C | 0 | 18 | 0 |
| D | 0 | 18 | 0 |
| Mode SS | |||
|---|---|---|---|
| Quadrant | BADHDUFLAG | Total packets | Discarded packets |
| A | 0 | 134 | 0 |
| B | 0 | 134 | 0 |
| C | 0 | 134 | 0 |
| D | 0 | 134 | 0 |
| Quadrant | Total seconds | Saturated seconds | Saturation percentage |
|---|---|---|---|
| A | 6617 | 52 | 0.785855% |
| B | 6617 | 119 | 1.798398% |
| C | 6617 | 155 | 2.342451% |
| D | 6616 | 688 | 10.399033% |
Noise dominated data is calculated using 1-second bins in cleaned event files. If a bin has >2000 counts, and if more than 50% of those come from <1% of pixels, then it is considered to be noise-dominated and hence unusable.
| Quadrant | # 1 sec bins | Bins with >0 counts | Bins with >2000 counts | High rate bins dominated by noise | Noise dominated (total time) | Noise dominated (detector-on time) | Marked lightcurve |
|---|---|---|---|---|---|---|---|
| A | 8032 | 6892 | 1 | 1 | 0.01% | 0.01% |  |
| B | 8032 | 6892 | 37 | 37 | 0.46% | 0.54% |  |
| C | 8032 | 6893 | 95 | 95 | 1.18% | 1.38% |  |
| D | 8031 | 6891 | 611 | 611 | 7.61% | 8.87% |  |
Top three noisy pixels from each quadrant. If the there are fewer than three noisy pixels in the level2.evt file, extra rows are filled as -1
| Pixel properties | Quadrant properties | ||||||
|---|---|---|---|---|---|---|---|
| Quadrant | DetID | PixID | Counts | Sigma | Mean | Median | Sigma |
| A | 3 | 14 | 59681 | 323.28 | 743 | 724 | 182.4 |
| A | 4 | 3 | 27693 | 147.88 | 743 | 724 | 182.4 |
| A | 3 | 128 | 9886 | 50.24 | 743 | 724 | 182.4 |
| B | 0 | 63 | 122602 | 784.08 | 733 | 705 | 155.5 |
| B | 10 | 247 | 112228 | 717.35 | 733 | 705 | 155.5 |
| B | 5 | 185 | 99552 | 635.82 | 733 | 705 | 155.5 |
| C | 15 | 224 | 743190 | 3770.81 | 726 | 718 | 196.9 |
| C | 9 | 38 | 153702 | 776.96 | 726 | 718 | 196.9 |
| C | 12 | 252 | 151846 | 767.53 | 726 | 718 | 196.9 |
| D | 15 | 142 | 1592329 | 8382.31 | 679 | 649 | 189.9 |
| D | 8 | 240 | 316251 | 1662.06 | 679 | 649 | 189.9 |
| D | 2 | 249 | 262453 | 1378.75 | 679 | 649 | 189.9 |
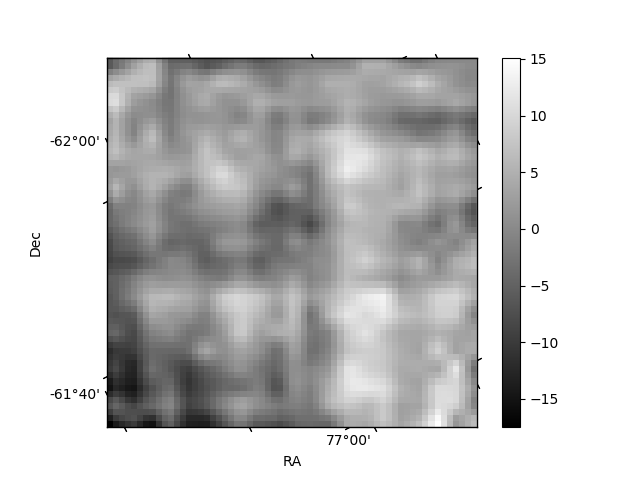
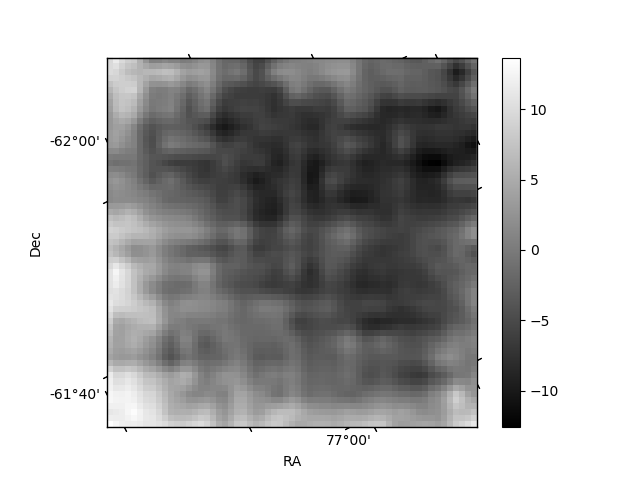
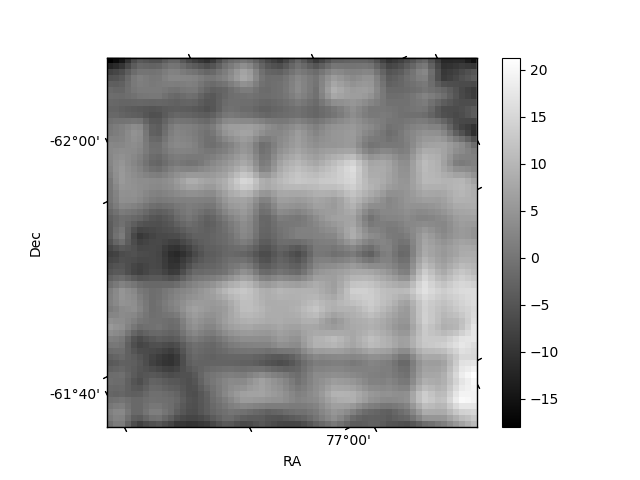
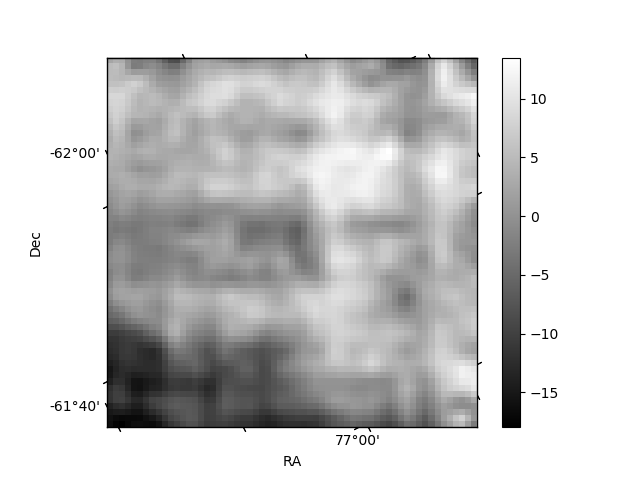
Histogram calculated using DETX and DETY for each event in the final _common_clean file
| Quadrant A | 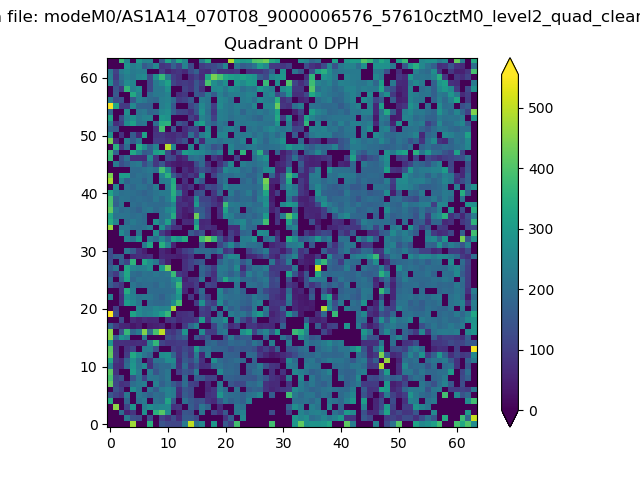 |
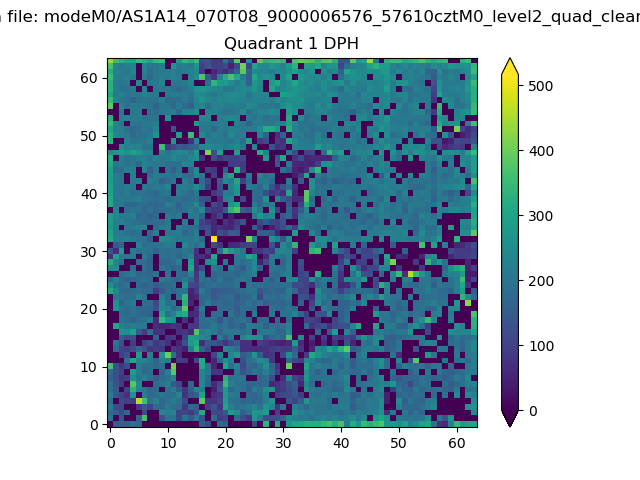 |
Quadrant B |
|---|---|---|---|
| Quadrant D | 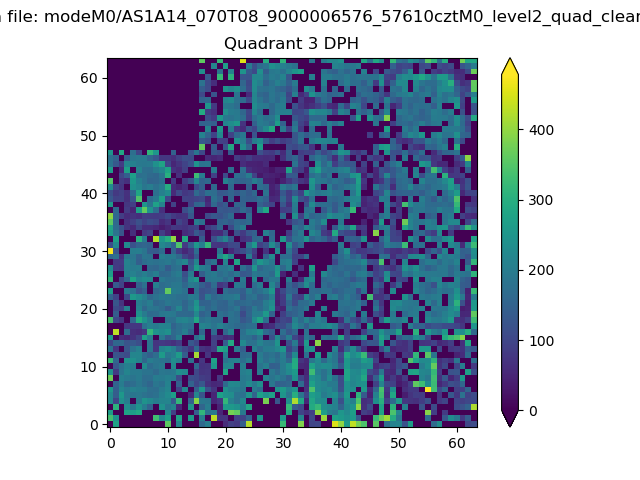 |
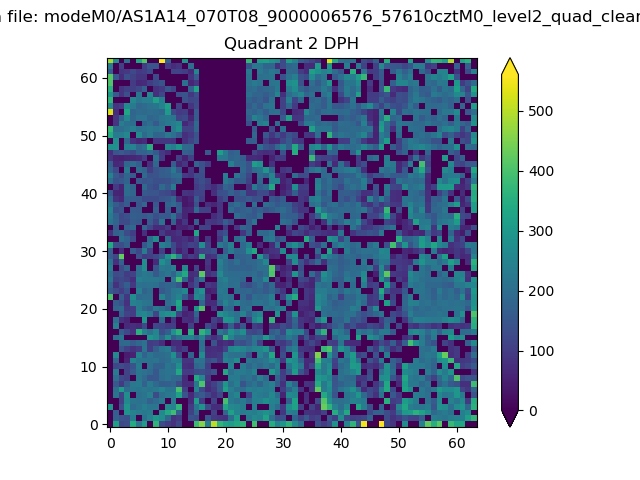 |
Quadrant C |
| Plot type | Count rate plots | Images |
|---|---|---|
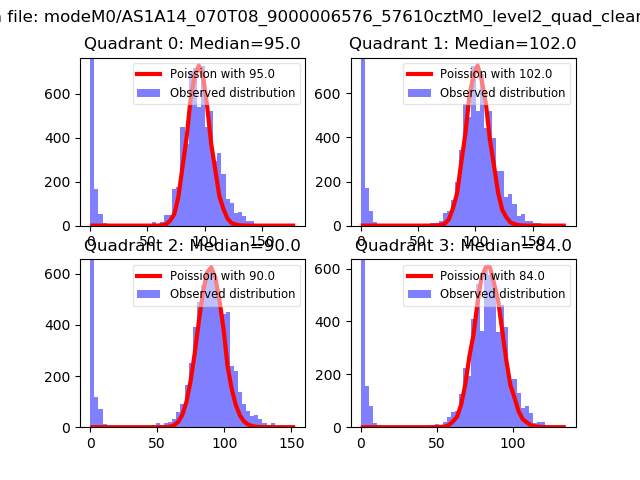
| Comparison with Poisson distribution Blue bars denote a histogram of data divided into 1 sec bins. Red curve is a Poisson curve with rate = median count rate of data. |
 |
 |
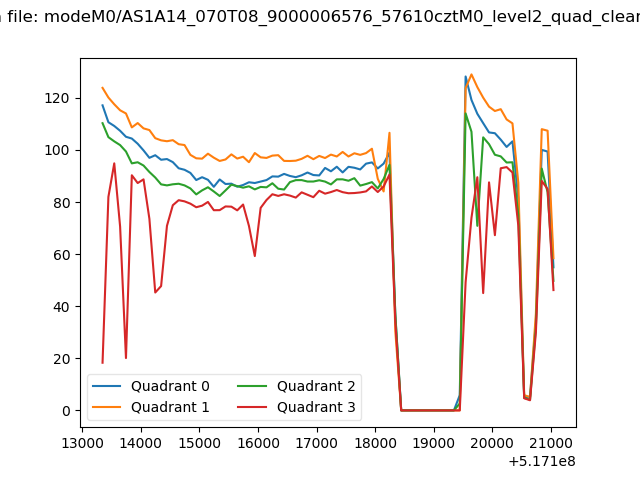
| Quadrant-wise count rates Data is divided into 100 sec bins |
 |
|
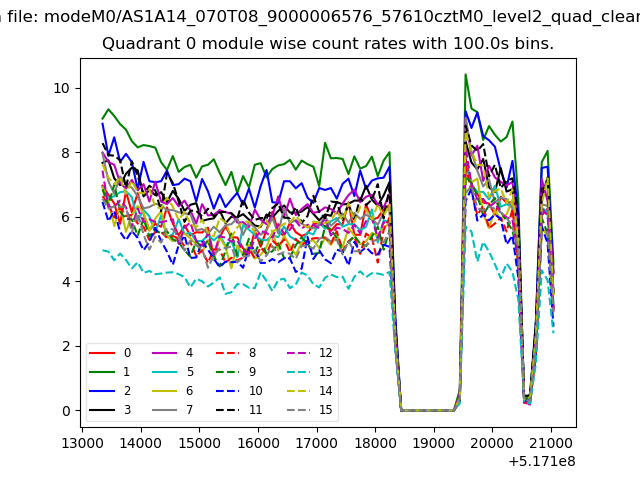
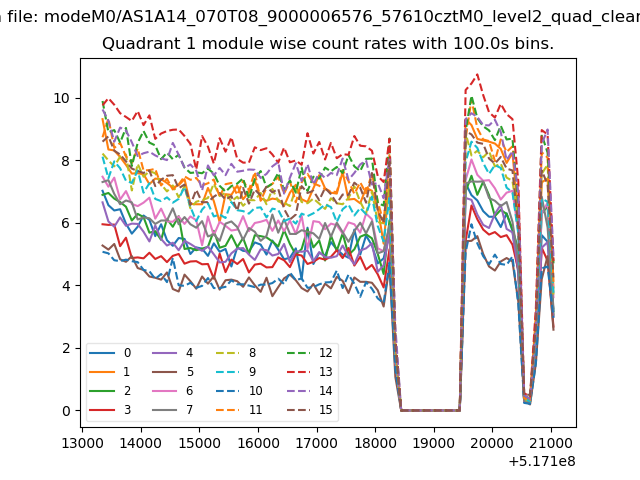
| Module-wise count rates for Quadrant A Data is divided into 100 sec bins |
 |
 |
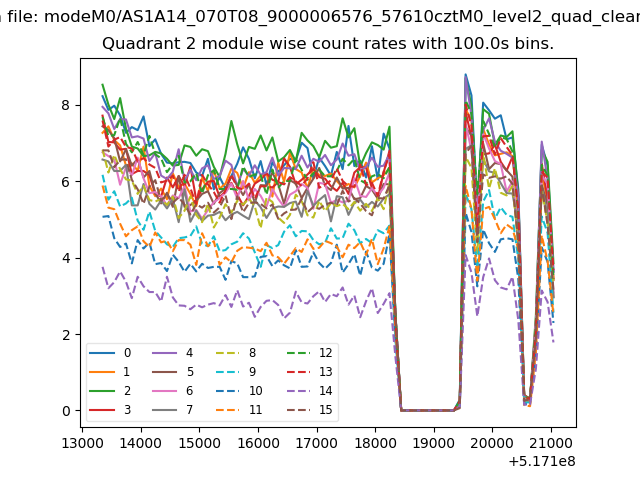
| Module-wise count rates for Quadrant B Data is divided into 100 sec bins |
 |
 |
| Module-wise count rates for Quadrant C Data is divided into 100 sec bins |
 |
 |
| Module-wise count rates for Quadrant D Data is divided into 100 sec bins |
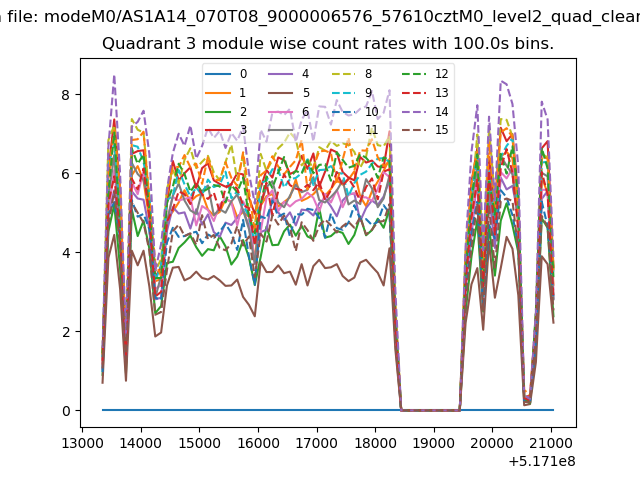 |
 |
| Parameter | Plot |
|---|---|
| CZT HV Monitor | 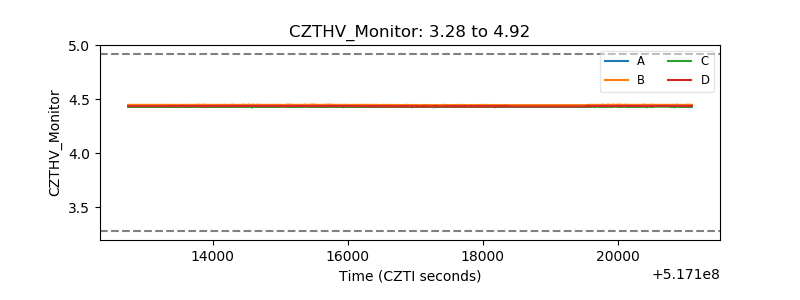 |
| D_VDD | 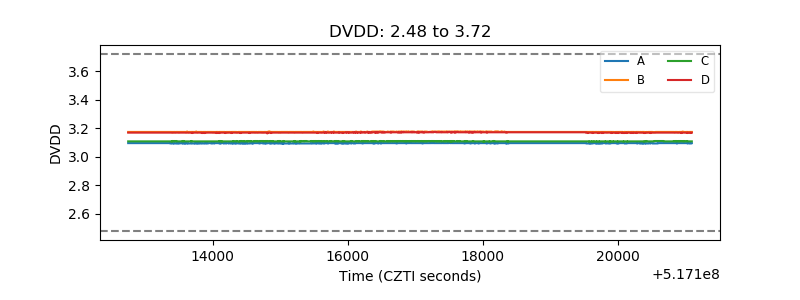 |
| Temperature 1 | 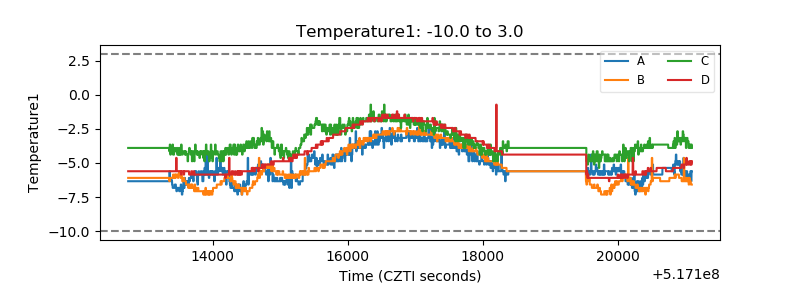 |
| Veto HV Monitor | 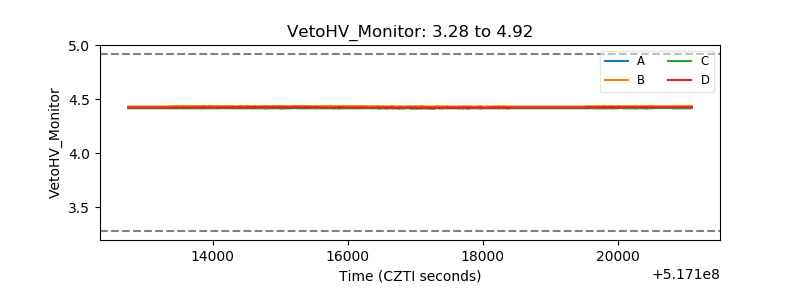 |
| Veto LLD | 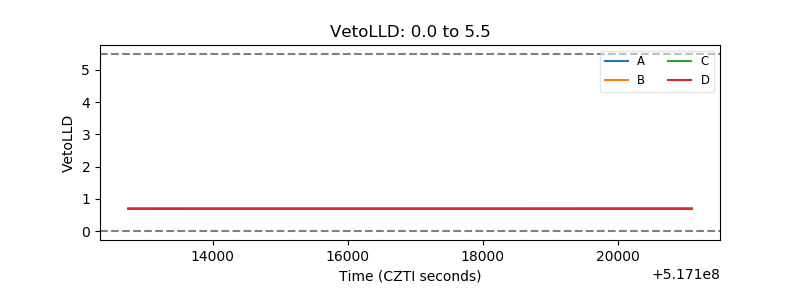 |
| Alpha Counter | 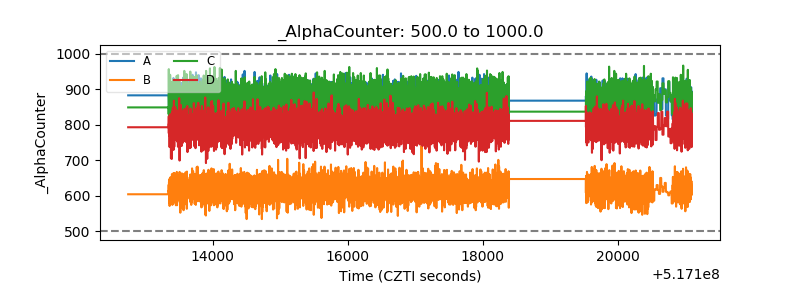 |
| _CPM_Rate | 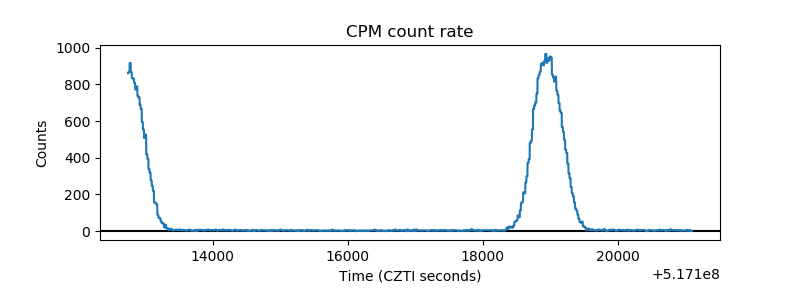 |
| CZT Counter | 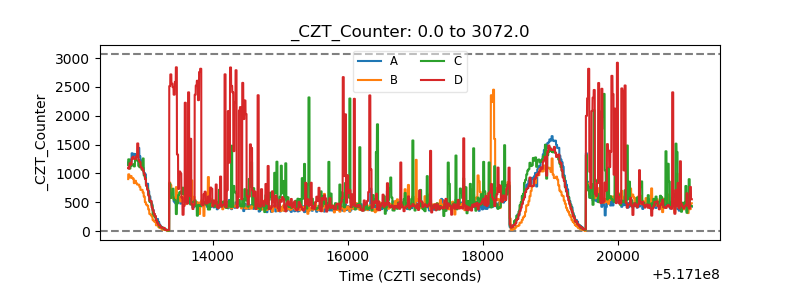 |
| +2.5 Volts monitor |  |
| +5 Volts monitor | 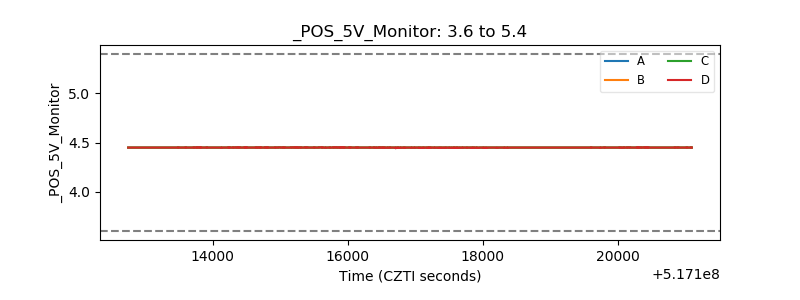 |
| _ROLL_ROT | 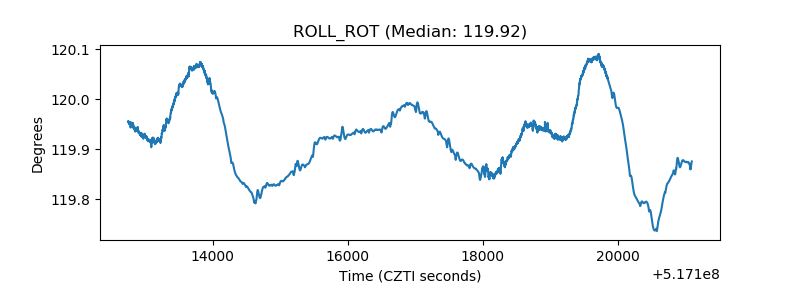 |
| _Roll_DEC | 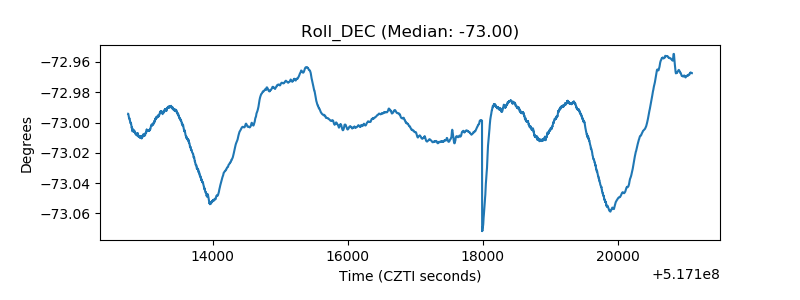 |
| _Roll_RA | 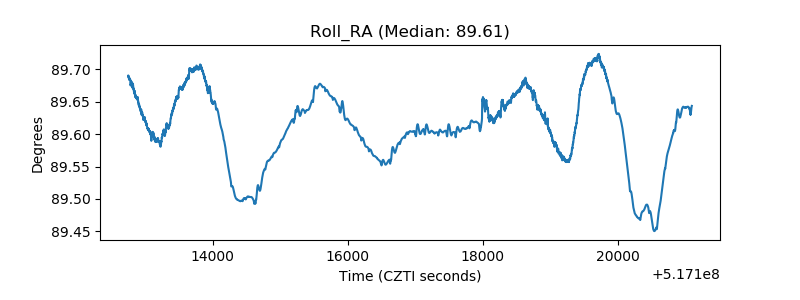 |
| Veto Counter | 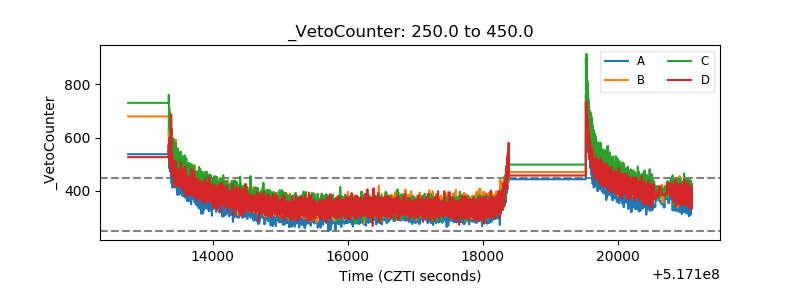 |