| Param | Original file | Final file |
|---|---|---|
| Filename | modeM0/AS1A14_070T08_9000006576_57611cztM0_level2.fits | modeM0/AS1A14_070T08_9000006576_57611cztM0_level2_quad_clean.evt |
| Size (bytes) | 440,084,160 | 89,472,960 |
| Size | 419.7 MB | 85.3 MB |
| Events in quadrant A | 2,843,242 | 593,297 |
| Events in quadrant B | 3,862,013 | 632,458 |
| Events in quadrant C | 3,950,713 | 556,533 |
| Events in quadrant D | 5,140,324 | 483,837 |
| Mode M0 | |||
|---|---|---|---|
| Quadrant | BADHDUFLAG | Total packets | Discarded packets |
| A | 0 | 12946 | 1 |
| B | 0 | 15844 | 1 |
| C | 0 | 16062 | 1 |
| D | 0 | 19624 | 1 |
| Mode M9 | |||
|---|---|---|---|
| Quadrant | BADHDUFLAG | Total packets | Discarded packets |
| A | 0 | 12 | 0 |
| B | 0 | 12 | 0 |
| C | 0 | 12 | 0 |
| D | 0 | 12 | 0 |
| Mode SS | |||
|---|---|---|---|
| Quadrant | BADHDUFLAG | Total packets | Discarded packets |
| A | 0 | 128 | 0 |
| B | 0 | 128 | 0 |
| C | 0 | 128 | 0 |
| D | 0 | 128 | 0 |
| Quadrant | Total seconds | Saturated seconds | Saturation percentage |
|---|---|---|---|
| A | 6355 | 43 | 0.676633% |
| B | 6356 | 268 | 4.216488% |
| C | 6356 | 203 | 3.193833% |
| D | 6356 | 657 | 10.336690% |
Noise dominated data is calculated using 1-second bins in cleaned event files. If a bin has >2000 counts, and if more than 50% of those come from <1% of pixels, then it is considered to be noise-dominated and hence unusable.
| Quadrant | # 1 sec bins | Bins with >0 counts | Bins with >2000 counts | High rate bins dominated by noise | Noise dominated (total time) | Noise dominated (detector-on time) | Marked lightcurve |
|---|---|---|---|---|---|---|---|
| A | 7810 | 6630 | 6 | 6 | 0.08% | 0.09% | 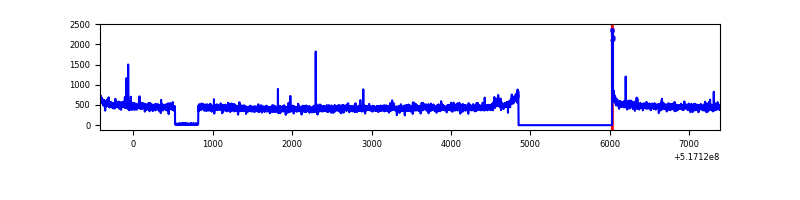 |
| B | 7811 | 6631 | 112 | 112 | 1.43% | 1.69% | 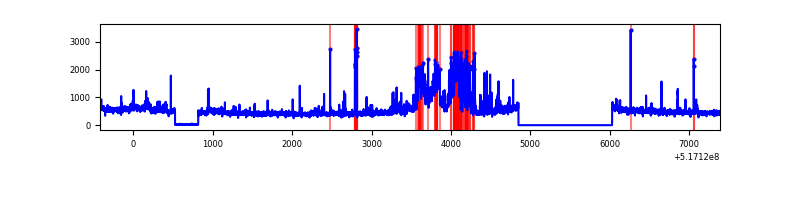 |
| C | 7811 | 6631 | 136 | 136 | 1.74% | 2.05% | 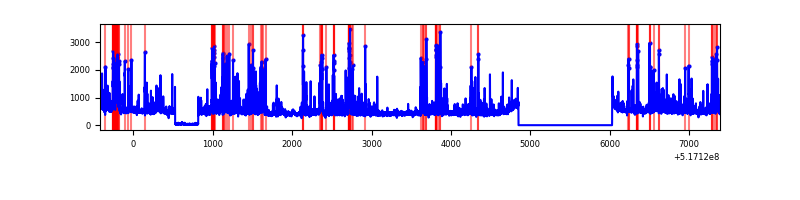 |
| D | 7811 | 6631 | 573 | 573 | 7.34% | 8.64% | 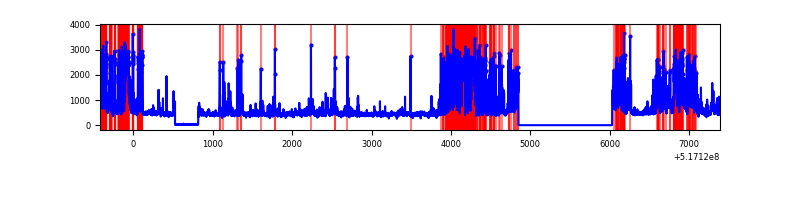 |
Top three noisy pixels from each quadrant. If the there are fewer than three noisy pixels in the level2.evt file, extra rows are filled as -1
| Pixel properties | Quadrant properties | ||||||
|---|---|---|---|---|---|---|---|
| Quadrant | DetID | PixID | Counts | Sigma | Mean | Median | Sigma |
| A | 3 | 14 | 31403 | 173.3 | 718 | 700 | 177.2 |
| A | 3 | 245 | 17164 | 92.93 | 718 | 700 | 177.2 |
| A | 3 | 128 | 17118 | 92.67 | 718 | 700 | 177.2 |
| B | 5 | 185 | 625443 | 4187.39 | 707 | 680 | 149.2 |
| B | 5 | 172 | 112070 | 746.58 | 707 | 680 | 149.2 |
| B | 0 | 63 | 90554 | 602.37 | 707 | 680 | 149.2 |
| C | 15 | 224 | 863092 | 4540.25 | 701 | 694 | 189.9 |
| C | 9 | 38 | 185927 | 975.19 | 701 | 694 | 189.9 |
| C | 14 | 254 | 71461 | 372.57 | 701 | 694 | 189.9 |
| D | 15 | 94 | 813655 | 4316.56 | 671 | 640 | 188.3 |
| D | 15 | 142 | 608163 | 3225.54 | 671 | 640 | 188.3 |
| D | 2 | 249 | 568688 | 3015.95 | 671 | 640 | 188.3 |
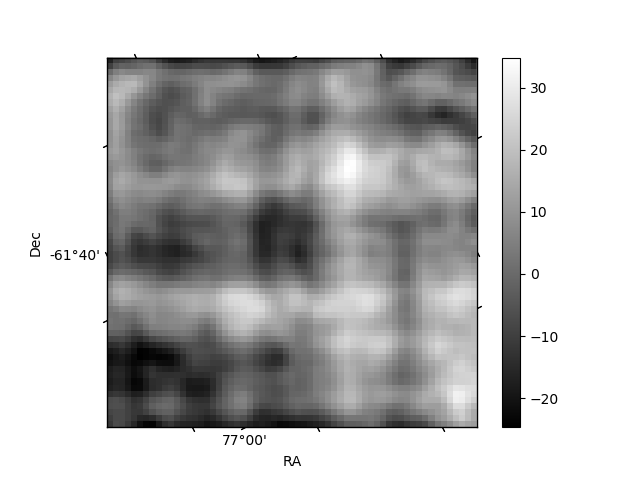
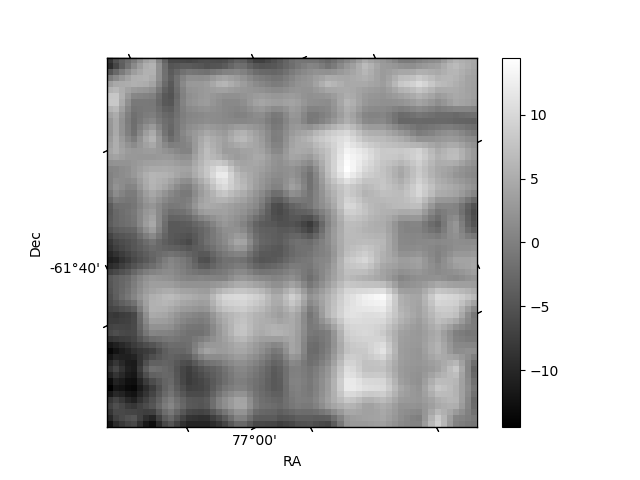
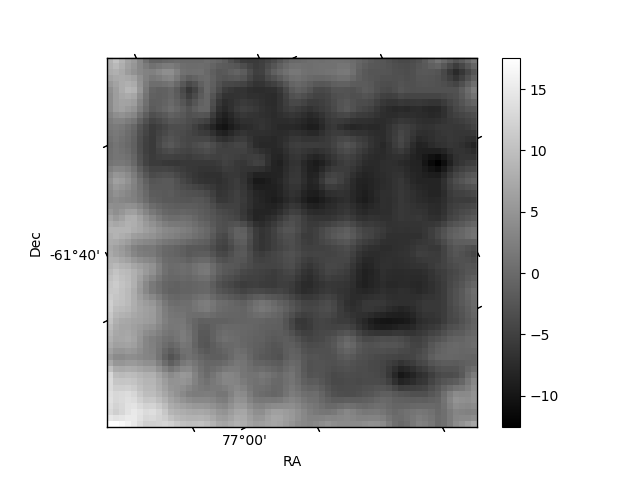
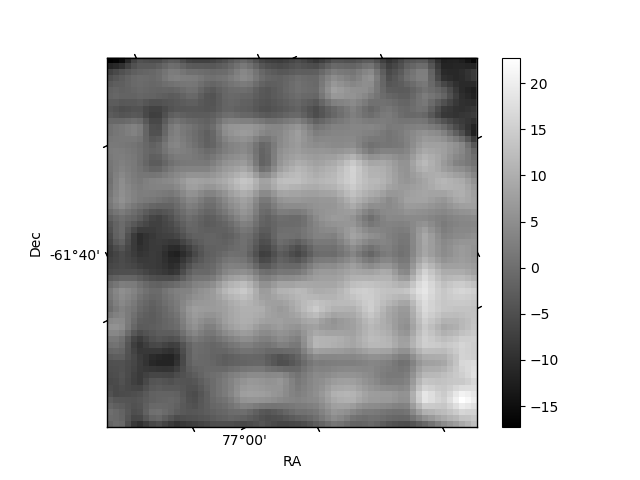
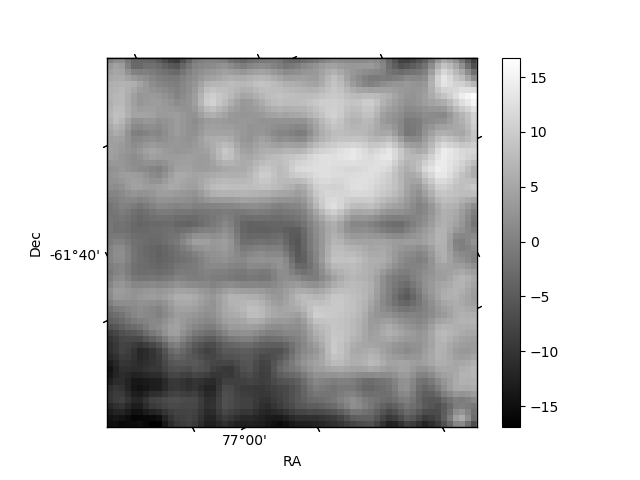
Histogram calculated using DETX and DETY for each event in the final _common_clean file
| Quadrant A | 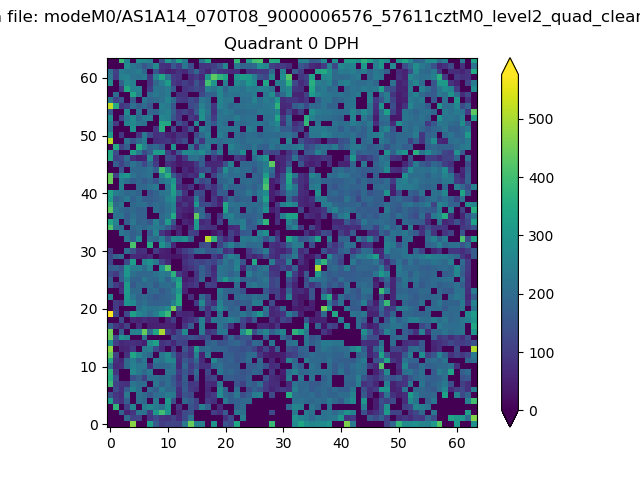 |
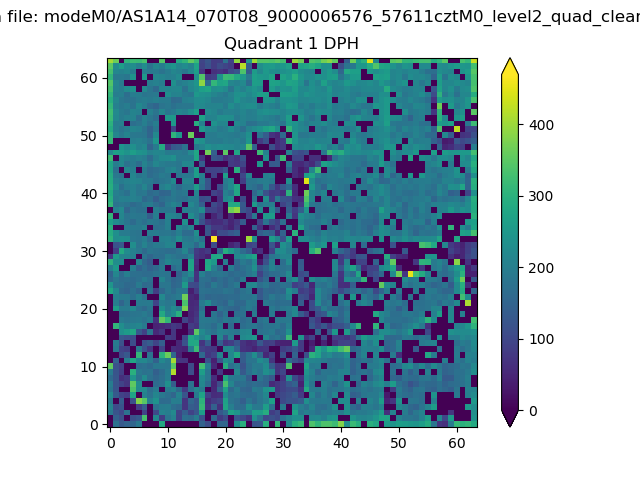 |
Quadrant B |
|---|---|---|---|
| Quadrant D | 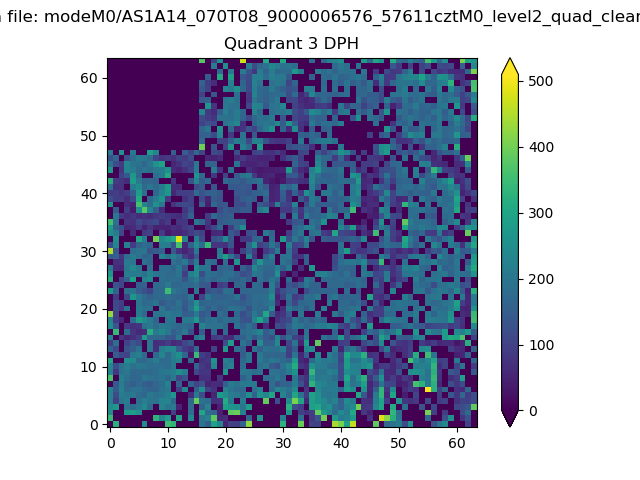 |
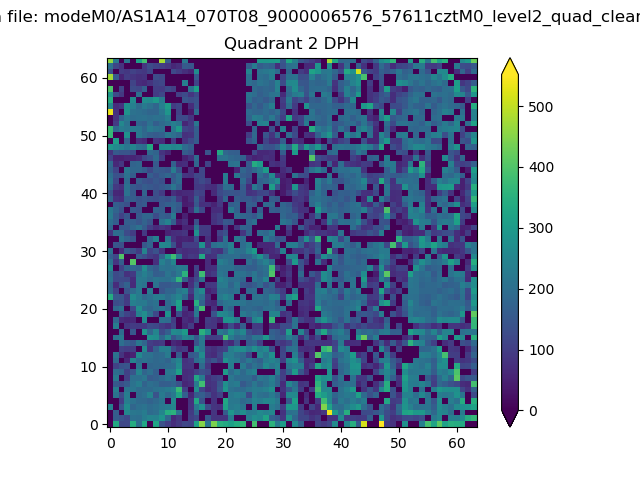 |
Quadrant C |
| Plot type | Count rate plots | Images |
|---|---|---|
| Comparison with Poisson distribution Blue bars denote a histogram of data divided into 1 sec bins. Red curve is a Poisson curve with rate = median count rate of data. |
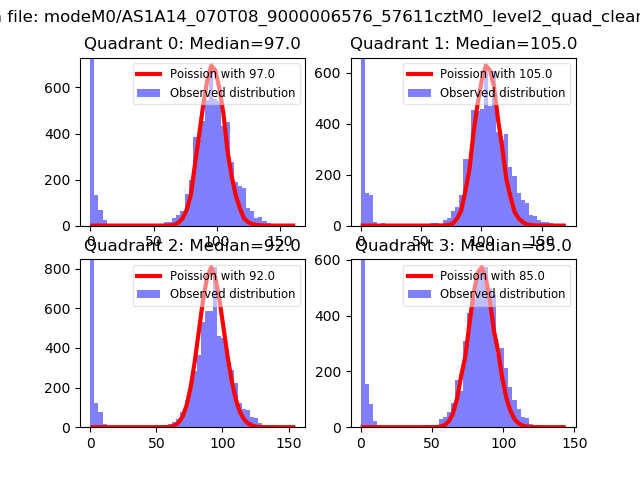 |
 |
| Quadrant-wise count rates Data is divided into 100 sec bins |
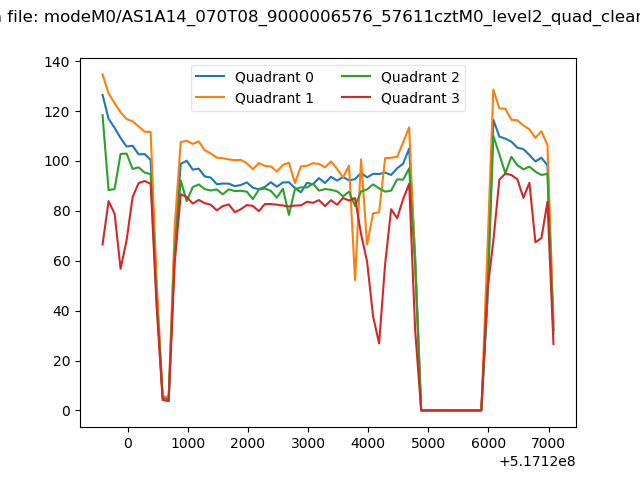 |
|
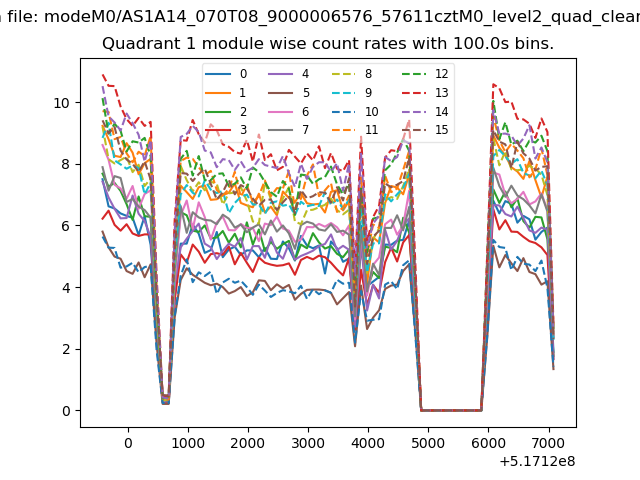
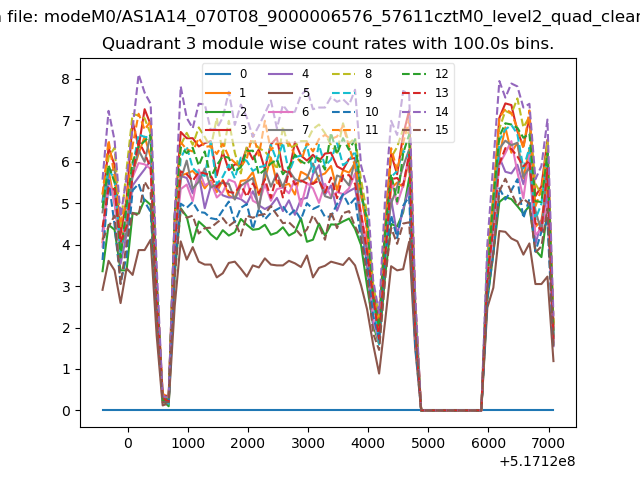
| Module-wise count rates for Quadrant A Data is divided into 100 sec bins |
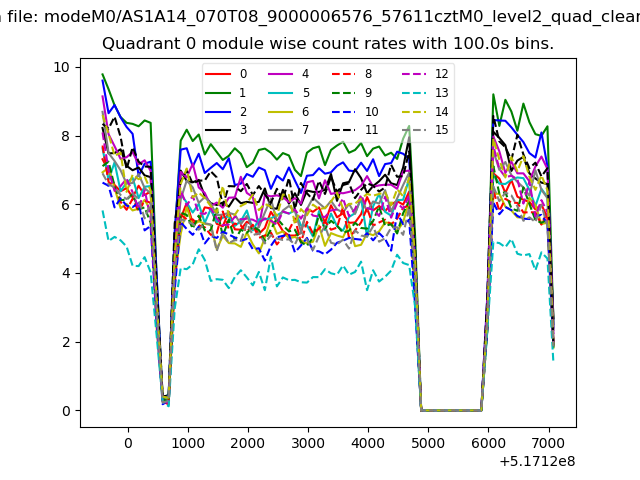 |
 |
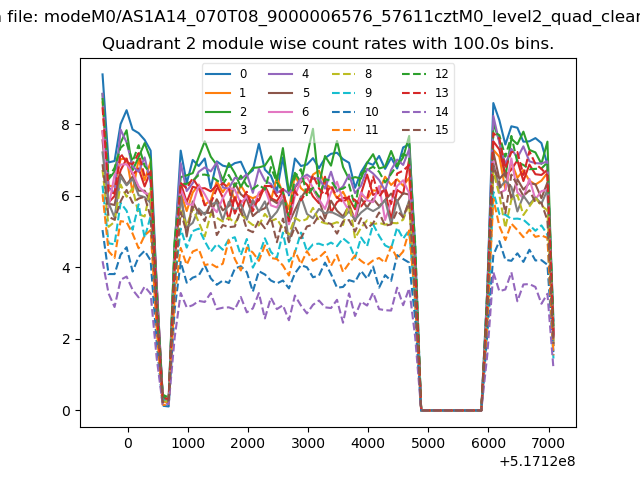
| Module-wise count rates for Quadrant B Data is divided into 100 sec bins |
 |
 |
| Module-wise count rates for Quadrant C Data is divided into 100 sec bins |
 |
 |
| Module-wise count rates for Quadrant D Data is divided into 100 sec bins |
 |
 |
| Parameter | Plot |
|---|---|
| CZT HV Monitor | 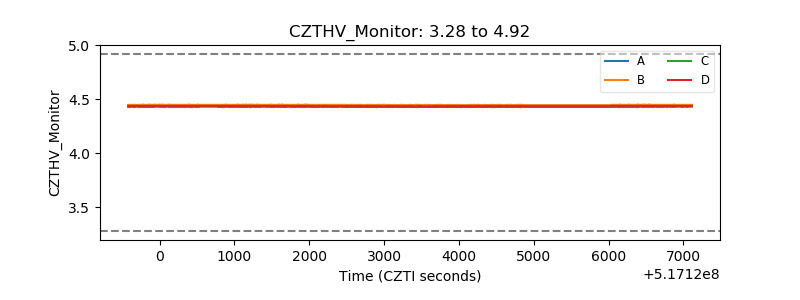 |
| D_VDD | 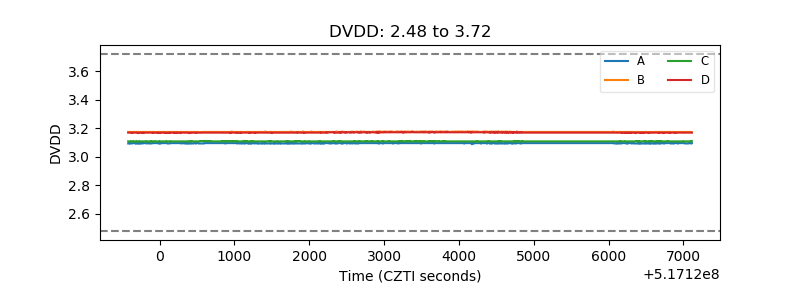 |
| Temperature 1 | 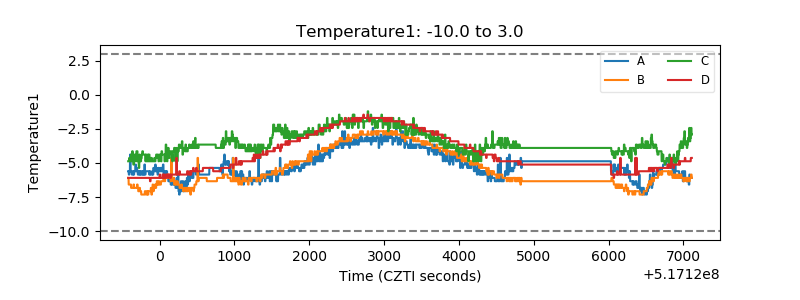 |
| Veto HV Monitor | 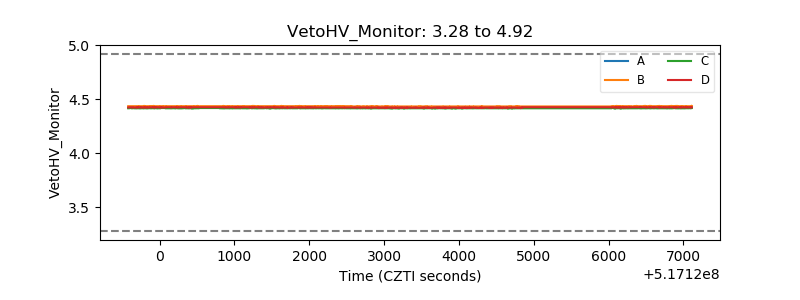 |
| Veto LLD | 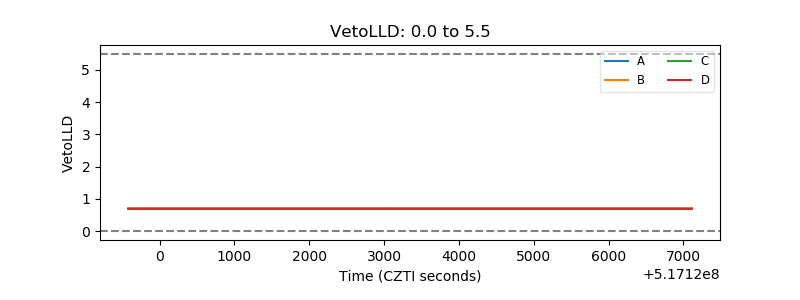 |
| Alpha Counter | 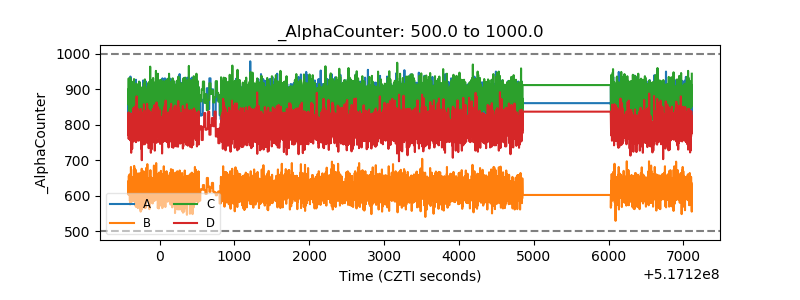 |
| _CPM_Rate | 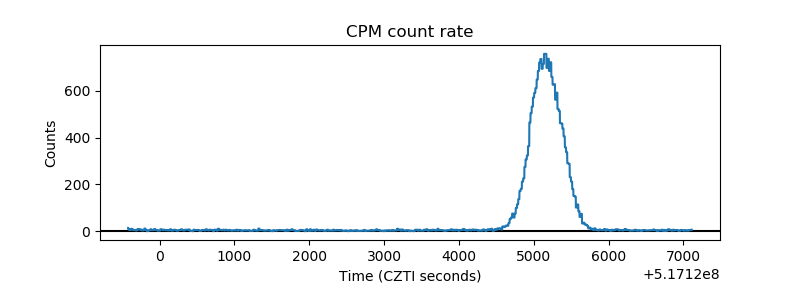 |
| CZT Counter | 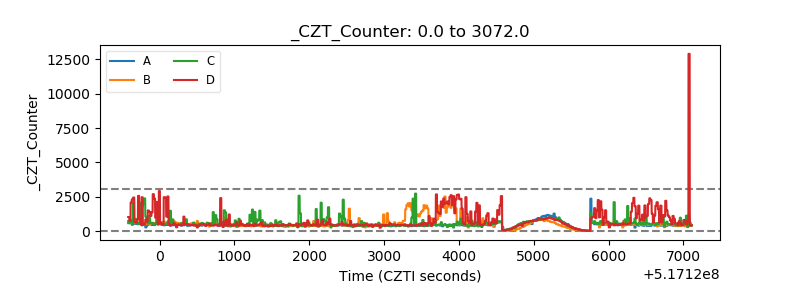 |
| +2.5 Volts monitor | 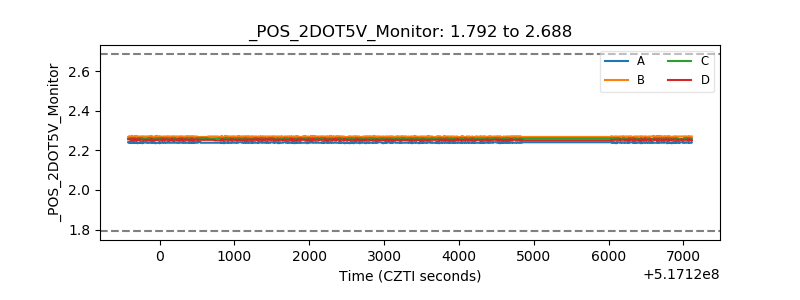 |
| +5 Volts monitor | 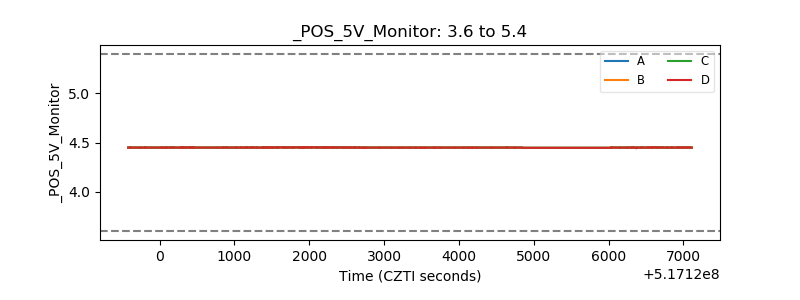 |
| _ROLL_ROT | 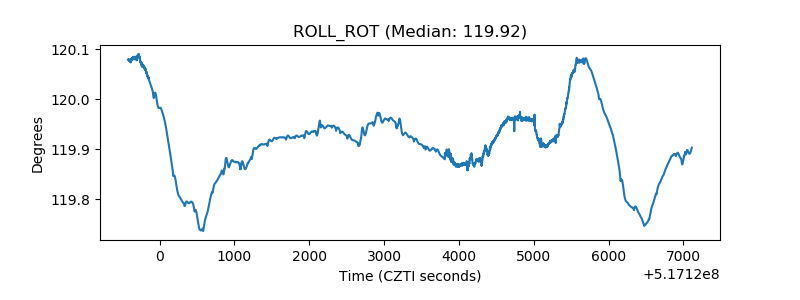 |
| _Roll_DEC | 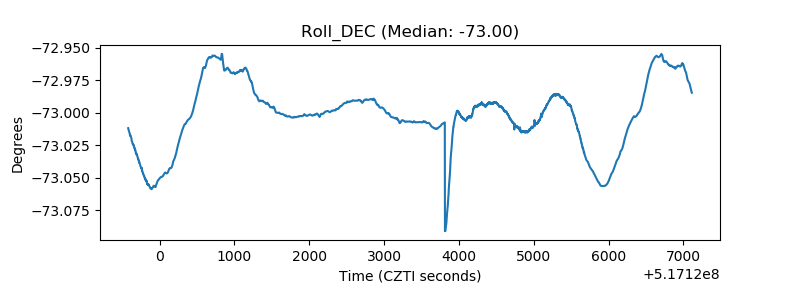 |
| _Roll_RA | 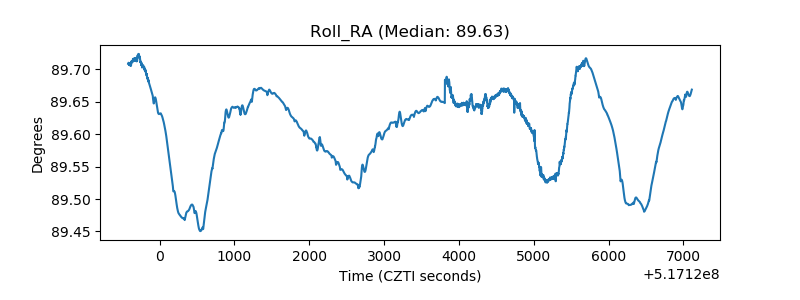 |
| Veto Counter | 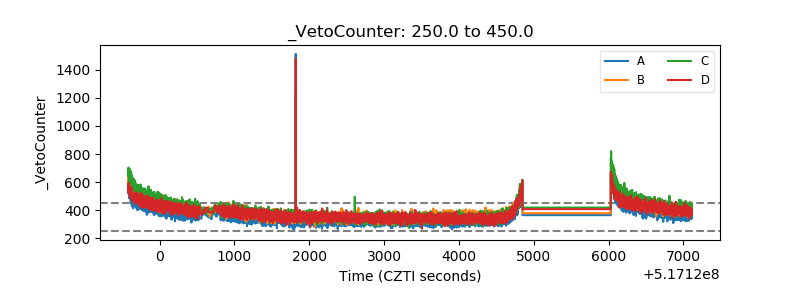 |