| Param | Original file | Final file |
|---|---|---|
| Filename | modeM0/AS1A14_070T08_9000006576_57613cztM0_level2.fits | modeM0/AS1A14_070T08_9000006576_57613cztM0_level2_quad_clean.evt |
| Size (bytes) | 1,761,785,280 | 396,722,880 |
| Size | 1.6 GB | 378.3 MB |
| Events in quadrant A | 11,917,845 | 2,651,980 |
| Events in quadrant B | 13,915,766 | 2,826,676 |
| Events in quadrant C | 15,380,505 | 2,528,096 |
| Events in quadrant D | 21,922,889 | 2,159,419 |
| Mode M0 | |||
|---|---|---|---|
| Quadrant | BADHDUFLAG | Total packets | Discarded packets |
| A | 0 | 54878 | 5 |
| B | 0 | 60537 | 5 |
| C | 0 | 64462 | 5 |
| D | 0 | 83891 | 5 |
| Mode M9 | |||
|---|---|---|---|
| Quadrant | BADHDUFLAG | Total packets | Discarded packets |
| A | 0 | 57 | 0 |
| B | 0 | 57 | 0 |
| C | 0 | 57 | 0 |
| D | 0 | 57 | 0 |
| Mode SS | |||
|---|---|---|---|
| Quadrant | BADHDUFLAG | Total packets | Discarded packets |
| A | 0 | 544 | 0 |
| B | 0 | 544 | 0 |
| C | 0 | 544 | 0 |
| D | 0 | 544 | 0 |
| Quadrant | Total seconds | Saturated seconds | Saturation percentage |
|---|---|---|---|
| A | 26858 | 260 | 0.968054% |
| B | 26857 | 725 | 2.699482% |
| C | 26857 | 618 | 2.301076% |
| D | 26858 | 3058 | 11.385807% |
Noise dominated data is calculated using 1-second bins in cleaned event files. If a bin has >2000 counts, and if more than 50% of those come from <1% of pixels, then it is considered to be noise-dominated and hence unusable.
| Quadrant | # 1 sec bins | Bins with >0 counts | Bins with >2000 counts | High rate bins dominated by noise | Noise dominated (total time) | Noise dominated (detector-on time) | Marked lightcurve |
|---|---|---|---|---|---|---|---|
| A | 32643 | 27134 | 8 | 8 | 0.02% | 0.03% | 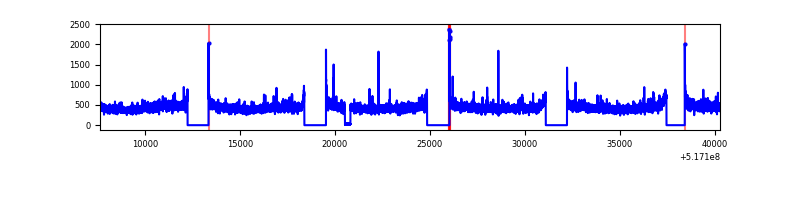 |
| B | 32642 | 27133 | 295 | 295 | 0.90% | 1.09% | 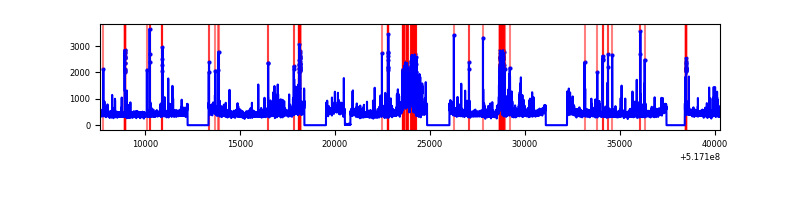 |
| C | 32642 | 27136 | 358 | 358 | 1.10% | 1.32% | 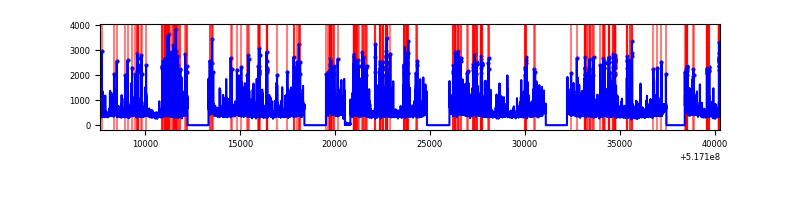 |
| D | 32642 | 27133 | 2797 | 2797 | 8.57% | 10.31% | 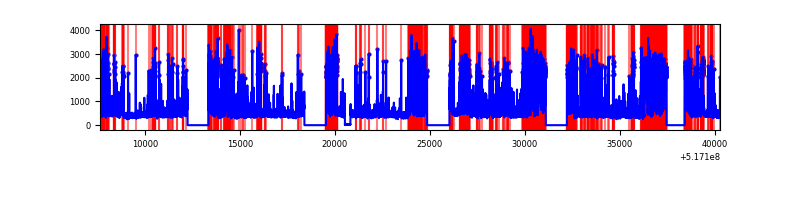 |
Top three noisy pixels from each quadrant. If the there are fewer than three noisy pixels in the level2.evt file, extra rows are filled as -1
| Pixel properties | Quadrant properties | ||||||
|---|---|---|---|---|---|---|---|
| Quadrant | DetID | PixID | Counts | Sigma | Mean | Median | Sigma |
| A | 3 | 14 | 369437 | 510.59 | 2953 | 2878 | 717.9 |
| A | 3 | 128 | 74467 | 99.72 | 2953 | 2878 | 717.9 |
| A | 4 | 3 | 69269 | 92.48 | 2953 | 2878 | 717.9 |
| B | 5 | 185 | 1176817 | 1920.82 | 2902 | 2787 | 611.2 |
| B | 10 | 247 | 352445 | 572.07 | 2902 | 2787 | 611.2 |
| B | 0 | 63 | 172565 | 277.77 | 2902 | 2787 | 611.2 |
| C | 15 | 224 | 2981820 | 3862.8 | 2866 | 2834 | 771.2 |
| C | 9 | 38 | 321269 | 412.91 | 2866 | 2834 | 771.2 |
| C | 12 | 252 | 256038 | 328.32 | 2866 | 2834 | 771.2 |
| D | 15 | 142 | 4660626 | 6139.74 | 2696 | 2572 | 758.7 |
| D | 15 | 94 | 1946706 | 2562.55 | 2696 | 2572 | 758.7 |
| D | 2 | 249 | 1839337 | 2421.02 | 2696 | 2572 | 758.7 |
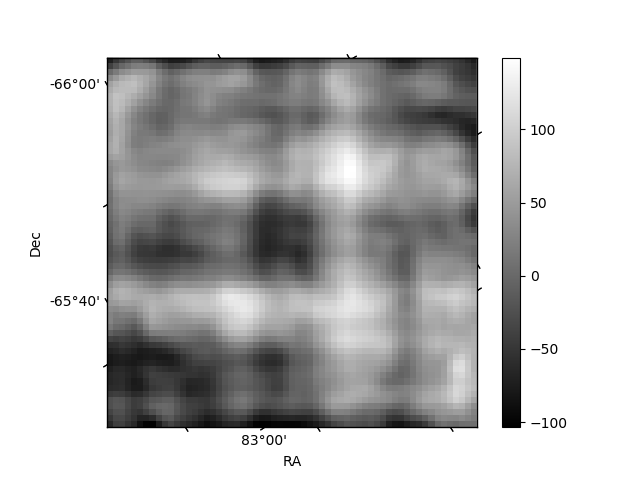
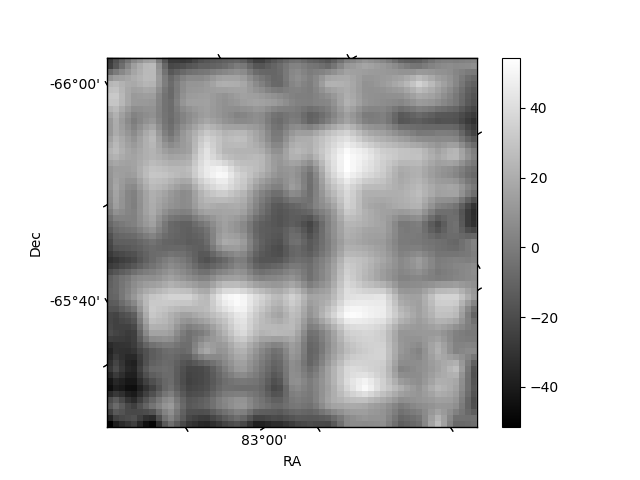
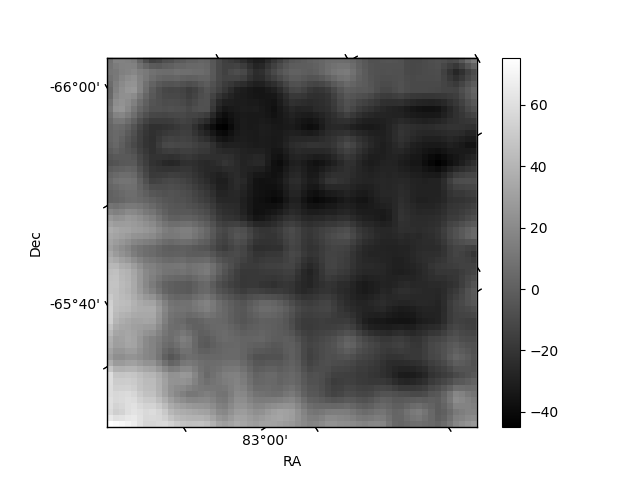
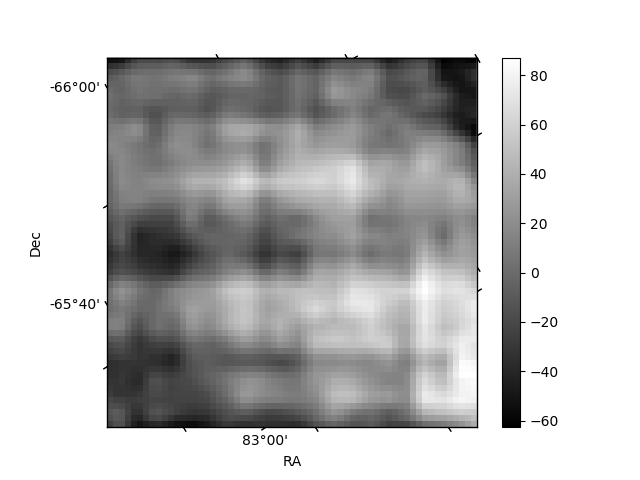
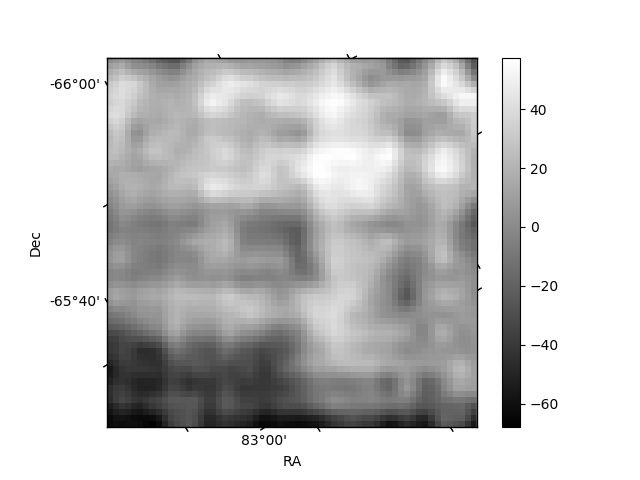
Histogram calculated using DETX and DETY for each event in the final _common_clean file
| Quadrant A | 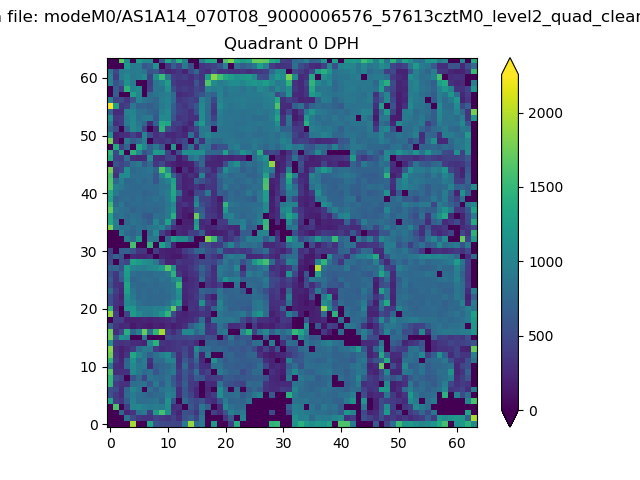 |
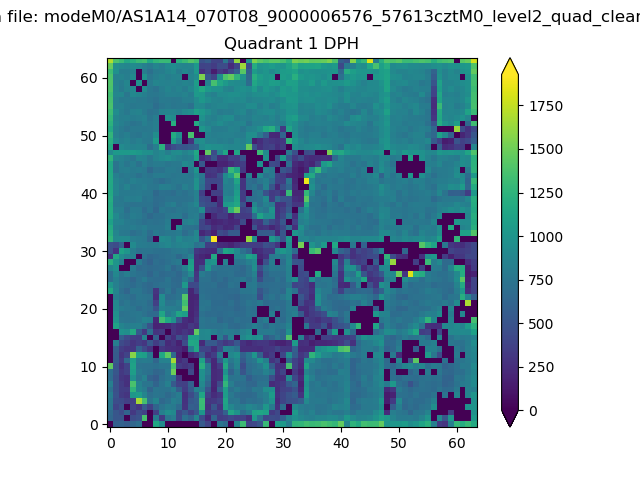 |
Quadrant B |
|---|---|---|---|
| Quadrant D | 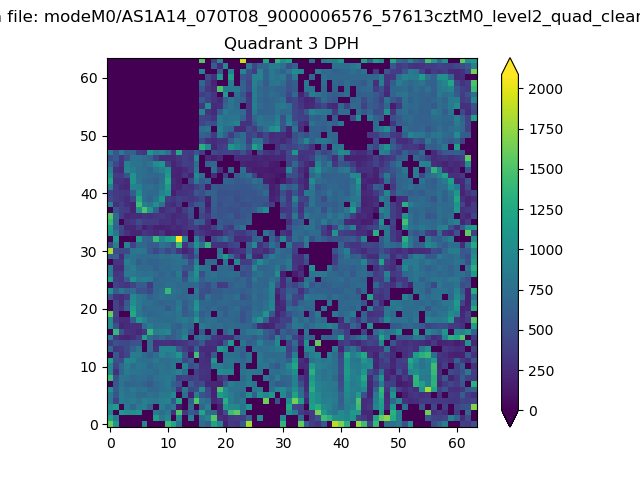 |
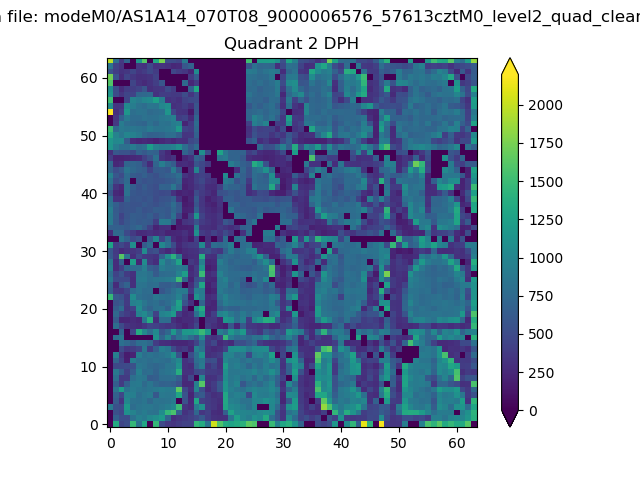 |
Quadrant C |
| Plot type | Count rate plots | Images |
|---|---|---|
| Comparison with Poisson distribution Blue bars denote a histogram of data divided into 1 sec bins. Red curve is a Poisson curve with rate = median count rate of data. |
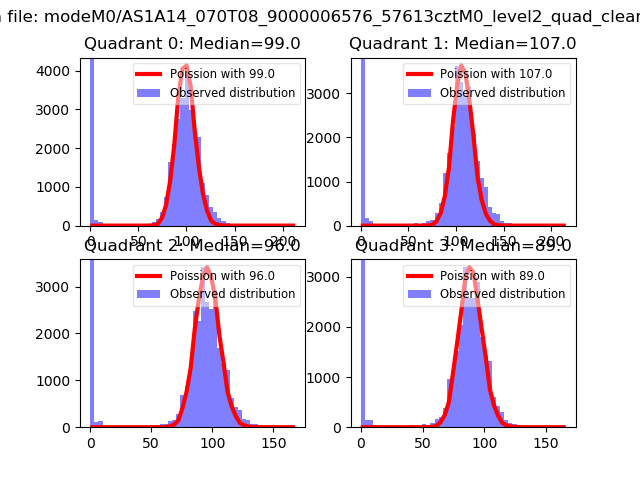 |
 |
| Quadrant-wise count rates Data is divided into 100 sec bins |
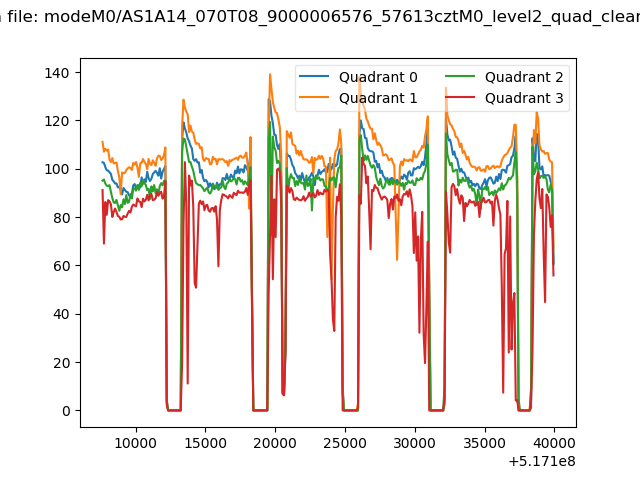 |
|
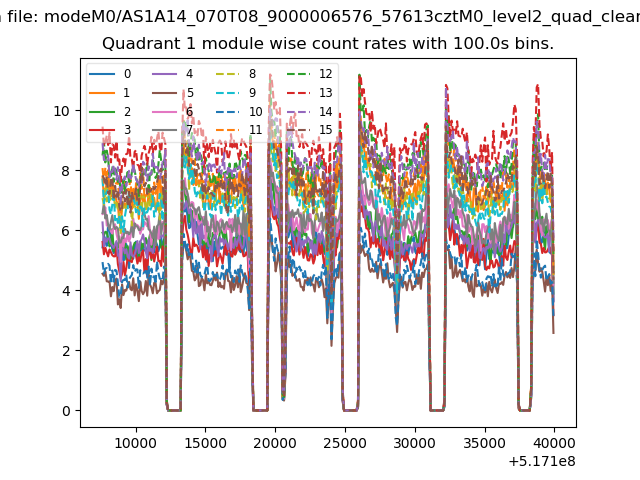
| Module-wise count rates for Quadrant A Data is divided into 100 sec bins |
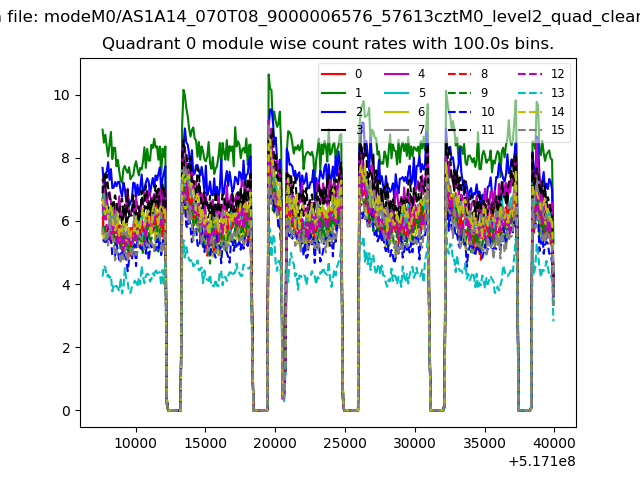 |
 |
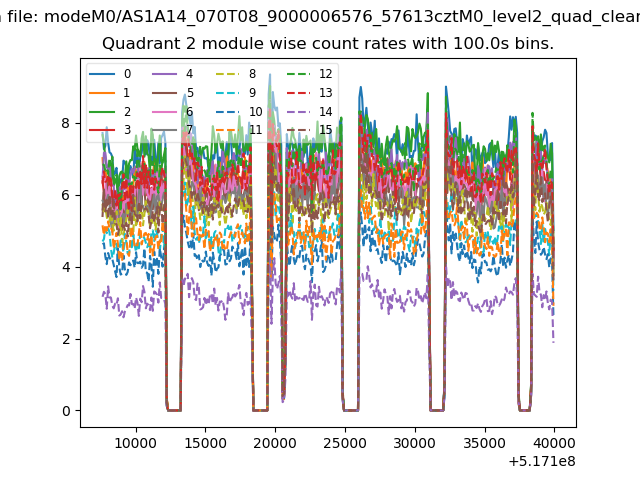
| Module-wise count rates for Quadrant B Data is divided into 100 sec bins |
 |
 |
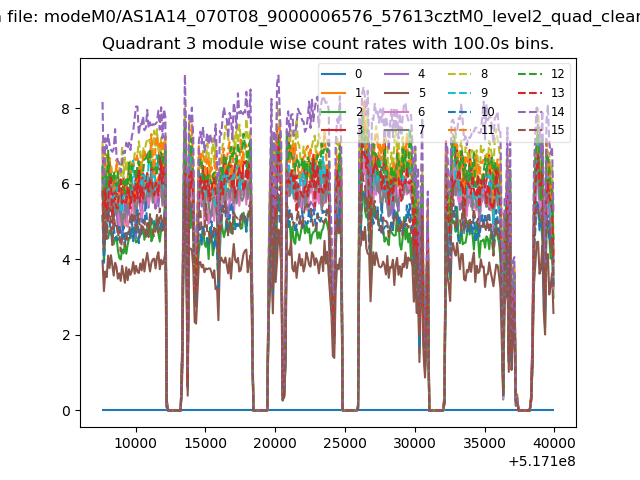
| Module-wise count rates for Quadrant C Data is divided into 100 sec bins |
 |
 |
| Module-wise count rates for Quadrant D Data is divided into 100 sec bins |
 |
 |
| Parameter | Plot |
|---|---|
| CZT HV Monitor | 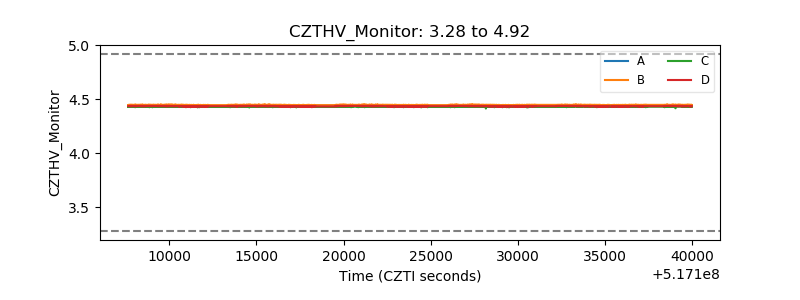 |
| D_VDD | 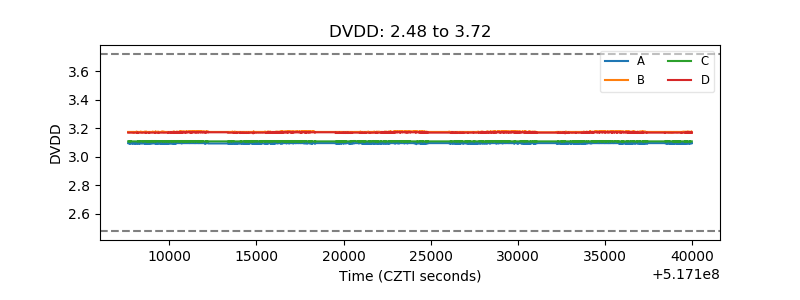 |
| Temperature 1 | 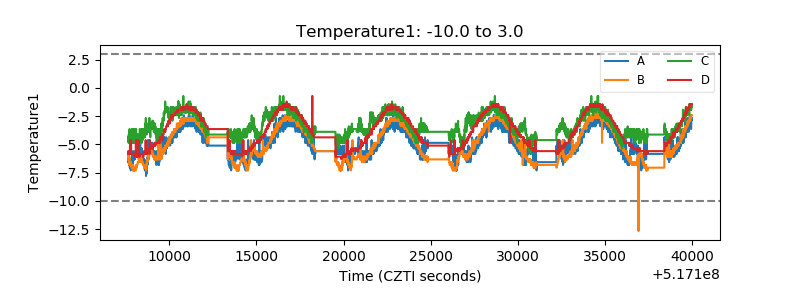 |
| Veto HV Monitor | 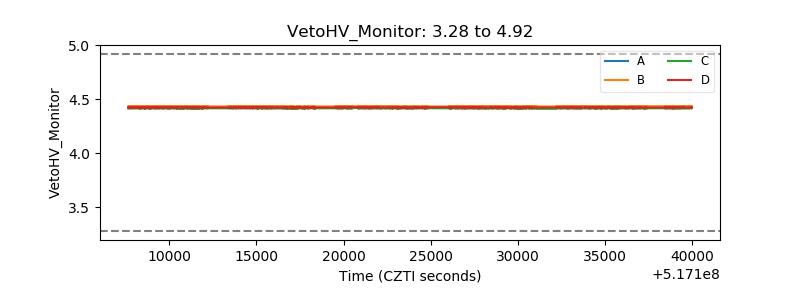 |
| Veto LLD | 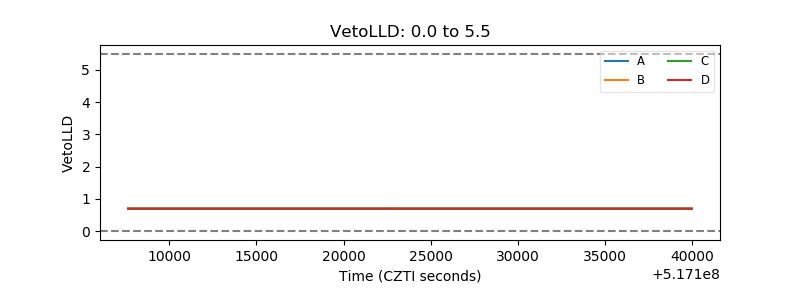 |
| Alpha Counter | 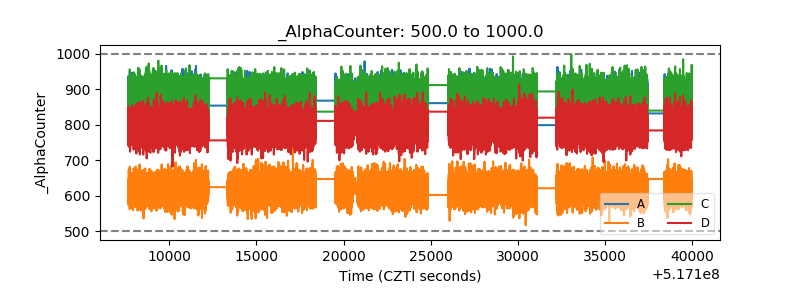 |
| _CPM_Rate | 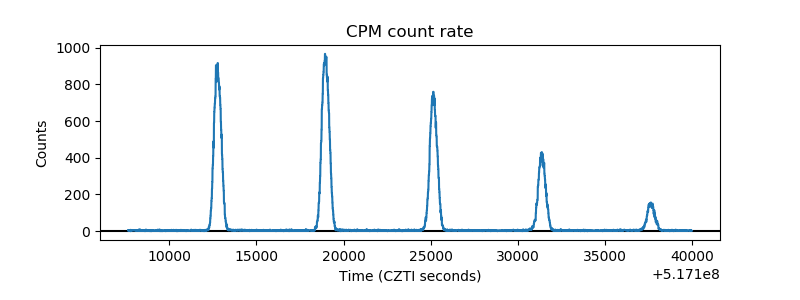 |
| CZT Counter | 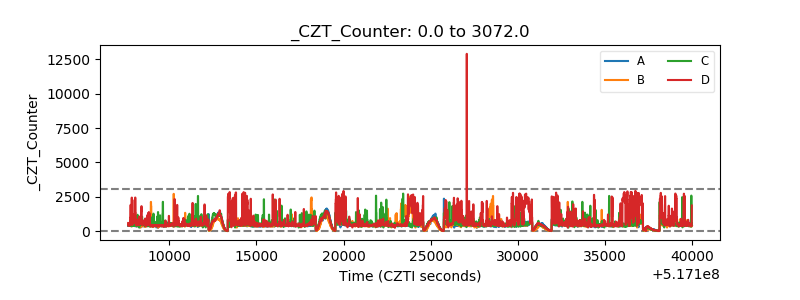 |
| +2.5 Volts monitor | 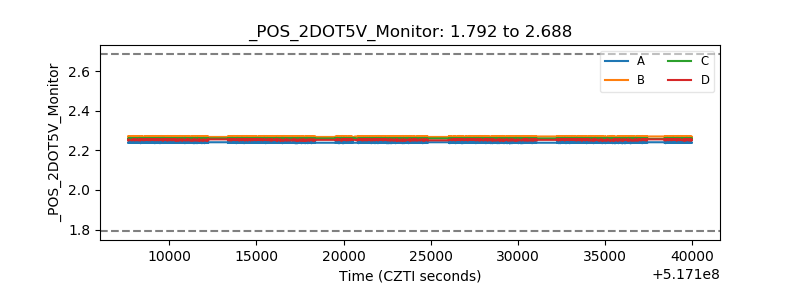 |
| +5 Volts monitor | 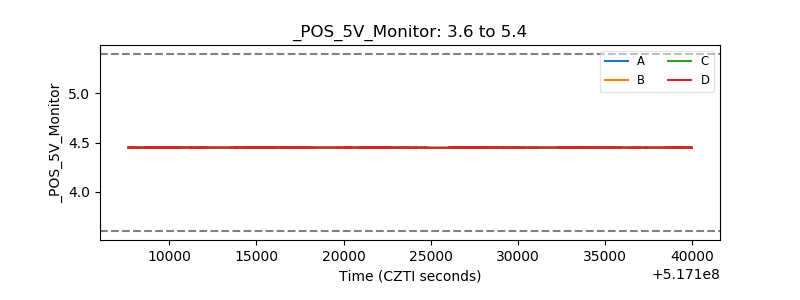 |
| _ROLL_ROT | 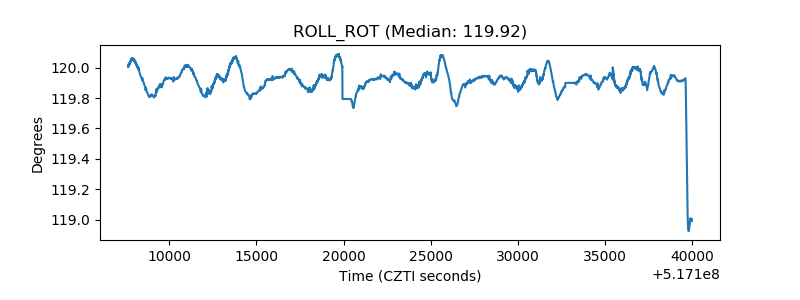 |
| _Roll_DEC | 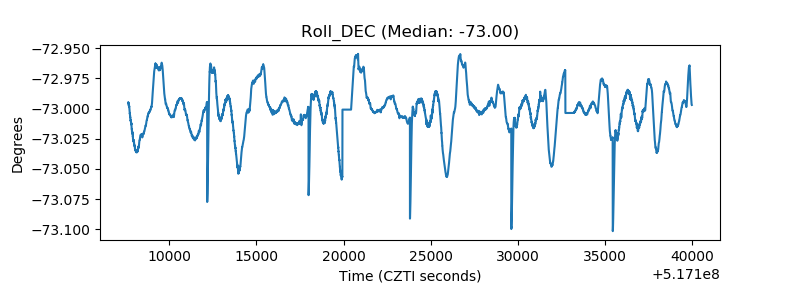 |
| _Roll_RA | 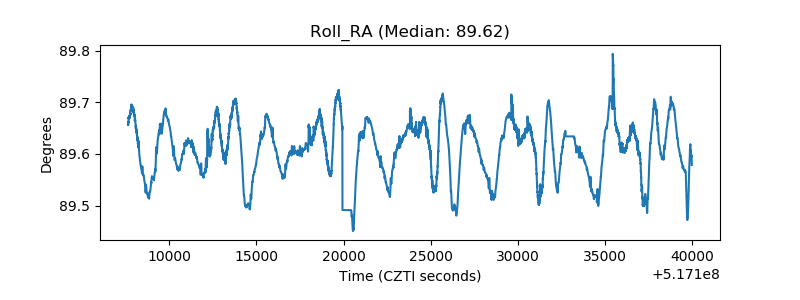 |
| Veto Counter | 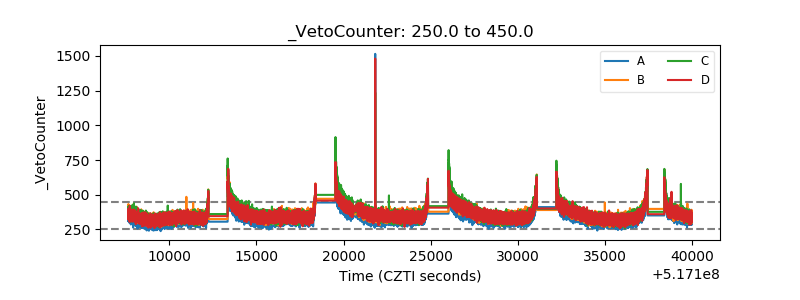 |