| Param | Original file | Final file |
|---|---|---|
| Filename | modeM0/AS1A14_070T08_9000006576_57614cztM0_level2.fits | modeM0/AS1A14_070T08_9000006576_57614cztM0_level2_quad_clean.evt |
| Size (bytes) | 408,055,680 | 102,386,880 |
| Size | 389.2 MB | 97.6 MB |
| Events in quadrant A | 3,273,326 | 665,522 |
| Events in quadrant B | 3,331,849 | 715,030 |
| Events in quadrant C | 4,057,905 | 639,934 |
| Events in quadrant D | 3,899,021 | 594,068 |
| Mode M0 | |||
|---|---|---|---|
| Quadrant | BADHDUFLAG | Total packets | Discarded packets |
| A | 0 | 14541 | 1 |
| B | 0 | 14989 | 1 |
| C | 0 | 16959 | 1 |
| D | 0 | 16582 | 2 |
| Mode M9 | |||
|---|---|---|---|
| Quadrant | BADHDUFLAG | Total packets | Discarded packets |
| A | 0 | 6 | 0 |
| B | 0 | 6 | 0 |
| C | 0 | 6 | 0 |
| D | 0 | 6 | 0 |
| Mode SS | |||
|---|---|---|---|
| Quadrant | BADHDUFLAG | Total packets | Discarded packets |
| A | 0 | 142 | 0 |
| B | 0 | 142 | 0 |
| C | 0 | 142 | 0 |
| D | 0 | 142 | 0 |
| Quadrant | Total seconds | Saturated seconds | Saturation percentage |
|---|---|---|---|
| A | 6972 | 112 | 1.606426% |
| B | 6972 | 139 | 1.993689% |
| C | 6972 | 168 | 2.409639% |
| D | 6972 | 245 | 3.514056% |
Noise dominated data is calculated using 1-second bins in cleaned event files. If a bin has >2000 counts, and if more than 50% of those come from <1% of pixels, then it is considered to be noise-dominated and hence unusable.
| Quadrant | # 1 sec bins | Bins with >0 counts | Bins with >2000 counts | High rate bins dominated by noise | Noise dominated (total time) | Noise dominated (detector-on time) | Marked lightcurve |
|---|---|---|---|---|---|---|---|
| A | 7612 | 6973 | 8 | 8 | 0.11% | 0.11% | 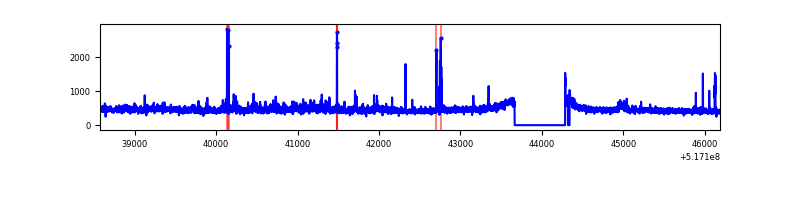 |
| B | 7612 | 6973 | 34 | 34 | 0.45% | 0.49% | 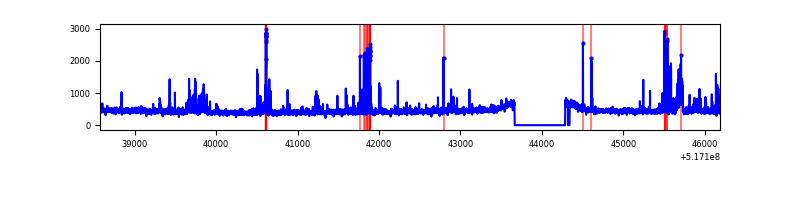 |
| C | 7612 | 6974 | 82 | 82 | 1.08% | 1.18% | 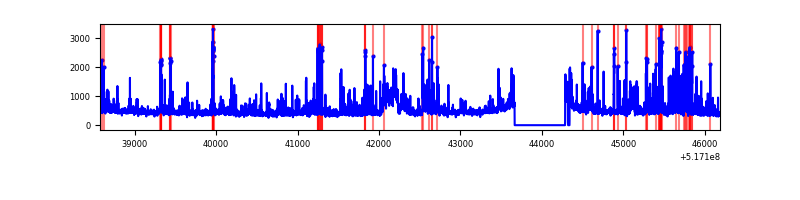 |
| D | 7612 | 6974 | 164 | 164 | 2.15% | 2.35% | 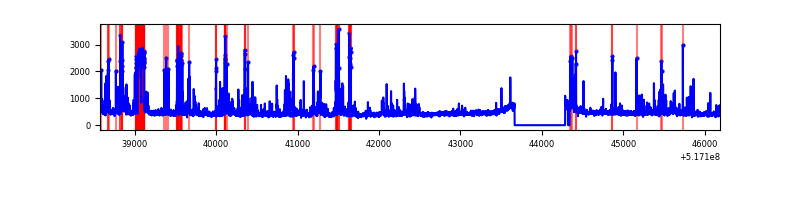 |
Top three noisy pixels from each quadrant. If the there are fewer than three noisy pixels in the level2.evt file, extra rows are filled as -1
| Pixel properties | Quadrant properties | ||||||
|---|---|---|---|---|---|---|---|
| Quadrant | DetID | PixID | Counts | Sigma | Mean | Median | Sigma |
| A | 3 | 14 | 268764 | 1438.45 | 753 | 732 | 186.3 |
| A | 4 | 13 | 27086 | 141.43 | 753 | 732 | 186.3 |
| A | 7 | 160 | 24348 | 126.74 | 753 | 732 | 186.3 |
| B | 10 | 247 | 139121 | 881.17 | 740 | 712 | 157.1 |
| B | 7 | 252 | 56709 | 356.5 | 740 | 712 | 157.1 |
| B | 5 | 185 | 52648 | 330.65 | 740 | 712 | 157.1 |
| C | 15 | 224 | 658062 | 3299.18 | 727 | 720 | 199.2 |
| C | 9 | 38 | 319055 | 1597.71 | 727 | 720 | 199.2 |
| C | 10 | 21 | 84145 | 418.71 | 727 | 720 | 199.2 |
| D | 15 | 142 | 515093 | 2517.75 | 724 | 690 | 204.3 |
| D | 7 | 96 | 158189 | 770.88 | 724 | 690 | 204.3 |
| D | 2 | 249 | 64331 | 311.49 | 724 | 690 | 204.3 |
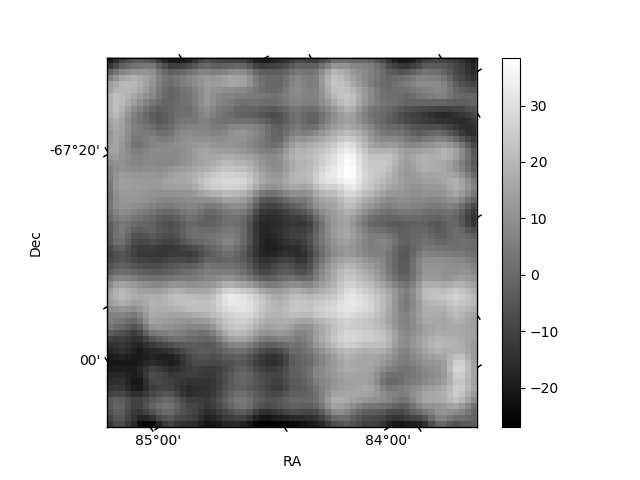
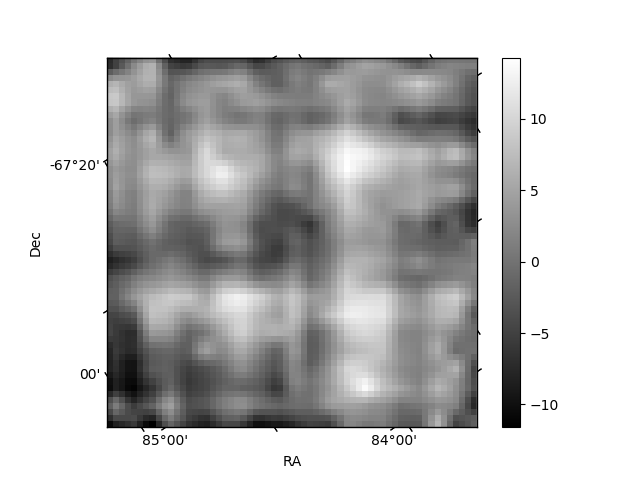
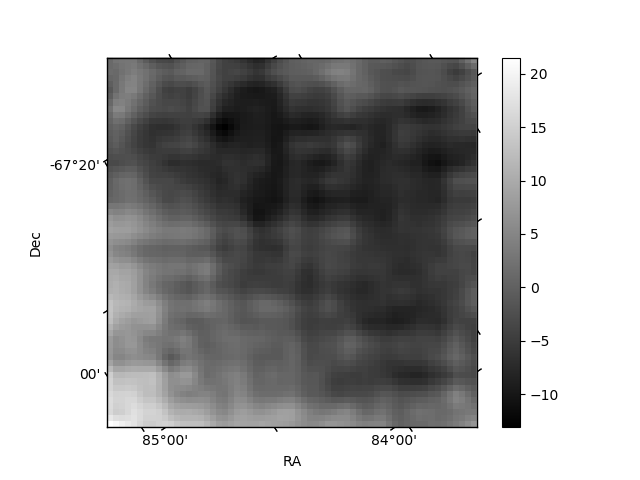
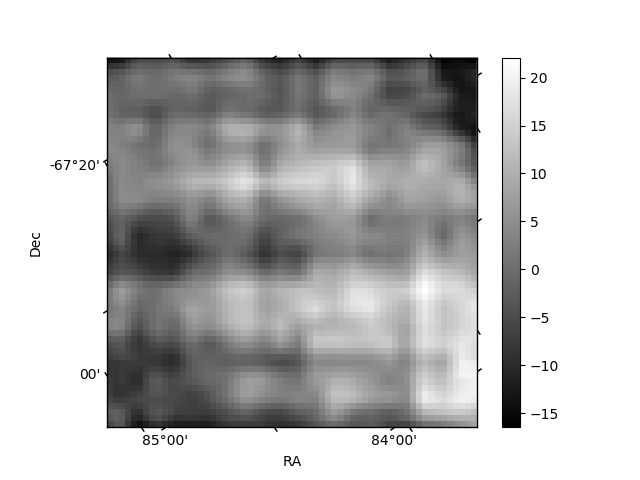
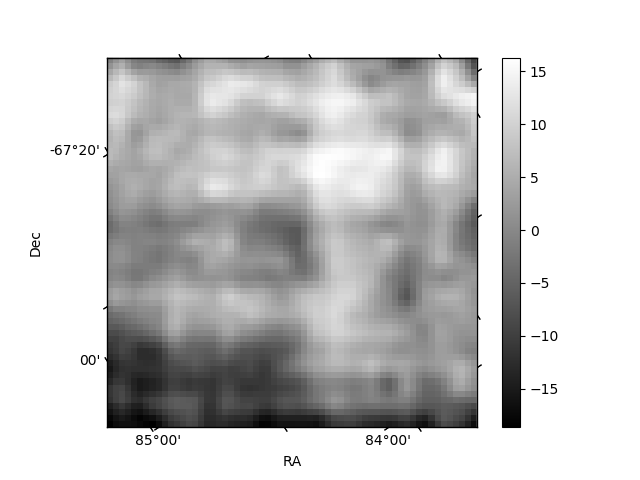
Histogram calculated using DETX and DETY for each event in the final _common_clean file
| Quadrant A | 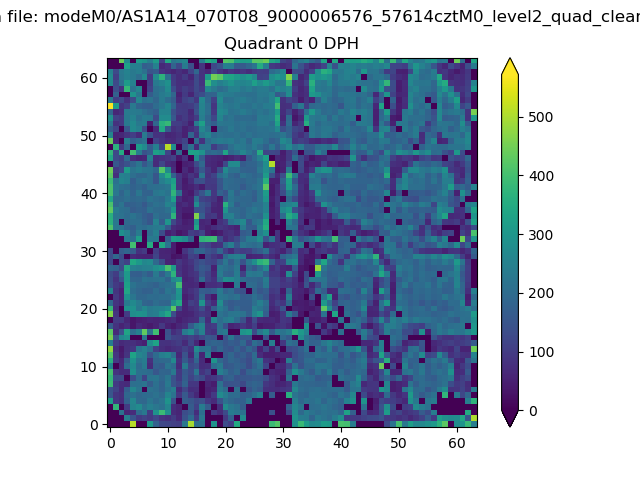 |
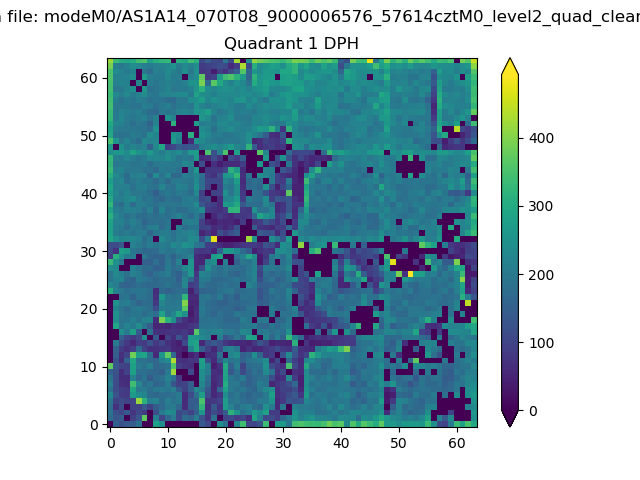 |
Quadrant B |
|---|---|---|---|
| Quadrant D | 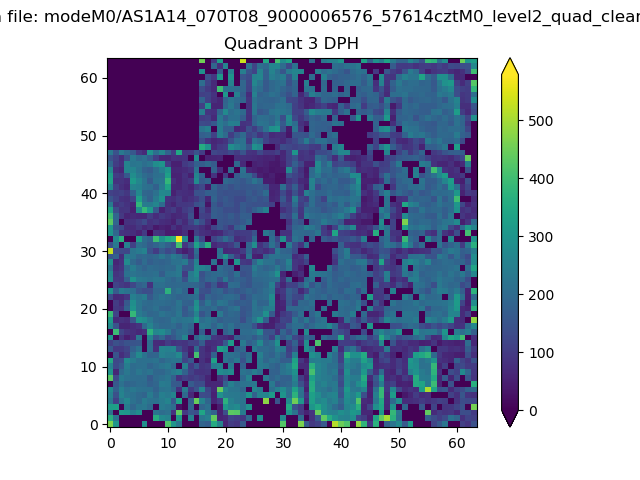 |
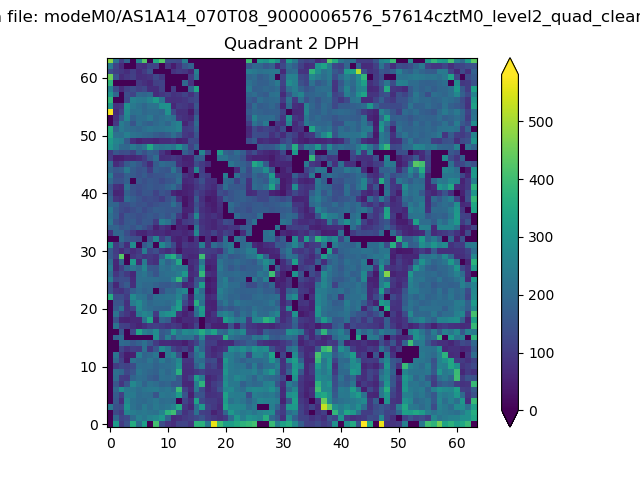 |
Quadrant C |
| Plot type | Count rate plots | Images |
|---|---|---|
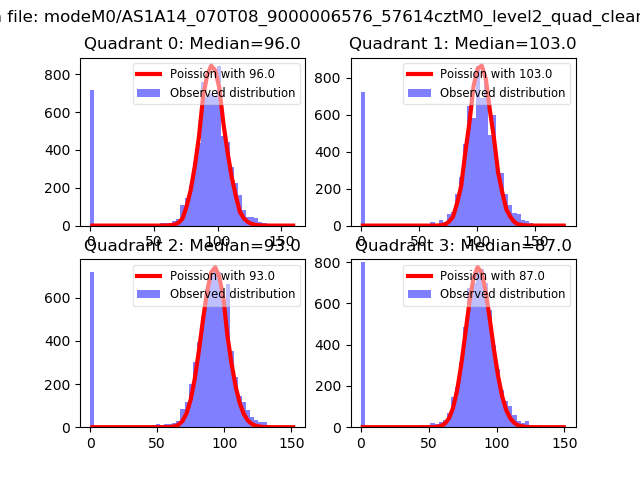
| Comparison with Poisson distribution Blue bars denote a histogram of data divided into 1 sec bins. Red curve is a Poisson curve with rate = median count rate of data. |
 |
 |
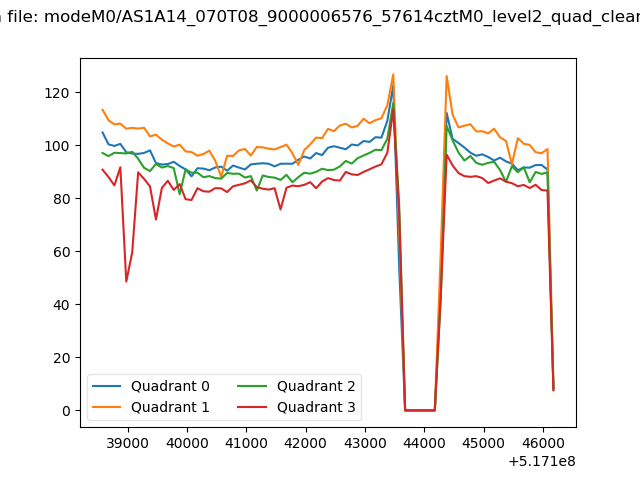
| Quadrant-wise count rates Data is divided into 100 sec bins |
 |
|
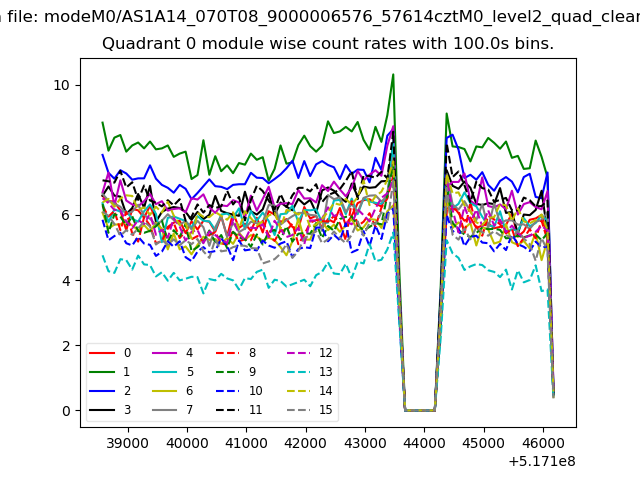
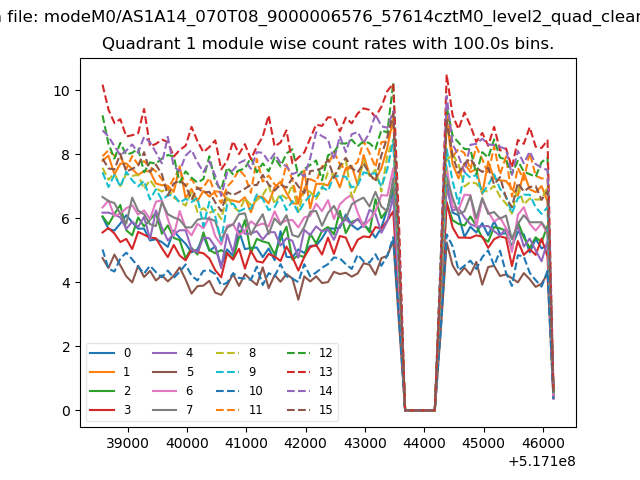
| Module-wise count rates for Quadrant A Data is divided into 100 sec bins |
 |
 |
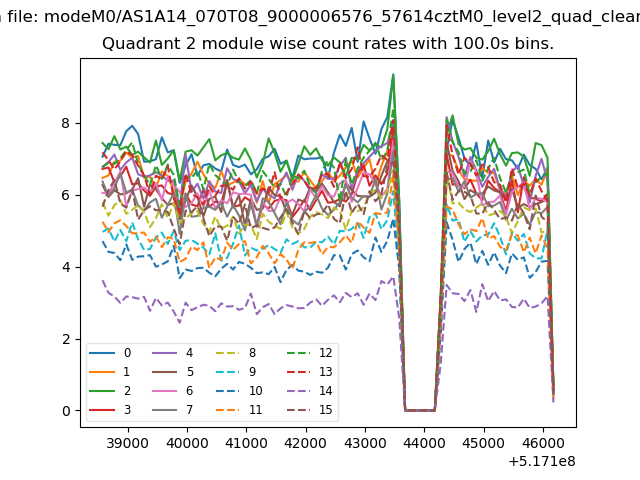
| Module-wise count rates for Quadrant B Data is divided into 100 sec bins |
 |
 |
| Module-wise count rates for Quadrant C Data is divided into 100 sec bins |
 |
 |
| Module-wise count rates for Quadrant D Data is divided into 100 sec bins |
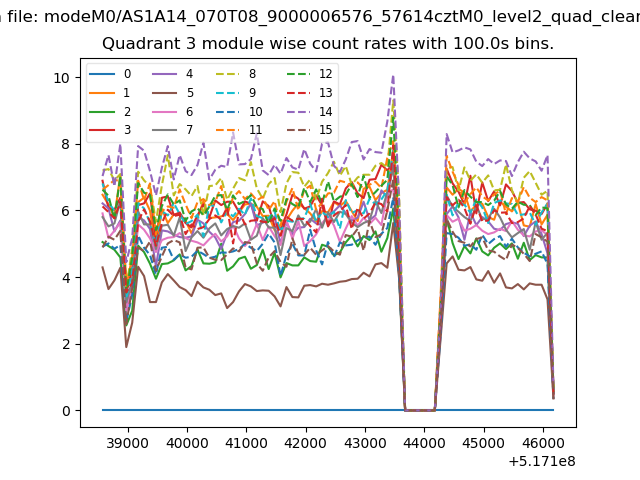 |
 |
| Parameter | Plot |
|---|---|
| CZT HV Monitor |  |
| D_VDD | 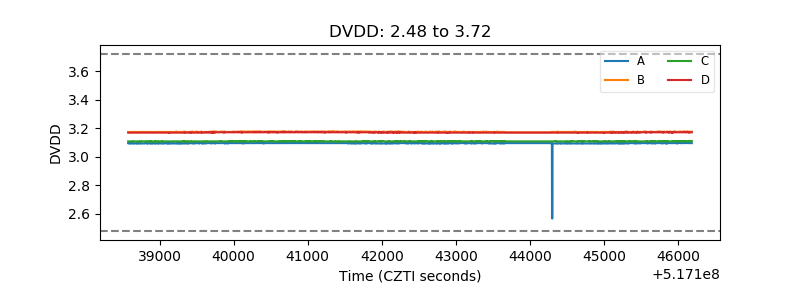 |
| Temperature 1 | 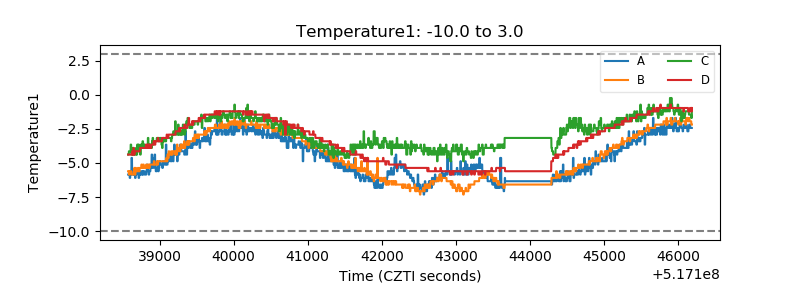 |
| Veto HV Monitor | 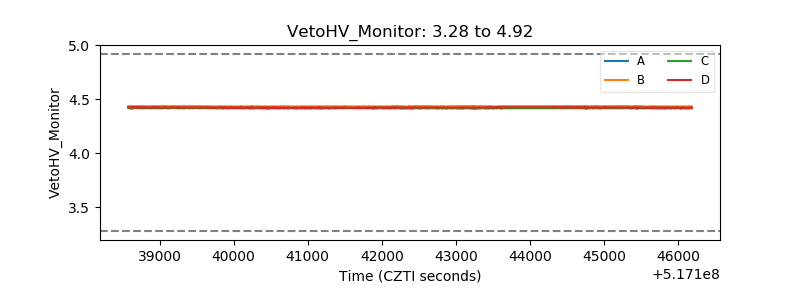 |
| Veto LLD | 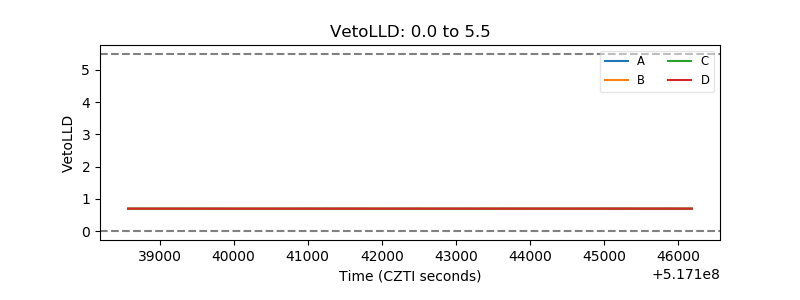 |
| Alpha Counter | 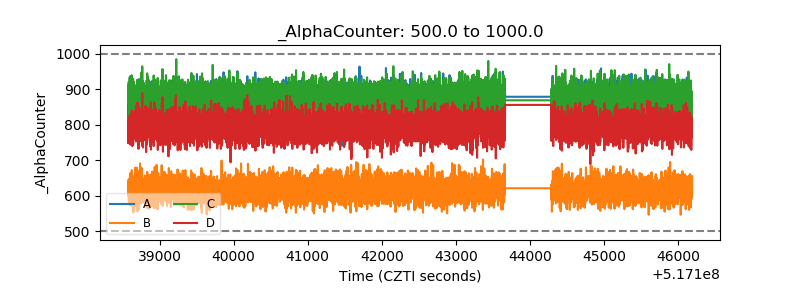 |
| _CPM_Rate | 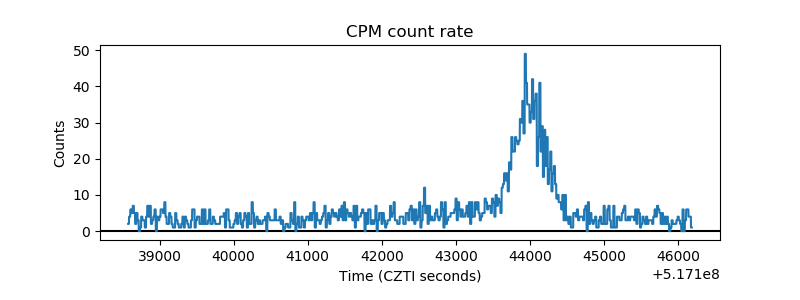 |
| CZT Counter | 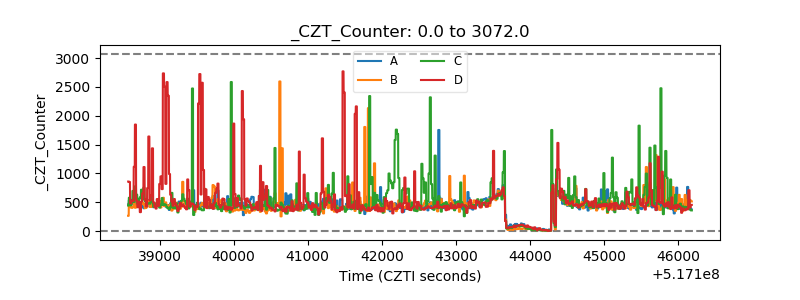 |
| +2.5 Volts monitor | 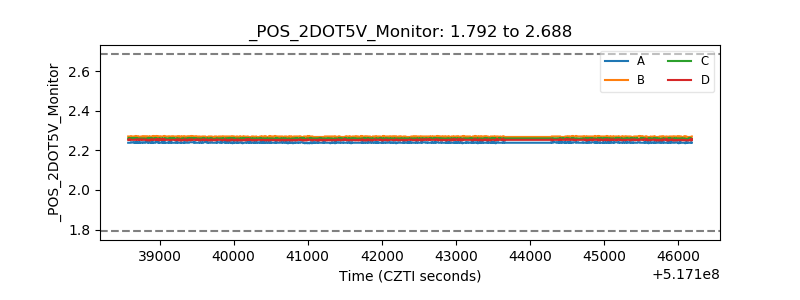 |
| +5 Volts monitor | 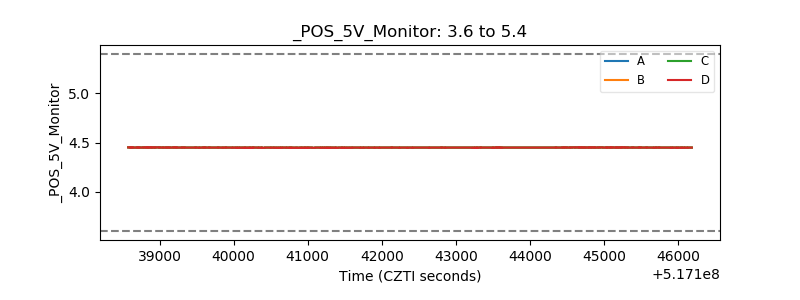 |
| _ROLL_ROT | 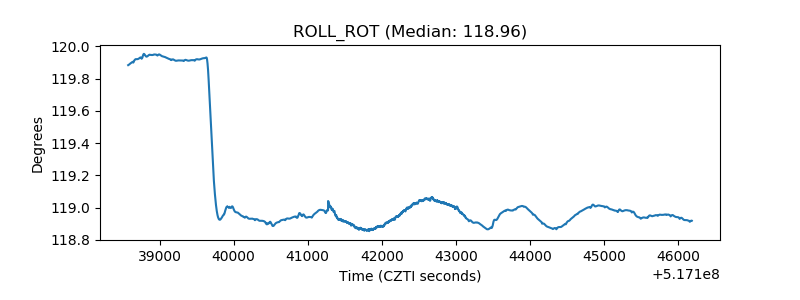 |
| _Roll_DEC | 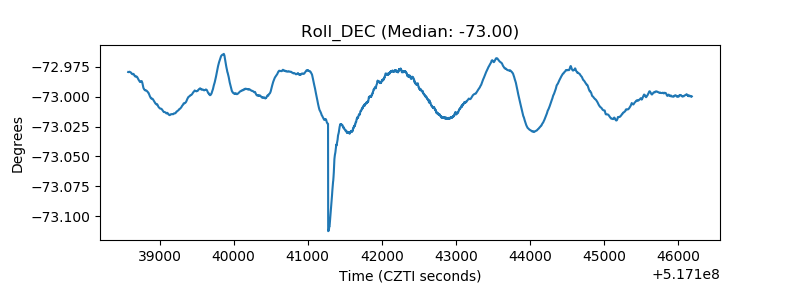 |
| _Roll_RA | 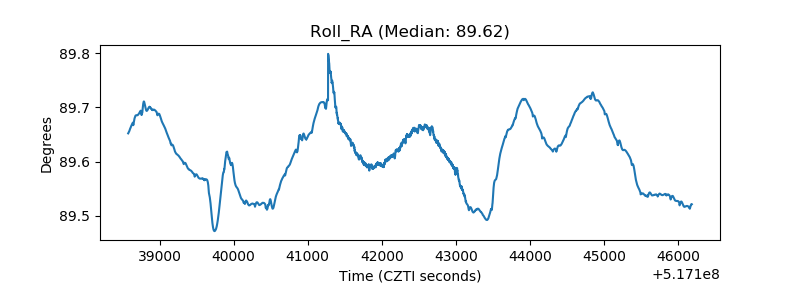 |
| Veto Counter | 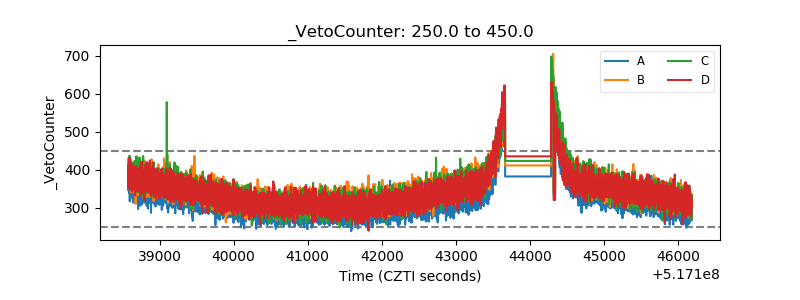 |