| Param | Original file | Final file |
|---|---|---|
| Filename | modeM0/AS1A14_070T08_9000006576_57615cztM0_level2.fits | modeM0/AS1A14_070T08_9000006576_57615cztM0_level2_quad_clean.evt |
| Size (bytes) | 484,810,560 | 107,300,160 |
| Size | 462.4 MB | 102.3 MB |
| Events in quadrant A | 3,294,442 | 709,320 |
| Events in quadrant B | 3,759,839 | 755,771 |
| Events in quadrant C | 5,983,103 | 651,724 |
| Events in quadrant D | 4,334,492 | 618,019 |
| Mode M0 | |||
|---|---|---|---|
| Quadrant | BADHDUFLAG | Total packets | Discarded packets |
| A | 0 | 15314 | 0 |
| B | 0 | 16388 | 0 |
| C | 0 | 23037 | 0 |
| D | 0 | 18049 | 0 |
| Mode SS | |||
|---|---|---|---|
| Quadrant | BADHDUFLAG | Total packets | Discarded packets |
| A | 0 | 148 | 0 |
| B | 0 | 148 | 0 |
| C | 0 | 148 | 0 |
| D | 0 | 148 | 0 |
| Quadrant | Total seconds | Saturated seconds | Saturation percentage |
|---|---|---|---|
| A | 7387 | 71 | 0.961148% |
| B | 7388 | 190 | 2.571738% |
| C | 7388 | 552 | 7.471576% |
| D | 7388 | 338 | 4.574986% |
Noise dominated data is calculated using 1-second bins in cleaned event files. If a bin has >2000 counts, and if more than 50% of those come from <1% of pixels, then it is considered to be noise-dominated and hence unusable.
| Quadrant | # 1 sec bins | Bins with >0 counts | Bins with >2000 counts | High rate bins dominated by noise | Noise dominated (total time) | Noise dominated (detector-on time) | Marked lightcurve |
|---|---|---|---|---|---|---|---|
| A | 7387 | 7387 | 3 | 3 | 0.04% | 0.04% | 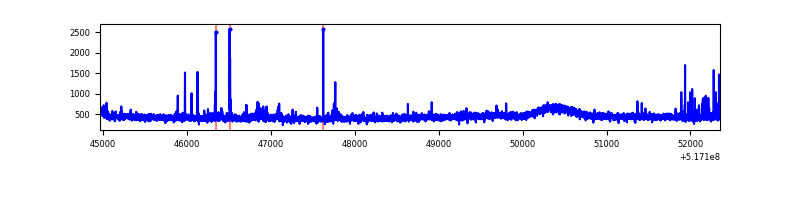 |
| B | 7388 | 7388 | 17 | 17 | 0.23% | 0.23% | 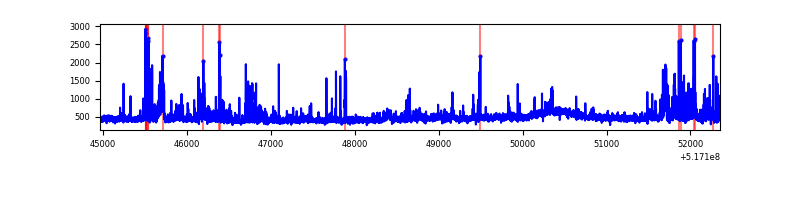 |
| C | 7388 | 7388 | 446 | 446 | 6.04% | 6.04% | 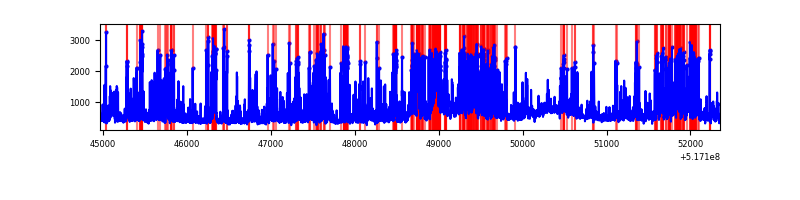 |
| D | 7388 | 7388 | 227 | 227 | 3.07% | 3.07% | 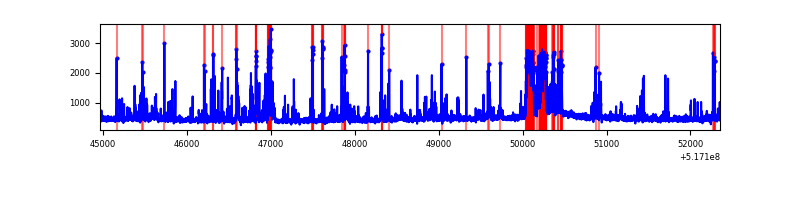 |
Top three noisy pixels from each quadrant. If the there are fewer than three noisy pixels in the level2.evt file, extra rows are filled as -1
| Pixel properties | Quadrant properties | ||||||
|---|---|---|---|---|---|---|---|
| Quadrant | DetID | PixID | Counts | Sigma | Mean | Median | Sigma |
| A | 3 | 14 | 62361 | 312.21 | 805 | 782 | 197.2 |
| A | 7 | 160 | 42383 | 210.92 | 805 | 782 | 197.2 |
| A | 10 | 251 | 23801 | 116.71 | 805 | 782 | 197.2 |
| B | 10 | 247 | 199606 | 1182.7 | 791 | 760 | 168.1 |
| B | 0 | 245 | 97111 | 573.08 | 791 | 760 | 168.1 |
| B | 5 | 185 | 91180 | 537.8 | 791 | 760 | 168.1 |
| C | 15 | 224 | 2358165 | 11364.53 | 763 | 753 | 207.4 |
| C | 9 | 38 | 352391 | 1695.16 | 763 | 753 | 207.4 |
| C | 12 | 2 | 91099 | 435.54 | 763 | 753 | 207.4 |
| D | 15 | 142 | 547422 | 2532.37 | 765 | 731 | 215.9 |
| D | 2 | 249 | 148009 | 682.22 | 765 | 731 | 215.9 |
| D | 15 | 125 | 97630 | 448.85 | 765 | 731 | 215.9 |
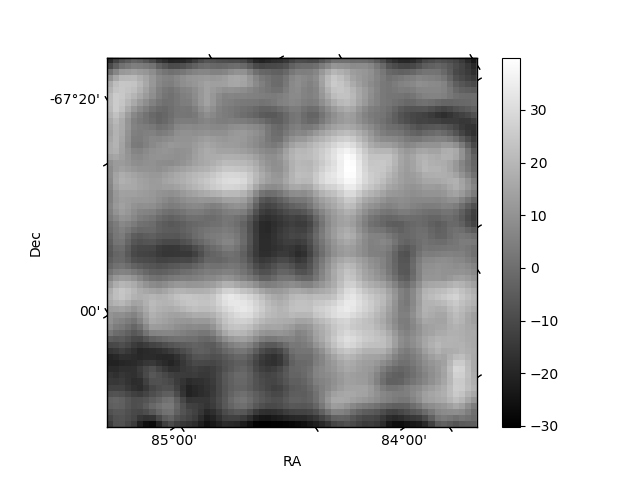
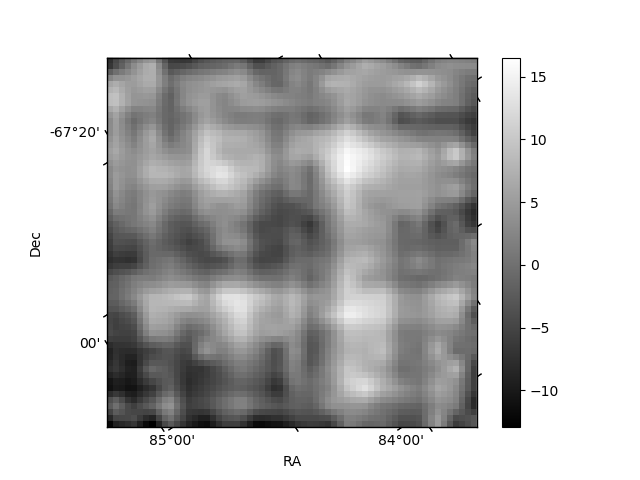
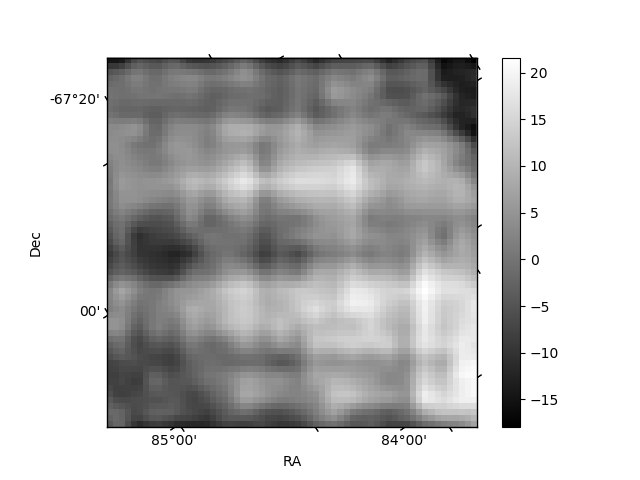
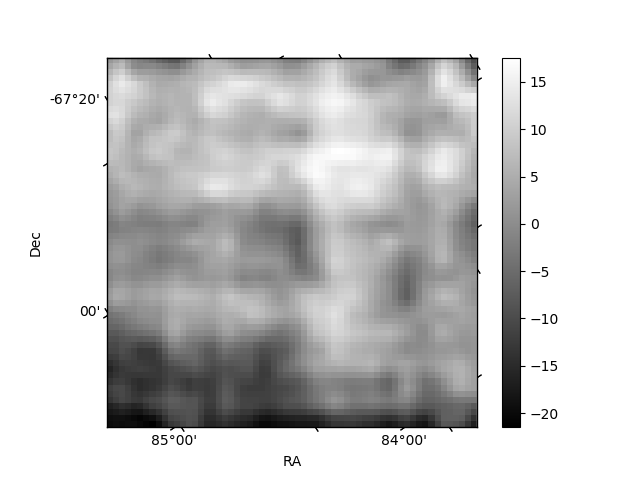
Histogram calculated using DETX and DETY for each event in the final _common_clean file
| Quadrant A | 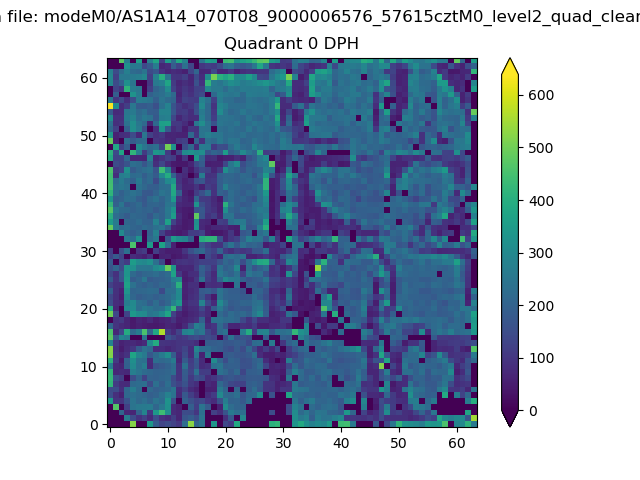 |
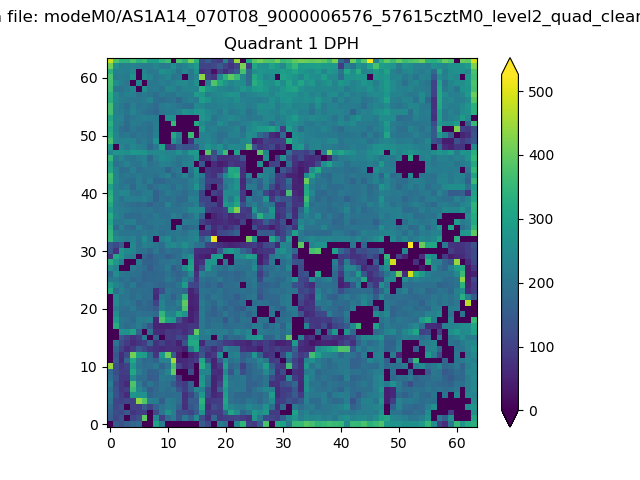 |
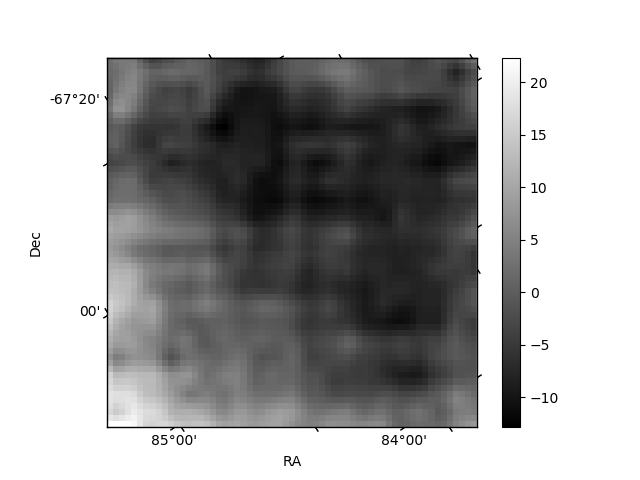
Quadrant B |
|---|---|---|---|
| Quadrant D | 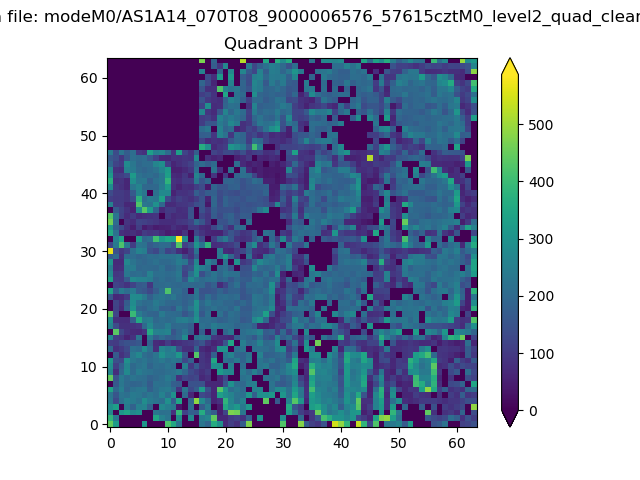 |
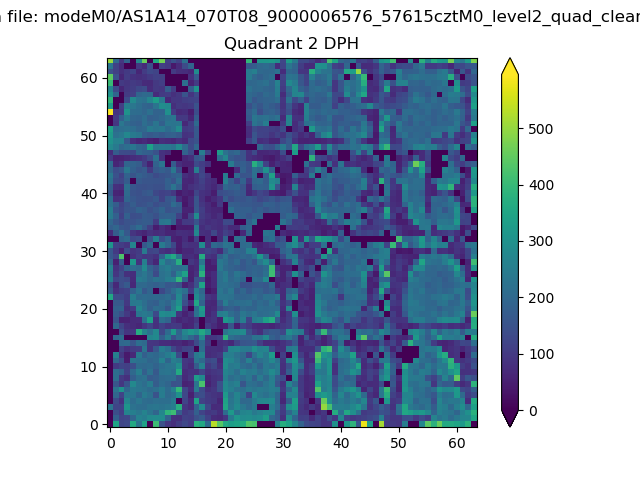 |
Quadrant C |
| Plot type | Count rate plots | Images |
|---|---|---|
| Comparison with Poisson distribution Blue bars denote a histogram of data divided into 1 sec bins. Red curve is a Poisson curve with rate = median count rate of data. |
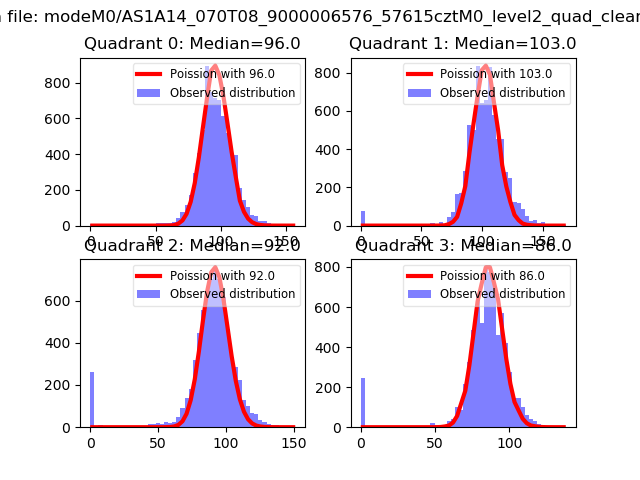 |
 |
| Quadrant-wise count rates Data is divided into 100 sec bins |
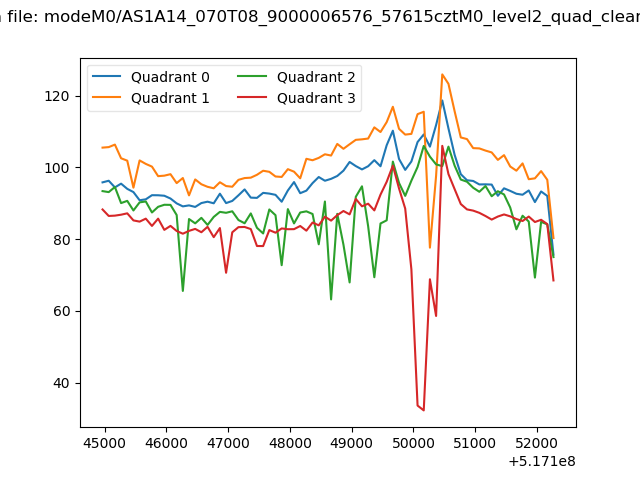 |
|
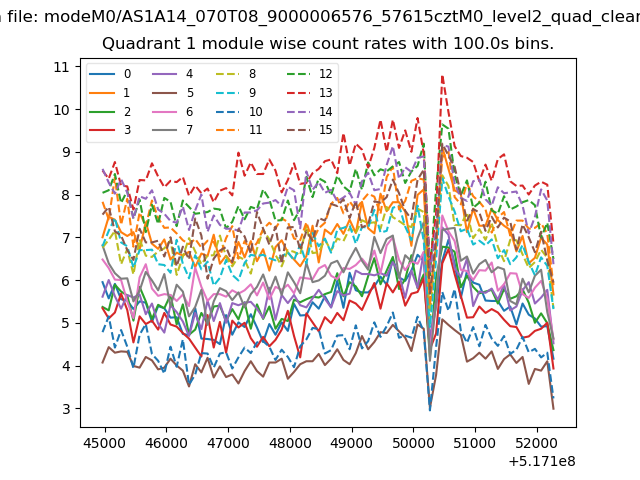
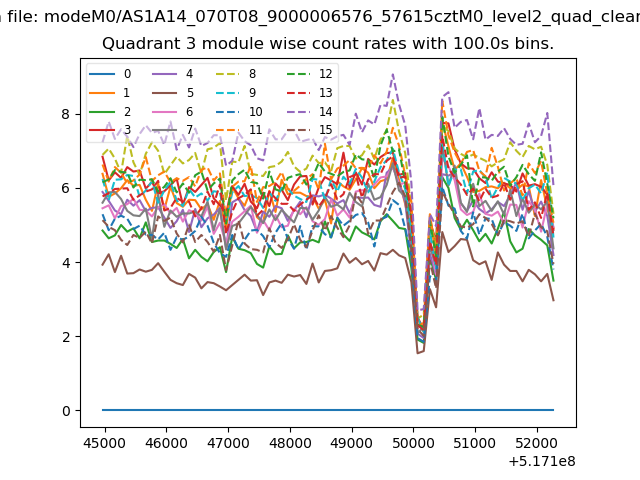
| Module-wise count rates for Quadrant A Data is divided into 100 sec bins |
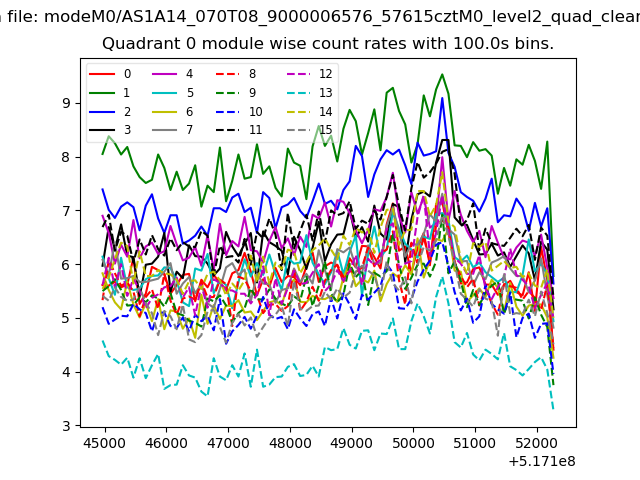 |
 |
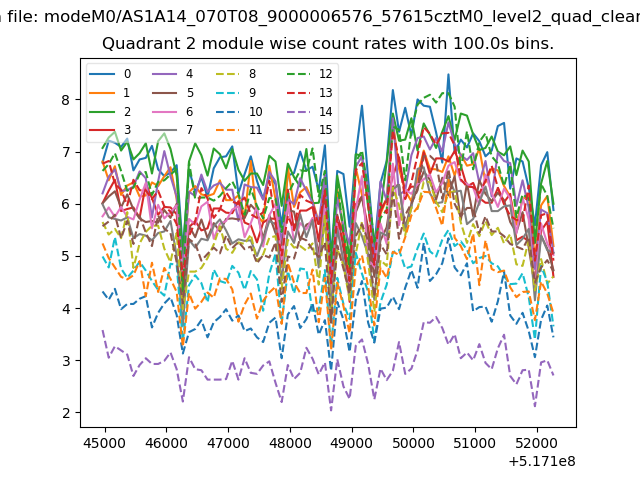
| Module-wise count rates for Quadrant B Data is divided into 100 sec bins |
 |
 |
| Module-wise count rates for Quadrant C Data is divided into 100 sec bins |
 |
 |
| Module-wise count rates for Quadrant D Data is divided into 100 sec bins |
 |
 |
| Parameter | Plot |
|---|---|
| CZT HV Monitor |  |
| D_VDD | 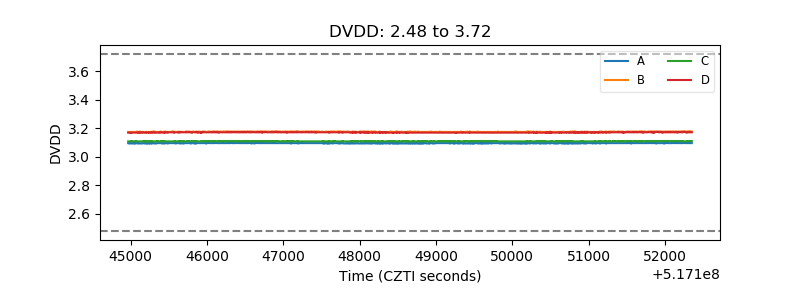 |
| Temperature 1 | 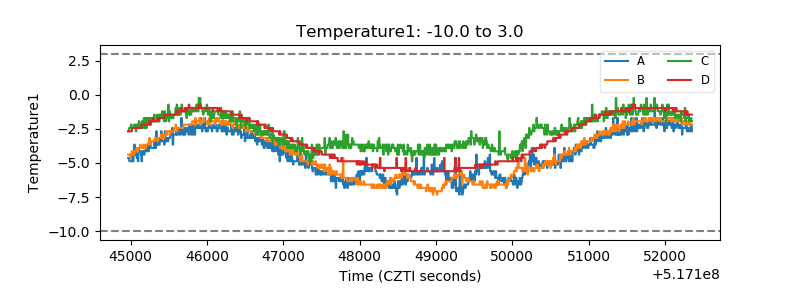 |
| Veto HV Monitor | 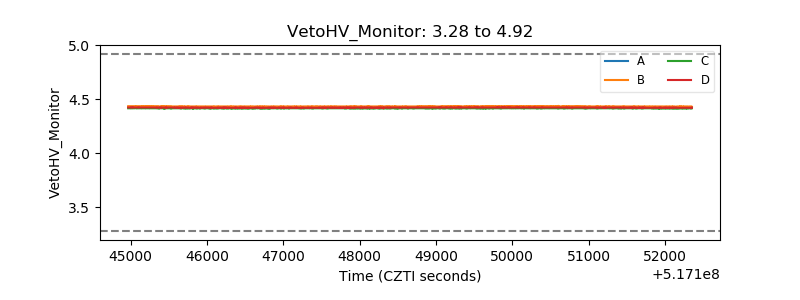 |
| Veto LLD | 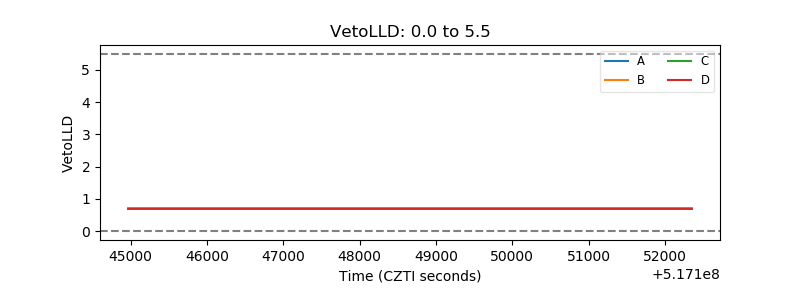 |
| Alpha Counter | 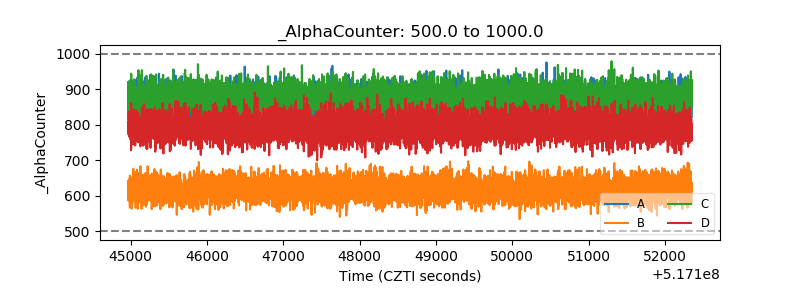 |
| _CPM_Rate | 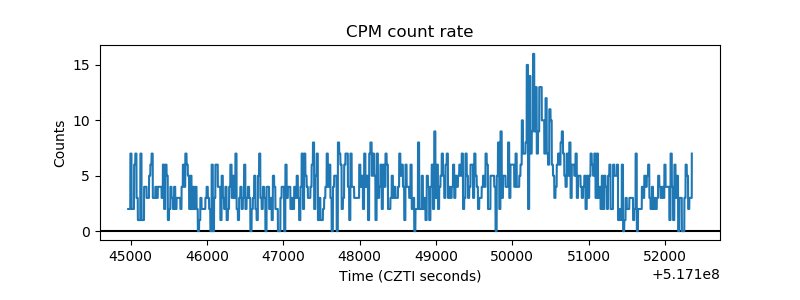 |
| CZT Counter | 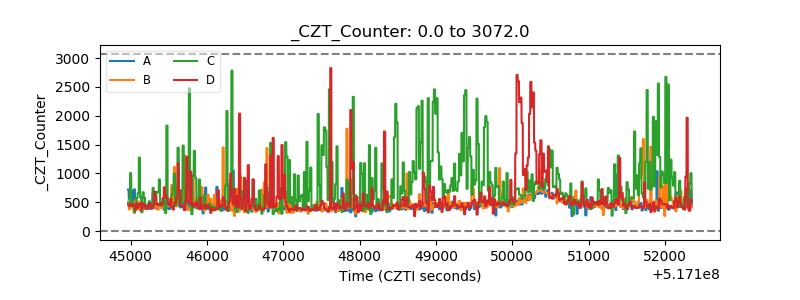 |
| +2.5 Volts monitor |  |
| +5 Volts monitor | 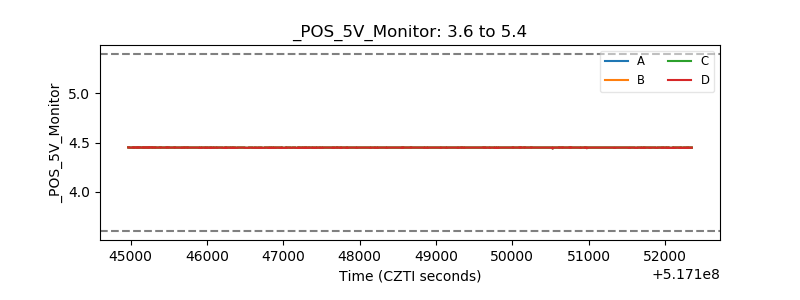 |
| _ROLL_ROT | 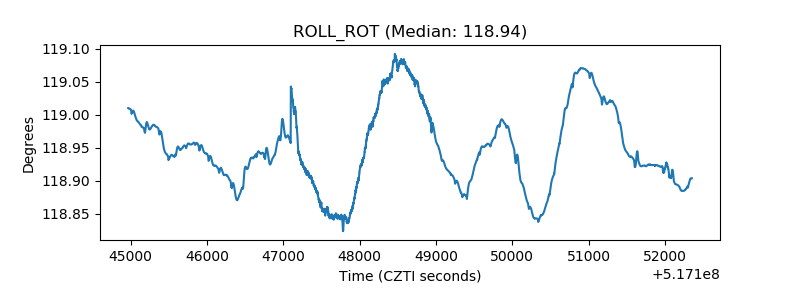 |
| _Roll_DEC | 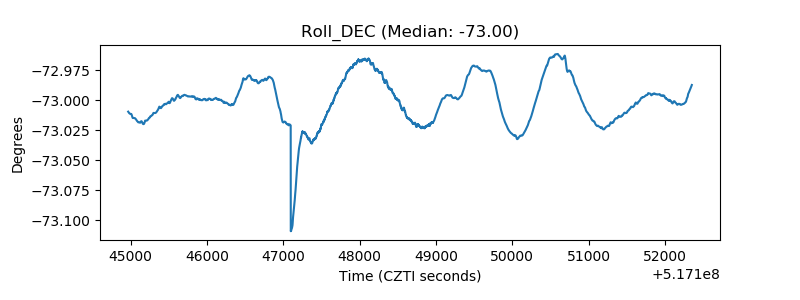 |
| _Roll_RA | 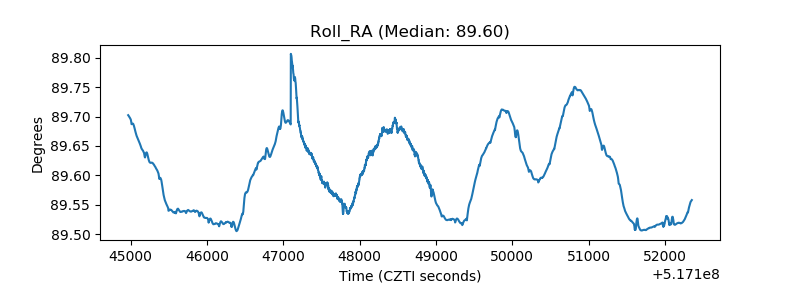 |
| Veto Counter | 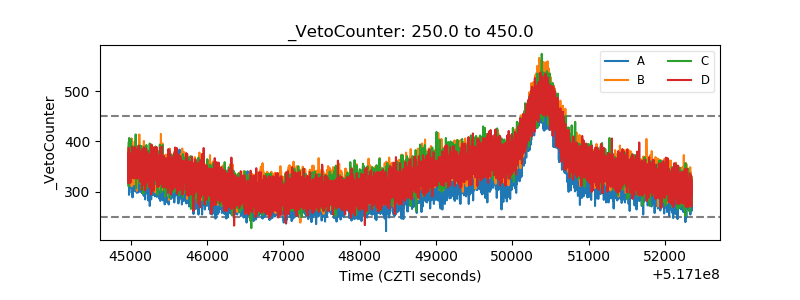 |