| Param | Original file | Final file |
|---|---|---|
| Filename | modeM0/AS1A14_070T08_9000006576_57617cztM0_level2.fits | modeM0/AS1A14_070T08_9000006576_57617cztM0_level2_quad_clean.evt |
| Size (bytes) | 473,264,640 | 107,688,960 |
| Size | 451.3 MB | 102.7 MB |
| Events in quadrant A | 3,489,286 | 705,850 |
| Events in quadrant B | 3,628,587 | 760,378 |
| Events in quadrant C | 5,444,936 | 657,426 |
| Events in quadrant D | 4,376,100 | 618,165 |
| Mode M0 | |||
|---|---|---|---|
| Quadrant | BADHDUFLAG | Total packets | Discarded packets |
| A | 0 | 15998 | 0 |
| B | 0 | 16049 | 0 |
| C | 0 | 21485 | 5 |
| D | 0 | 18475 | 0 |
| Mode SS | |||
|---|---|---|---|
| Quadrant | BADHDUFLAG | Total packets | Discarded packets |
| A | 0 | 148 | 0 |
| B | 0 | 148 | 0 |
| C | 0 | 148 | 0 |
| D | 0 | 148 | 0 |
| Quadrant | Total seconds | Saturated seconds | Saturation percentage |
|---|---|---|---|
| A | 7458 | 86 | 1.153124% |
| B | 7458 | 48 | 0.643604% |
| C | 7457 | 400 | 5.364087% |
| D | 7457 | 318 | 4.264450% |
Noise dominated data is calculated using 1-second bins in cleaned event files. If a bin has >2000 counts, and if more than 50% of those come from <1% of pixels, then it is considered to be noise-dominated and hence unusable.
| Quadrant | # 1 sec bins | Bins with >0 counts | Bins with >2000 counts | High rate bins dominated by noise | Noise dominated (total time) | Noise dominated (detector-on time) | Marked lightcurve |
|---|---|---|---|---|---|---|---|
| A | 7458 | 7458 | 75 | 75 | 1.01% | 1.01% | 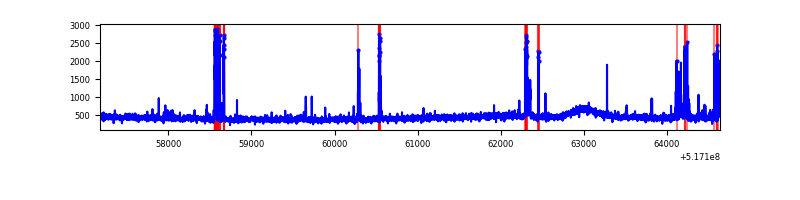 |
| B | 7458 | 7458 | 11 | 11 | 0.15% | 0.15% | 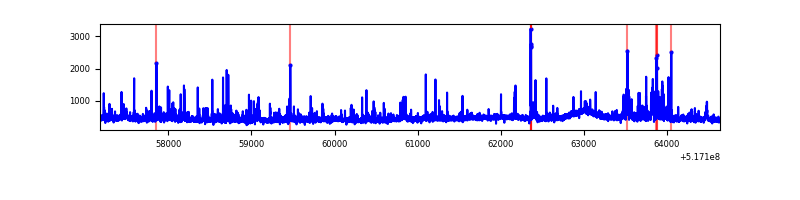 |
| C | 7456 | 7456 | 337 | 337 | 4.52% | 4.52% | 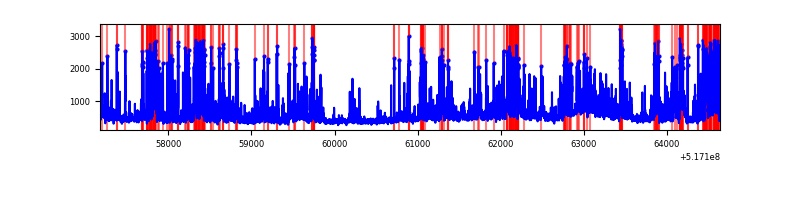 |
| D | 7457 | 7457 | 306 | 306 | 4.10% | 4.10% | 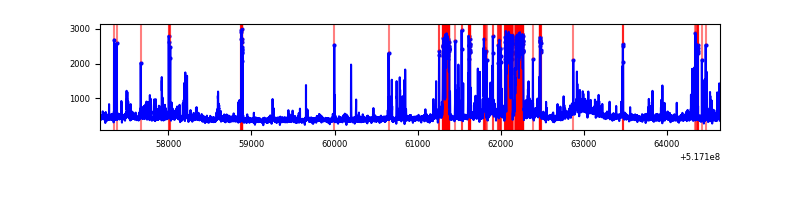 |
Top three noisy pixels from each quadrant. If the there are fewer than three noisy pixels in the level2.evt file, extra rows are filled as -1
| Pixel properties | Quadrant properties | ||||||
|---|---|---|---|---|---|---|---|
| Quadrant | DetID | PixID | Counts | Sigma | Mean | Median | Sigma |
| A | 7 | 160 | 196976 | 983.51 | 807 | 785 | 199.5 |
| A | 3 | 245 | 121430 | 604.8 | 807 | 785 | 199.5 |
| A | 3 | 128 | 19508 | 93.86 | 807 | 785 | 199.5 |
| B | 10 | 247 | 134393 | 779.48 | 798 | 769 | 171.4 |
| B | 0 | 245 | 64775 | 373.37 | 798 | 769 | 171.4 |
| B | 4 | 80 | 50067 | 287.57 | 798 | 769 | 171.4 |
| C | 15 | 224 | 1357481 | 6531.41 | 767 | 757 | 207.7 |
| C | 9 | 38 | 427621 | 2054.97 | 767 | 757 | 207.7 |
| C | 12 | 2 | 181779 | 871.46 | 767 | 757 | 207.7 |
| D | 15 | 142 | 880375 | 4056.49 | 765 | 730 | 216.8 |
| D | 6 | 159 | 90133 | 412.28 | 765 | 730 | 216.8 |
| D | 3 | 224 | 72727 | 332.01 | 765 | 730 | 216.8 |
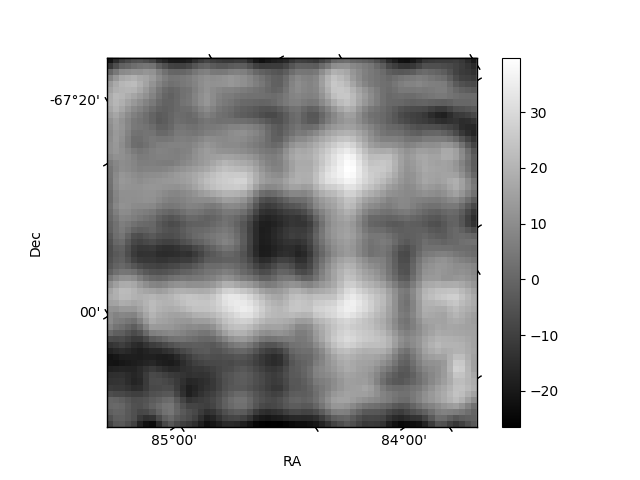
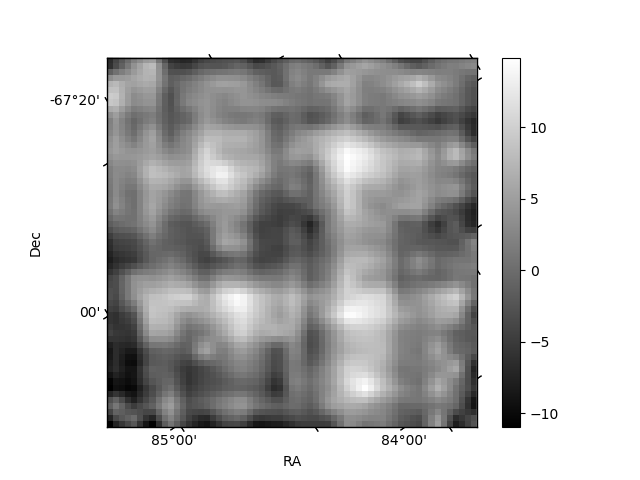
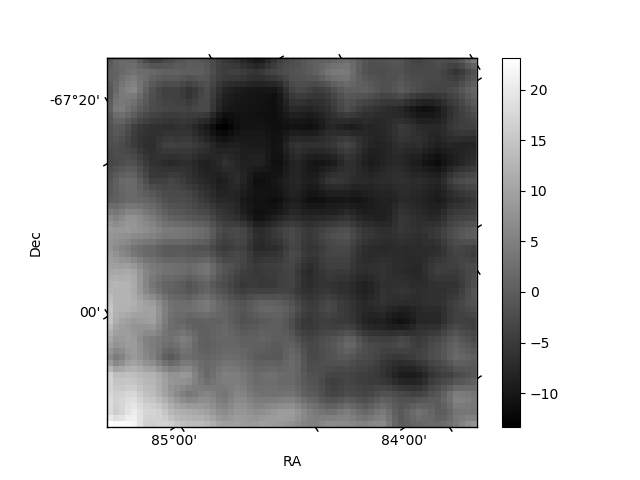
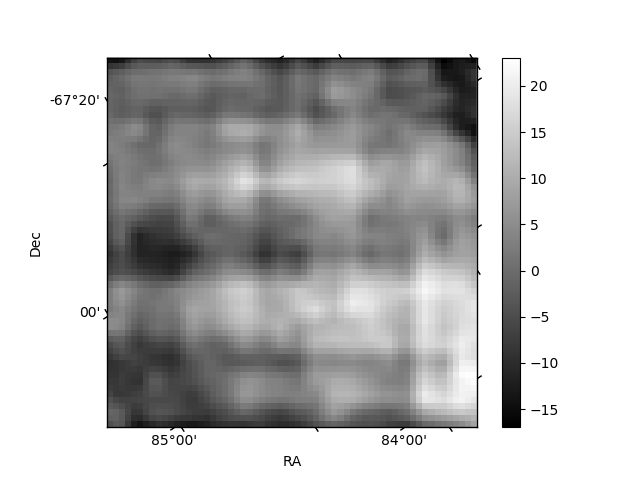
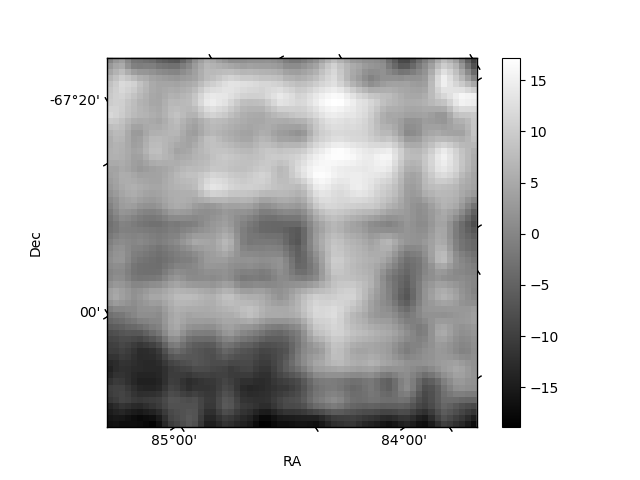
Histogram calculated using DETX and DETY for each event in the final _common_clean file
| Quadrant A | 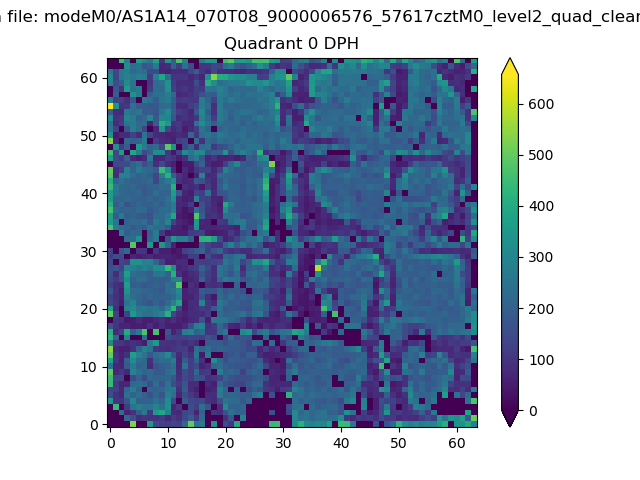 |
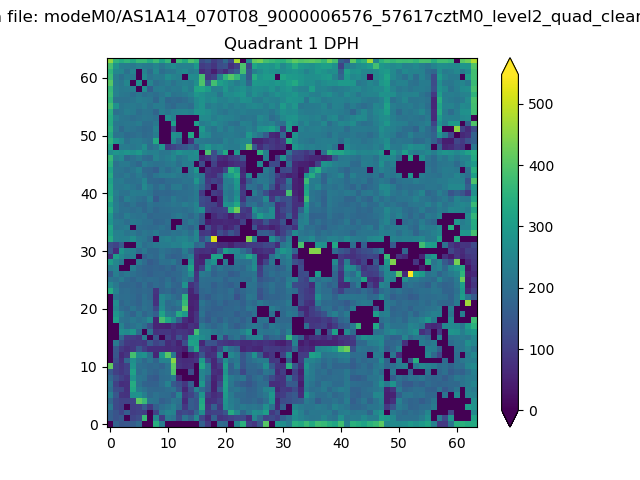 |
Quadrant B |
|---|---|---|---|
| Quadrant D | 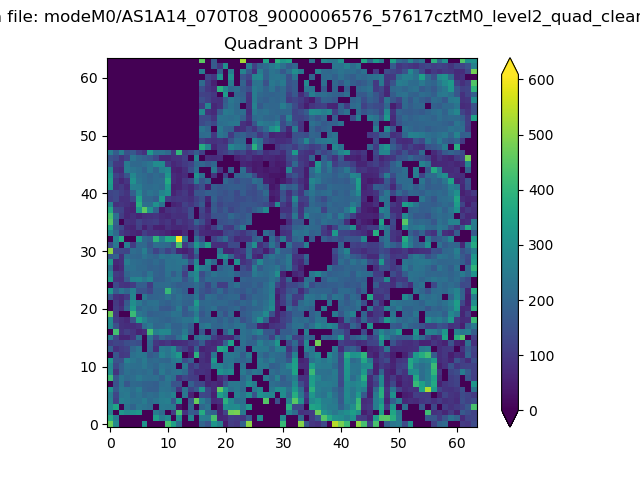 |
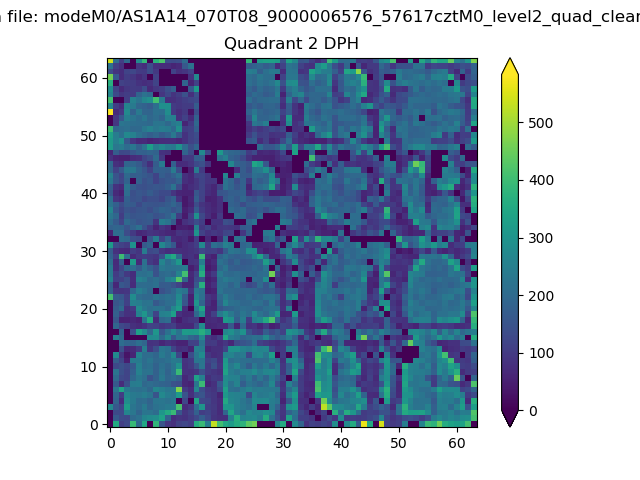 |
Quadrant C |
| Plot type | Count rate plots | Images |
|---|---|---|
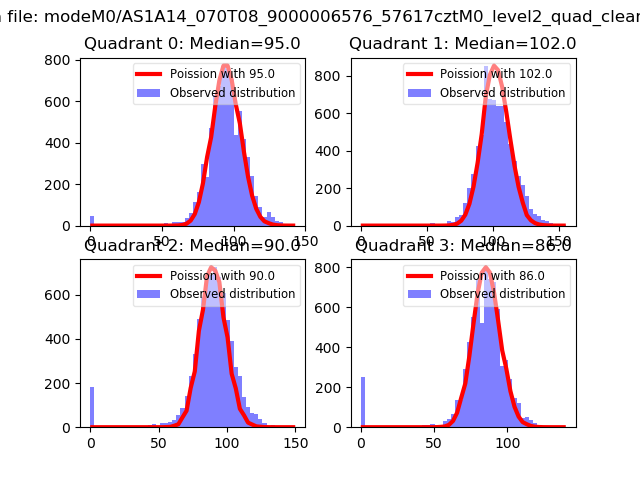
| Comparison with Poisson distribution Blue bars denote a histogram of data divided into 1 sec bins. Red curve is a Poisson curve with rate = median count rate of data. |
 |
 |
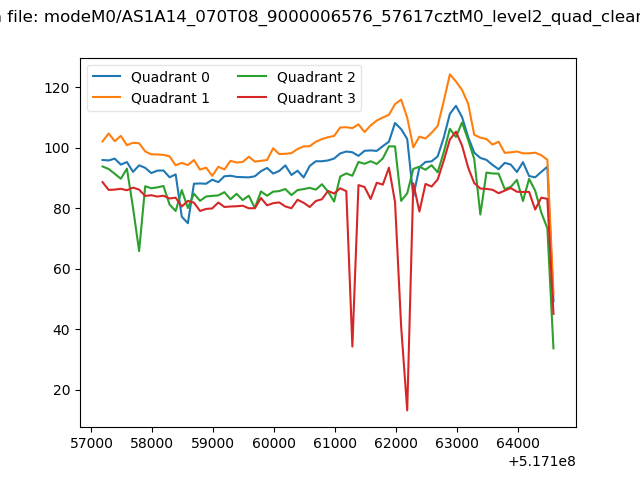
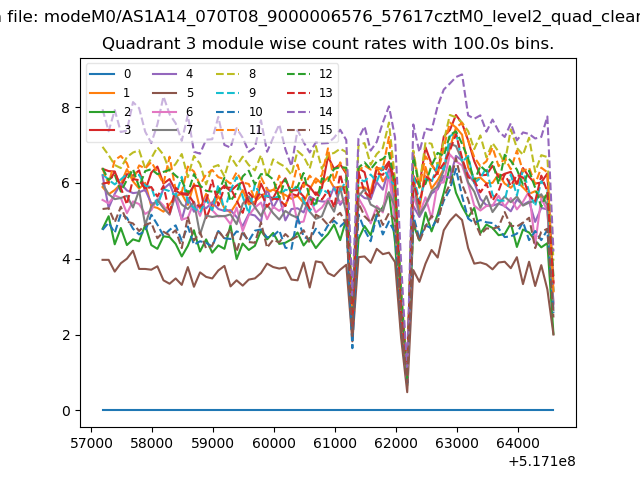
| Quadrant-wise count rates Data is divided into 100 sec bins |
 |
|
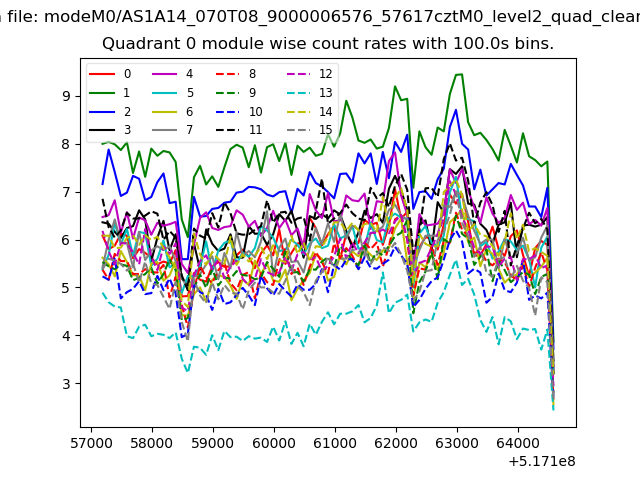
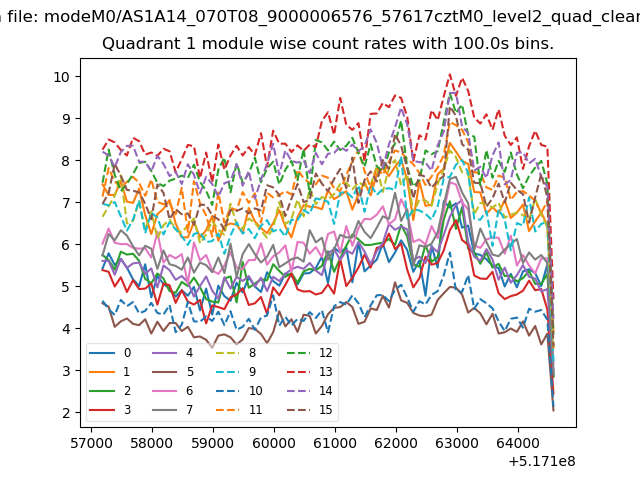
| Module-wise count rates for Quadrant A Data is divided into 100 sec bins |
 |
 |
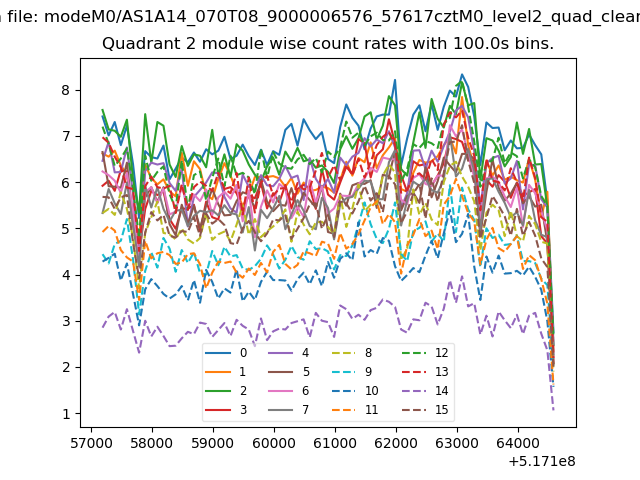
| Module-wise count rates for Quadrant B Data is divided into 100 sec bins |
 |
 |
| Module-wise count rates for Quadrant C Data is divided into 100 sec bins |
 |
 |
| Module-wise count rates for Quadrant D Data is divided into 100 sec bins |
 |
 |
| Parameter | Plot |
|---|---|
| CZT HV Monitor | 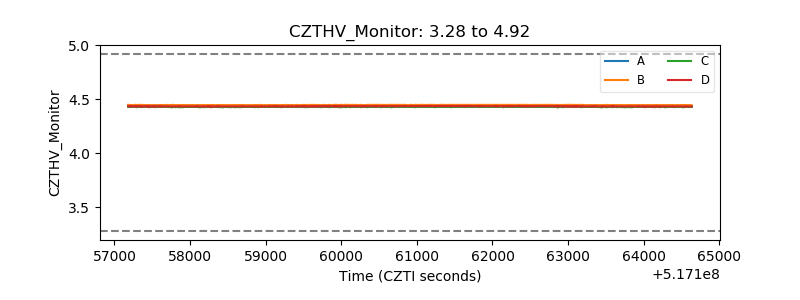 |
| D_VDD | 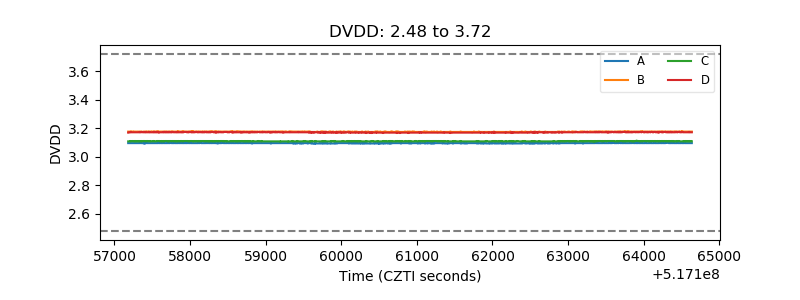 |
| Temperature 1 | 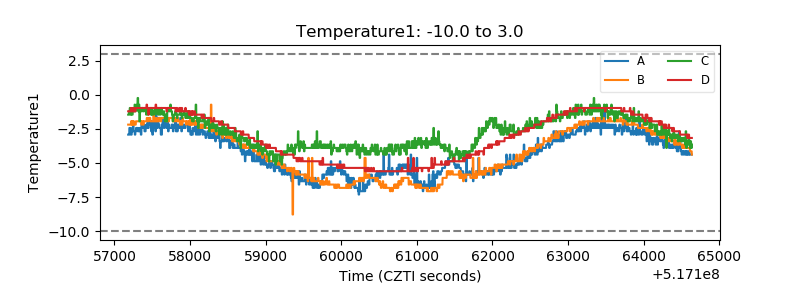 |
| Veto HV Monitor | 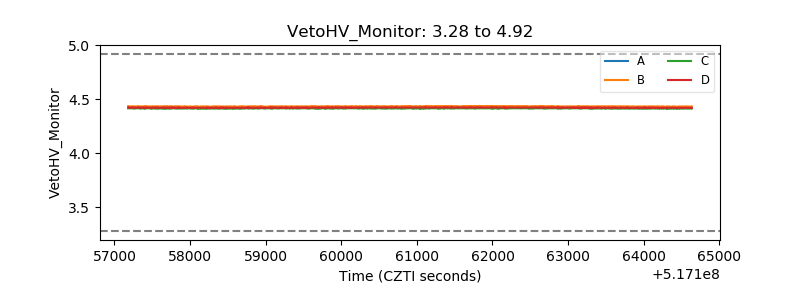 |
| Veto LLD | 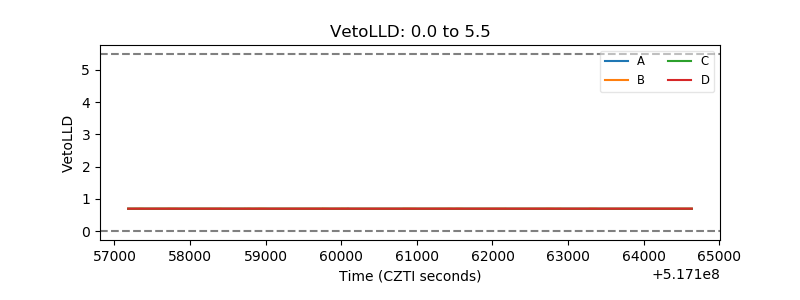 |
| Alpha Counter | 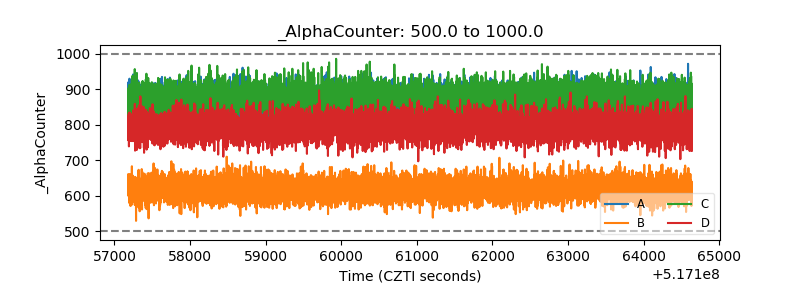 |
| _CPM_Rate | 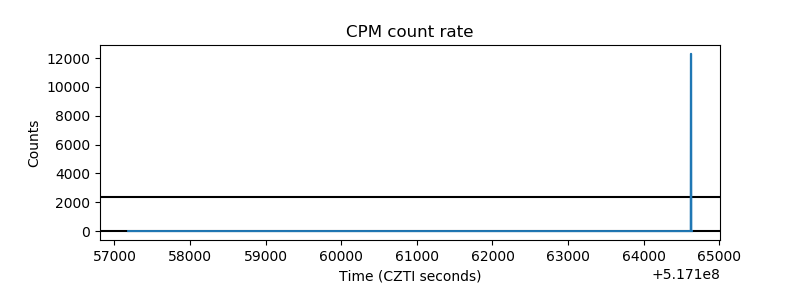 |
| CZT Counter | 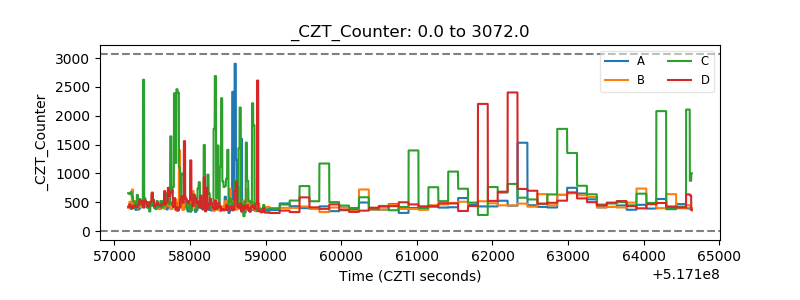 |
| +2.5 Volts monitor | 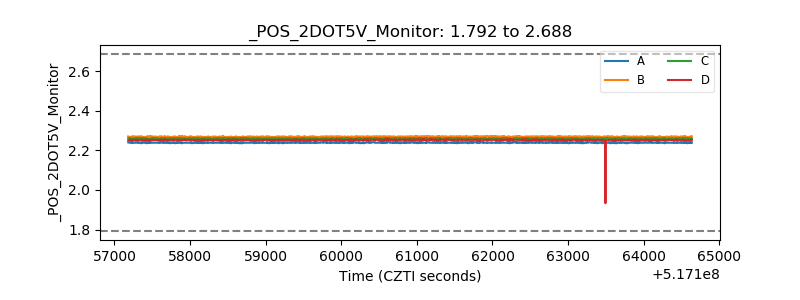 |
| +5 Volts monitor | 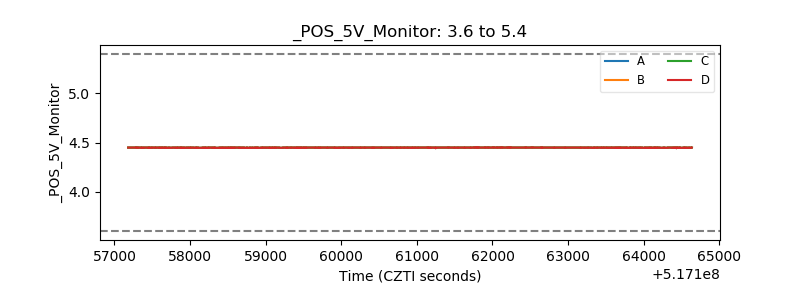 |
| _ROLL_ROT | 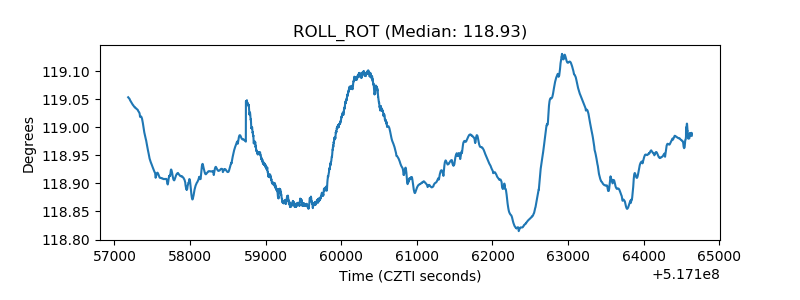 |
| _Roll_DEC | 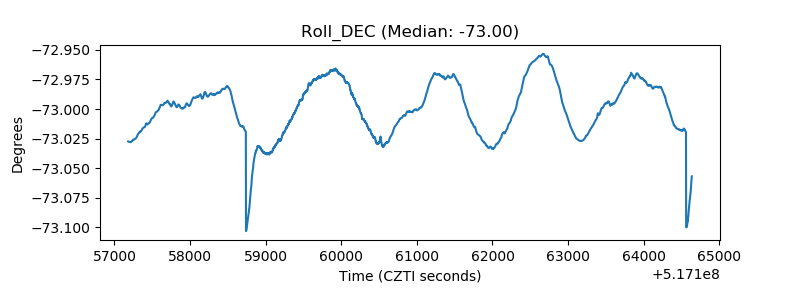 |
| _Roll_RA | 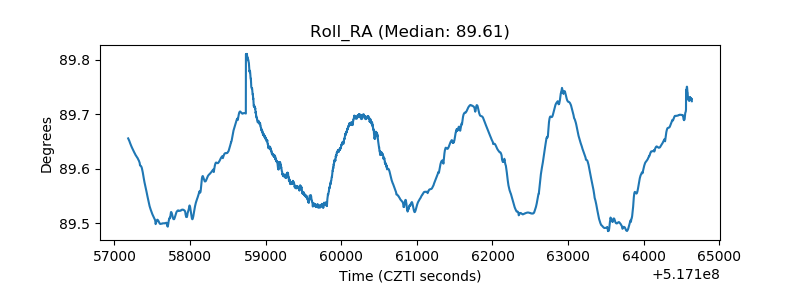 |
| Veto Counter | 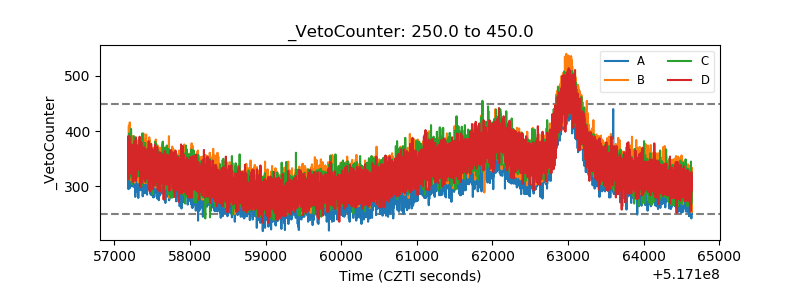 |