| Param | Original file | Final file |
|---|---|---|
| Filename | modeM0/AS1A14_070T08_9000006576_57620cztM0_level2.fits | modeM0/AS1A14_070T08_9000006576_57620cztM0_level2_quad_clean.evt |
| Size (bytes) | 1,349,951,040 | 207,527,040 |
| Size | 1.3 GB | 197.9 MB |
| Events in quadrant A | 8,678,063 | 1,325,259 |
| Events in quadrant B | 9,864,822 | 1,356,729 |
| Events in quadrant C | 15,040,594 | 1,224,160 |
| Events in quadrant D | 14,955,388 | 1,100,275 |
| Mode M0 | |||
|---|---|---|---|
| Quadrant | BADHDUFLAG | Total packets | Discarded packets |
| A | 0 | 38958 | 3 |
| B | 0 | 42479 | 3 |
| C | 0 | 57784 | 6 |
| D | 0 | 57433 | 3 |
| Mode M9 | |||
|---|---|---|---|
| Quadrant | BADHDUFLAG | Total packets | Discarded packets |
| A | 0 | 16 | 0 |
| B | 0 | 16 | 0 |
| C | 0 | 16 | 0 |
| D | 0 | 16 | 0 |
| Mode SS | |||
|---|---|---|---|
| Quadrant | BADHDUFLAG | Total packets | Discarded packets |
| A | 0 | 376 | 0 |
| B | 0 | 376 | 0 |
| C | 0 | 376 | 0 |
| D | 0 | 376 | 0 |
| Quadrant | Total seconds | Saturated seconds | Saturation percentage |
|---|---|---|---|
| A | 18507 | 95 | 0.513319% |
| B | 18508 | 360 | 1.945105% |
| C | 18507 | 1398 | 7.553899% |
| D | 18507 | 2340 | 12.643864% |
Noise dominated data is calculated using 1-second bins in cleaned event files. If a bin has >2000 counts, and if more than 50% of those come from <1% of pixels, then it is considered to be noise-dominated and hence unusable.
| Quadrant | # 1 sec bins | Bins with >0 counts | Bins with >2000 counts | High rate bins dominated by noise | Noise dominated (total time) | Noise dominated (detector-on time) | Marked lightcurve |
|---|---|---|---|---|---|---|---|
| A | 20406 | 18787 | 24 | 24 | 0.12% | 0.13% | 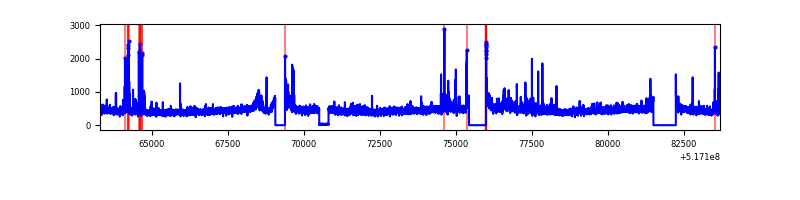 |
| B | 20407 | 18788 | 146 | 146 | 0.72% | 0.78% | 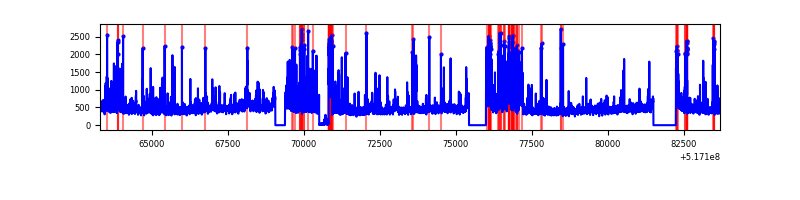 |
| C | 20406 | 18788 | 1275 | 1275 | 6.25% | 6.79% | 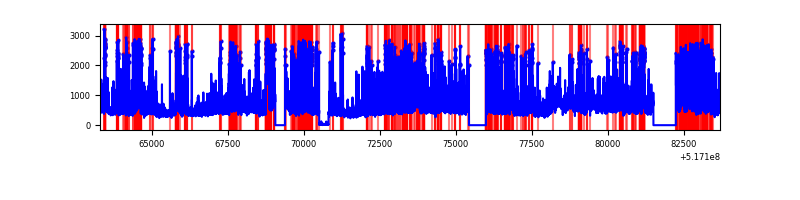 |
| D | 20406 | 18789 | 2332 | 2332 | 11.43% | 12.41% | 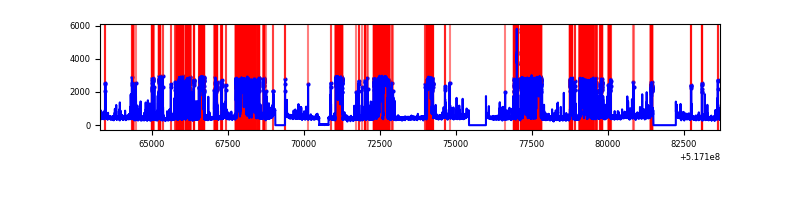 |
Top three noisy pixels from each quadrant. If the there are fewer than three noisy pixels in the level2.evt file, extra rows are filled as -1
| Pixel properties | Quadrant properties | ||||||
|---|---|---|---|---|---|---|---|
| Quadrant | DetID | PixID | Counts | Sigma | Mean | Median | Sigma |
| A | 3 | 14 | 605799 | 1240.68 | 1985 | 1933 | 486.7 |
| A | 7 | 160 | 171643 | 348.68 | 1985 | 1933 | 486.7 |
| A | 3 | 128 | 145198 | 294.35 | 1985 | 1933 | 486.7 |
| B | 5 | 172 | 836516 | 1994.07 | 1957 | 1880 | 418.6 |
| B | 10 | 247 | 547037 | 1302.46 | 1957 | 1880 | 418.6 |
| B | 7 | 252 | 151597 | 357.7 | 1957 | 1880 | 418.6 |
| C | 15 | 224 | 4869332 | 9711.35 | 1860 | 1842 | 501.2 |
| C | 9 | 38 | 1593222 | 3175.03 | 1860 | 1842 | 501.2 |
| C | 12 | 2 | 357514 | 709.62 | 1860 | 1842 | 501.2 |
| D | 15 | 142 | 6768016 | 13560.85 | 1779 | 1700 | 499.0 |
| D | 3 | 224 | 190593 | 378.57 | 1779 | 1700 | 499.0 |
| D | 5 | 173 | 134241 | 265.63 | 1779 | 1700 | 499.0 |
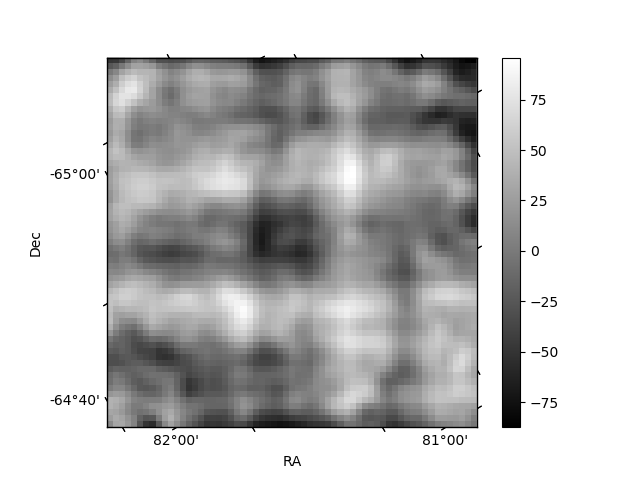
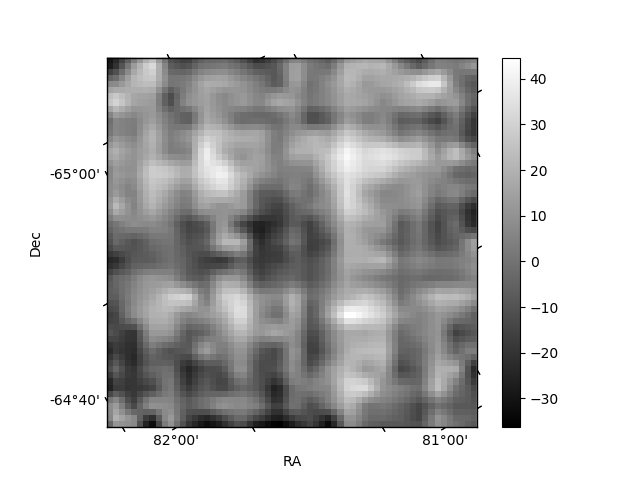
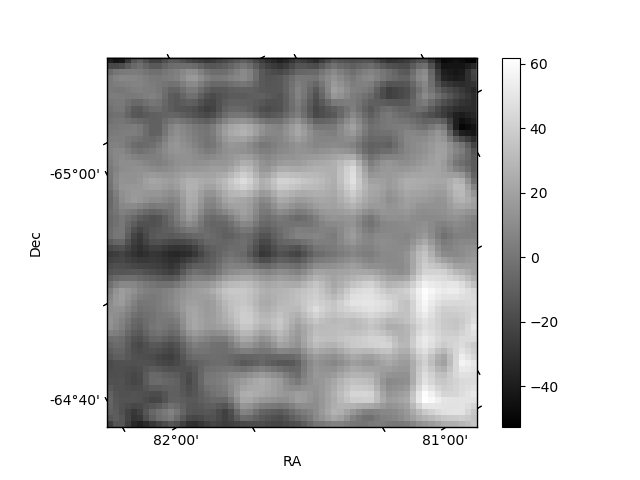
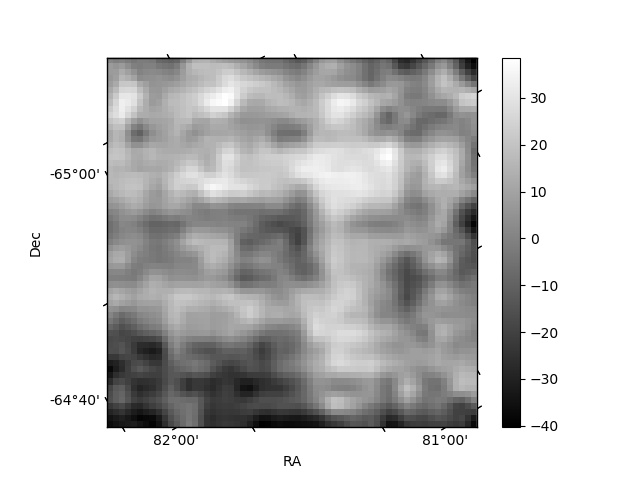
Histogram calculated using DETX and DETY for each event in the final _common_clean file
| Quadrant A | 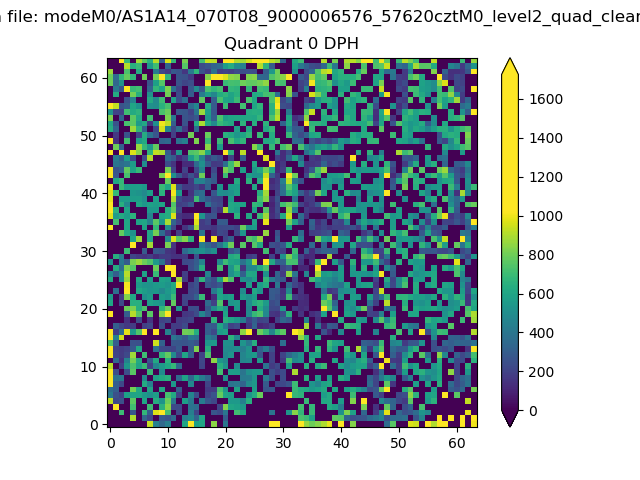 |
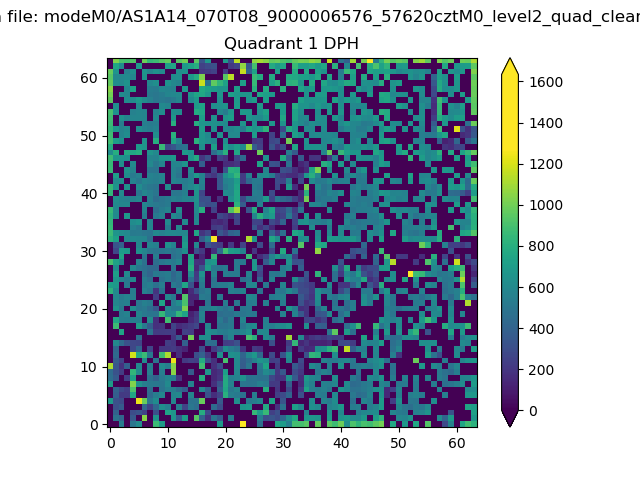 |
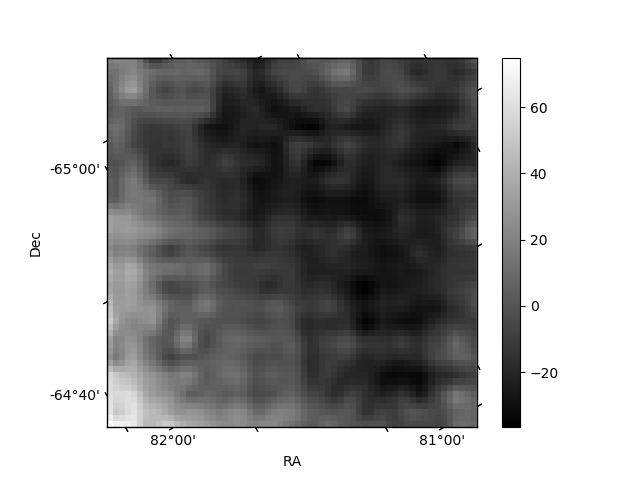
Quadrant B |
|---|---|---|---|
| Quadrant D | 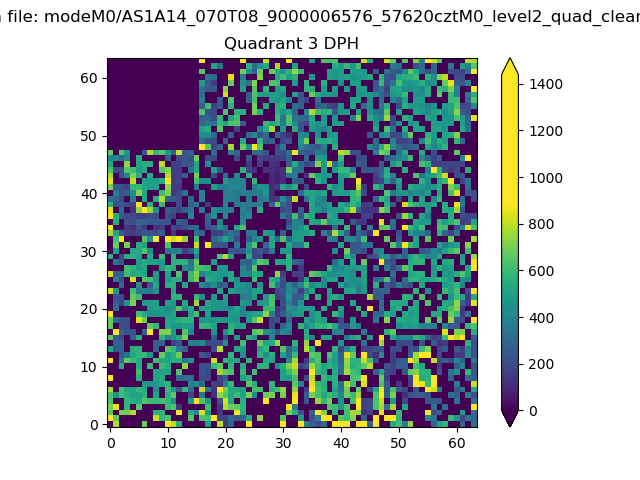 |
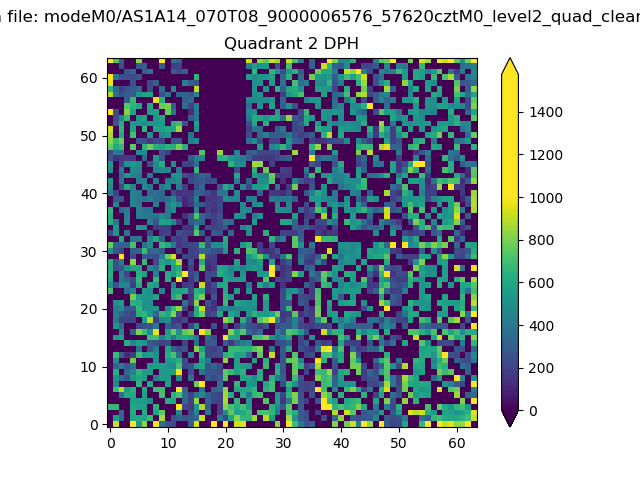 |
Quadrant C |
| Plot type | Count rate plots | Images |
|---|---|---|
| Comparison with Poisson distribution Blue bars denote a histogram of data divided into 1 sec bins. Red curve is a Poisson curve with rate = median count rate of data. |
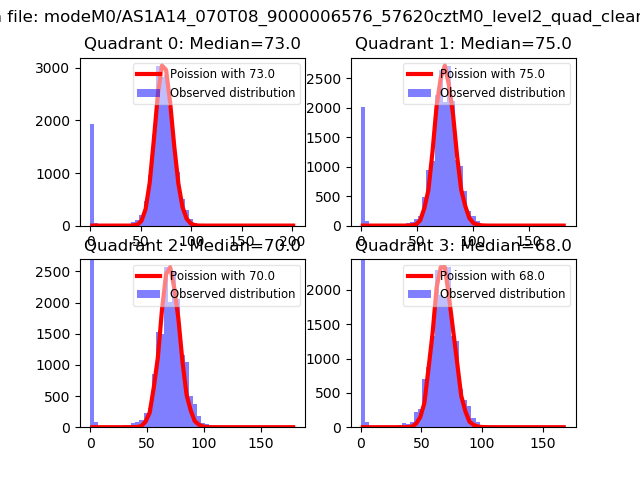 |
 |
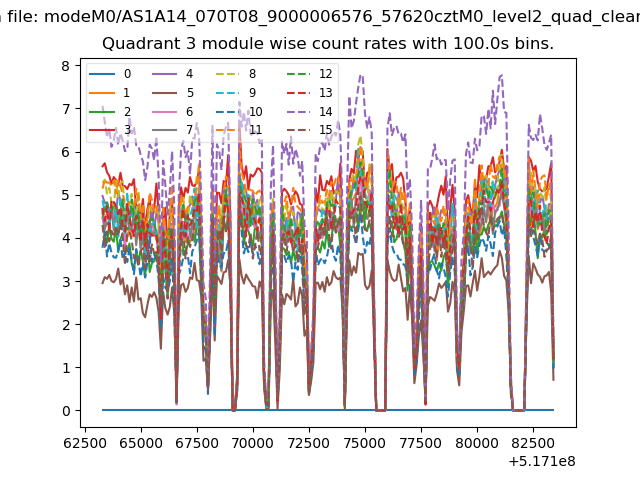
| Quadrant-wise count rates Data is divided into 100 sec bins |
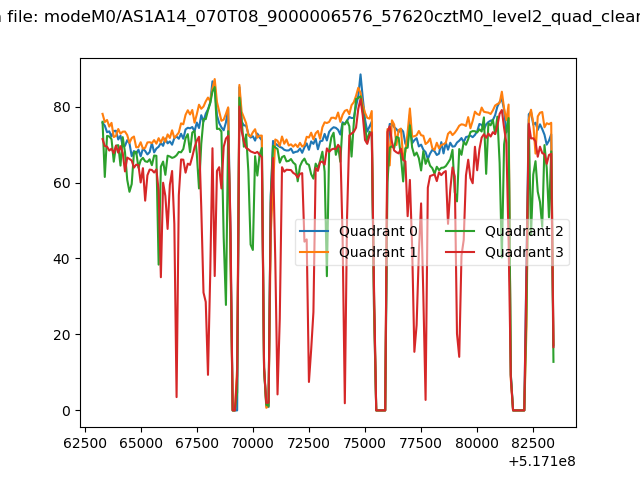 |
|
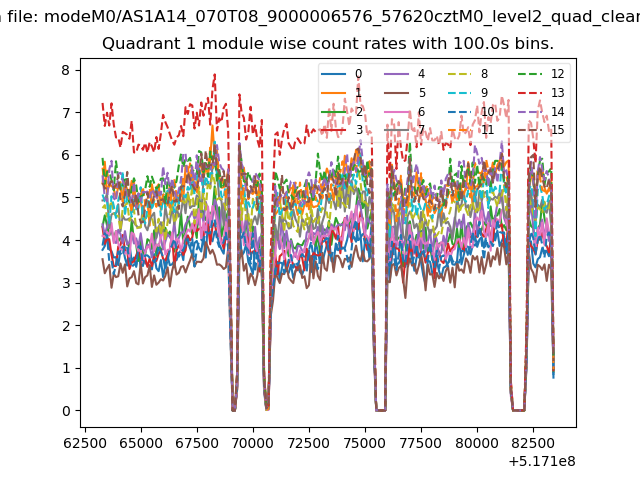
| Module-wise count rates for Quadrant A Data is divided into 100 sec bins |
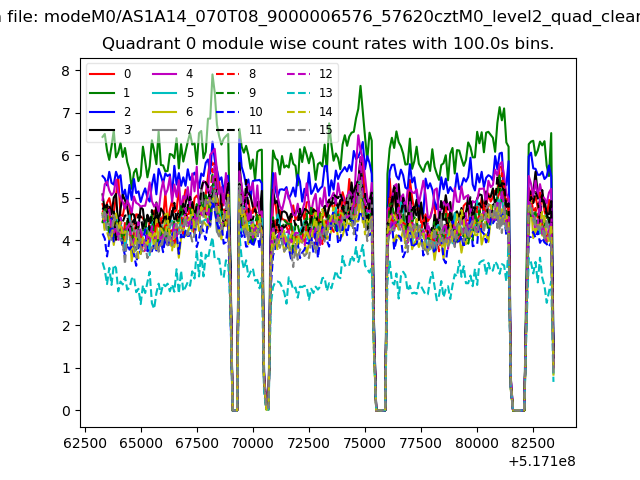 |
 |
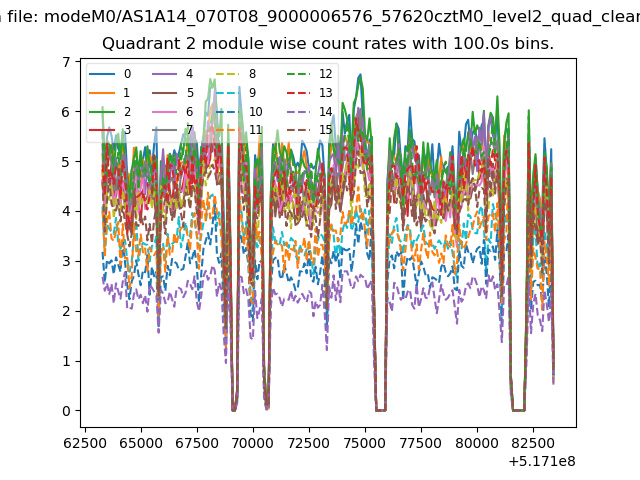
| Module-wise count rates for Quadrant B Data is divided into 100 sec bins |
 |
 |
| Module-wise count rates for Quadrant C Data is divided into 100 sec bins |
 |
 |
| Module-wise count rates for Quadrant D Data is divided into 100 sec bins |
 |
 |
| Parameter | Plot |
|---|---|
| CZT HV Monitor | 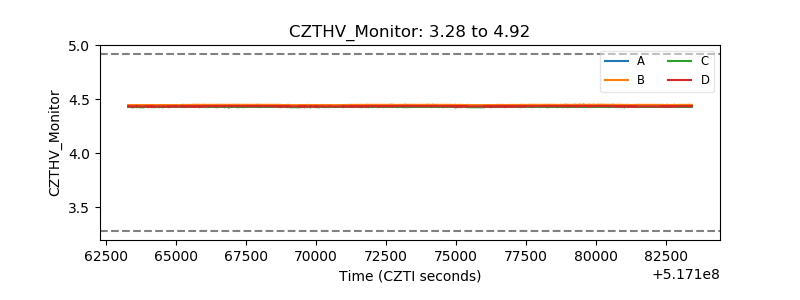 |
| D_VDD | 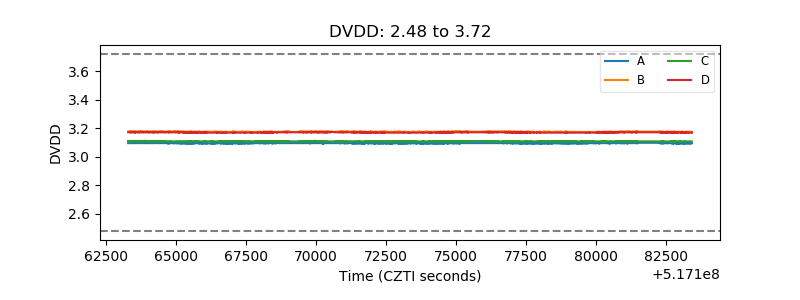 |
| Temperature 1 | 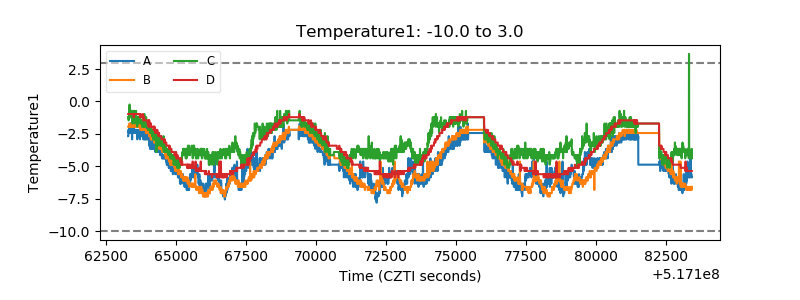 |
| Veto HV Monitor | 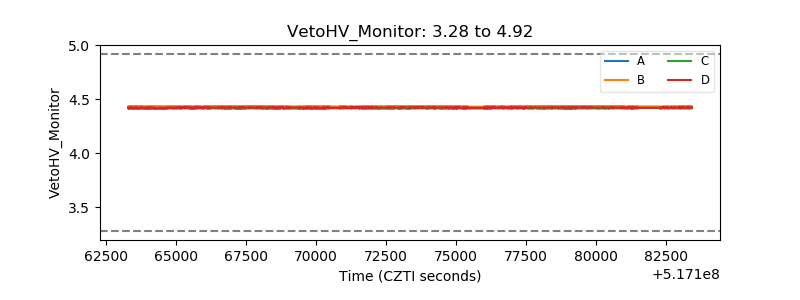 |
| Veto LLD | 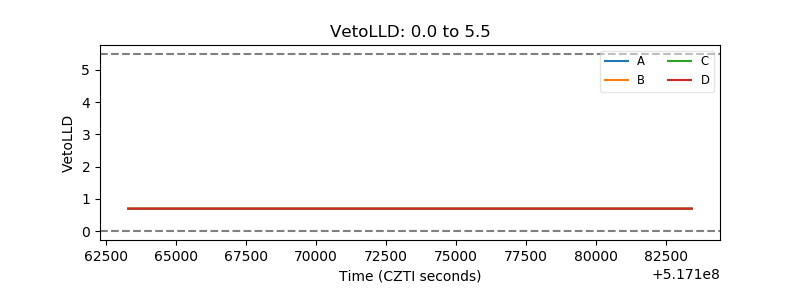 |
| Alpha Counter | 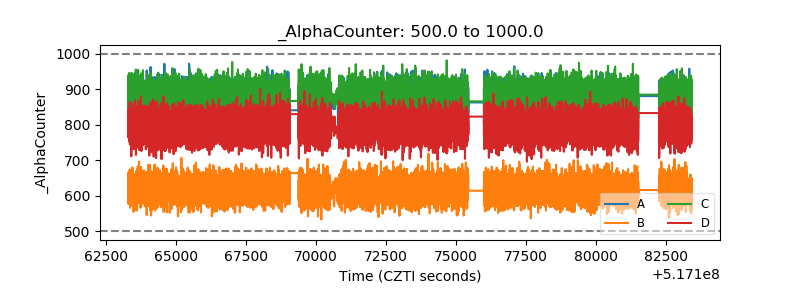 |
| _CPM_Rate | 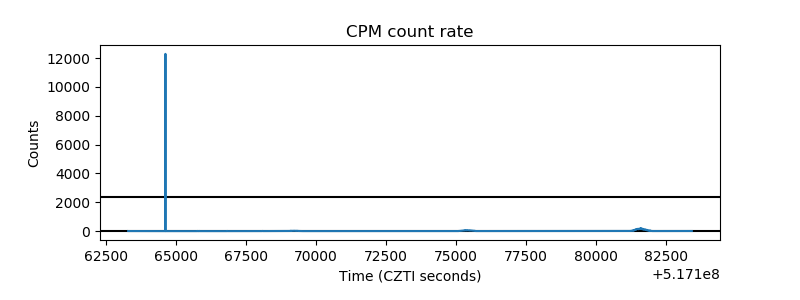 |
| CZT Counter | 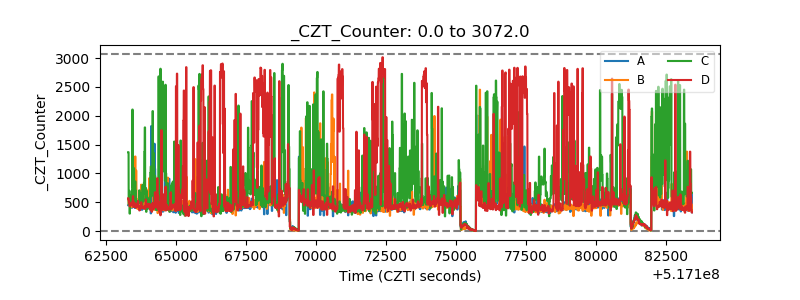 |
| +2.5 Volts monitor | 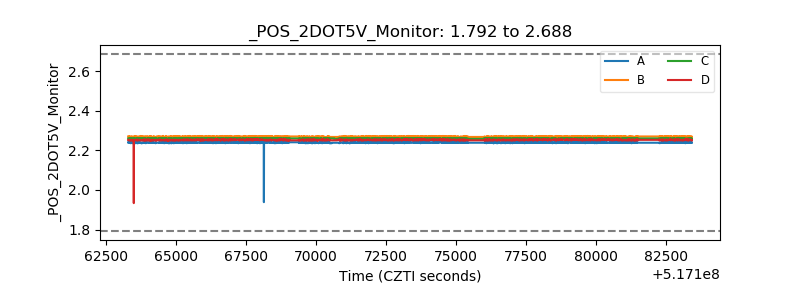 |
| +5 Volts monitor | 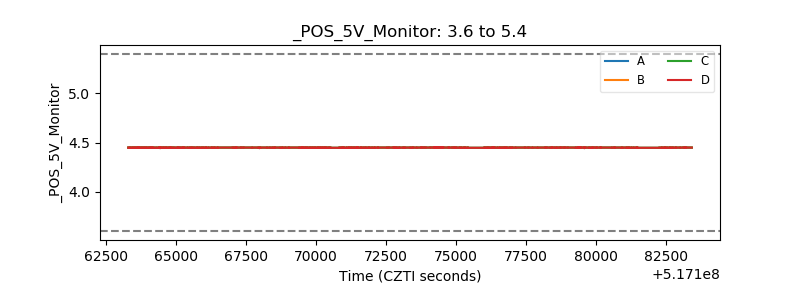 |
| _ROLL_ROT | 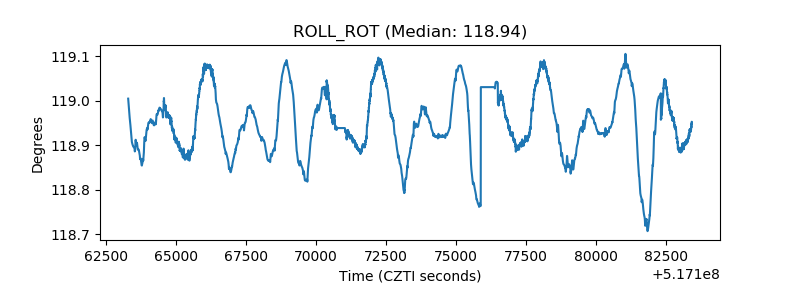 |
| _Roll_DEC | 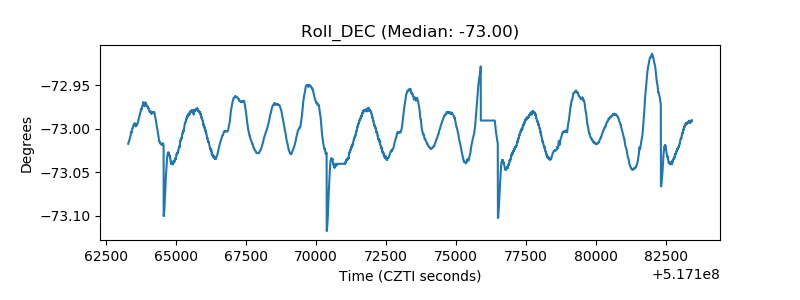 |
| _Roll_RA | 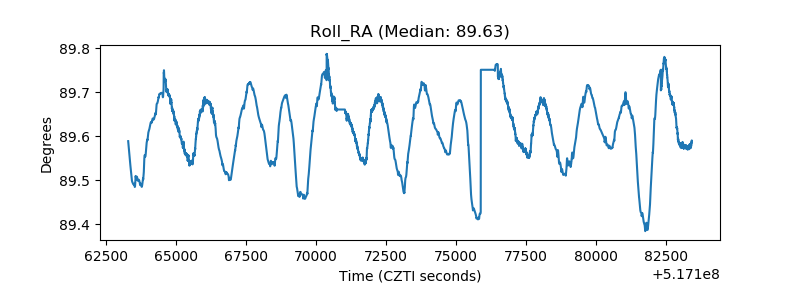 |
| Veto Counter | 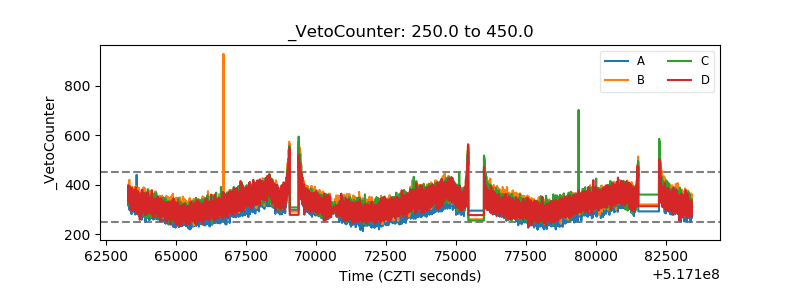 |