| Param | Original file | Final file |
|---|---|---|
| Filename | modeM0/AS1A14_070T08_9000006576_57621cztM0_level2.fits | modeM0/AS1A14_070T08_9000006576_57621cztM0_level2_quad_clean.evt |
| Size (bytes) | 440,893,440 | 96,932,160 |
| Size | 420.5 MB | 92.4 MB |
| Events in quadrant A | 2,919,183 | 645,137 |
| Events in quadrant B | 3,249,909 | 685,722 |
| Events in quadrant C | 6,171,141 | 560,812 |
| Events in quadrant D | 3,456,042 | 573,558 |
| Mode M0 | |||
|---|---|---|---|
| Quadrant | BADHDUFLAG | Total packets | Discarded packets |
| A | 0 | 13746 | 2 |
| B | 0 | 14536 | 2 |
| C | 0 | 23002 | 2 |
| D | 0 | 15111 | 2 |
| Mode M9 | |||
|---|---|---|---|
| Quadrant | BADHDUFLAG | Total packets | Discarded packets |
| A | 0 | 13 | 0 |
| B | 0 | 14 | 0 |
| C | 0 | 14 | 0 |
| D | 0 | 14 | 0 |
| Mode SS | |||
|---|---|---|---|
| Quadrant | BADHDUFLAG | Total packets | Discarded packets |
| A | 0 | 136 | 0 |
| B | 0 | 136 | 0 |
| C | 0 | 136 | 0 |
| D | 0 | 136 | 0 |
| Quadrant | Total seconds | Saturated seconds | Saturation percentage |
|---|---|---|---|
| A | 6741 | 26 | 0.385699% |
| B | 6741 | 100 | 1.483459% |
| C | 6741 | 727 | 10.784750% |
| D | 6741 | 76 | 1.127429% |
Noise dominated data is calculated using 1-second bins in cleaned event files. If a bin has >2000 counts, and if more than 50% of those come from <1% of pixels, then it is considered to be noise-dominated and hence unusable.
| Quadrant | # 1 sec bins | Bins with >0 counts | Bins with >2000 counts | High rate bins dominated by noise | Noise dominated (total time) | Noise dominated (detector-on time) | Marked lightcurve |
|---|---|---|---|---|---|---|---|
| A | 7650 | 6741 | 1 | 1 | 0.01% | 0.01% | 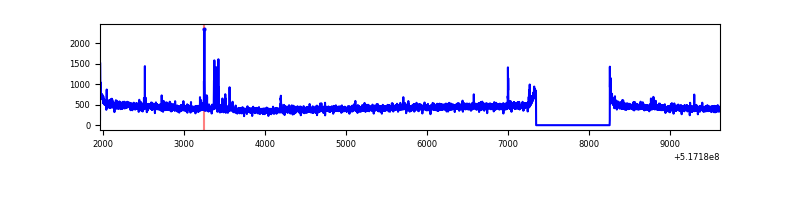 |
| B | 7650 | 6741 | 30 | 30 | 0.39% | 0.45% | 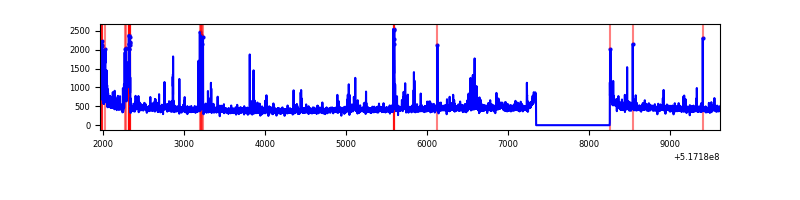 |
| C | 7650 | 6741 | 648 | 648 | 8.47% | 9.61% | 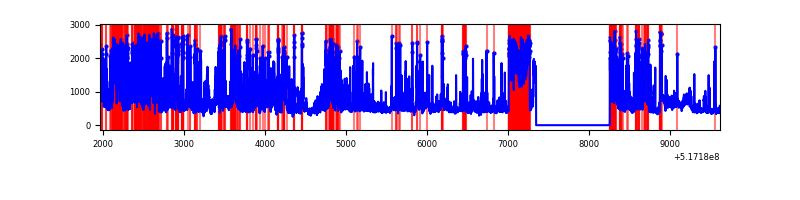 |
| D | 7650 | 6741 | 75 | 75 | 0.98% | 1.11% | 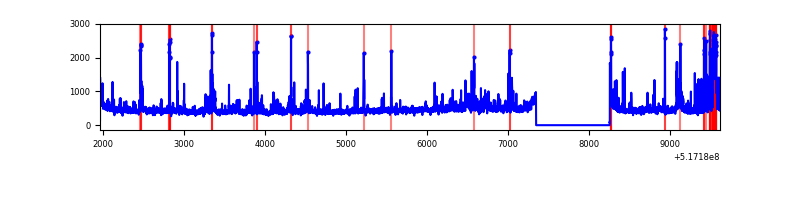 |
Top three noisy pixels from each quadrant. If the there are fewer than three noisy pixels in the level2.evt file, extra rows are filled as -1
| Pixel properties | Quadrant properties | ||||||
|---|---|---|---|---|---|---|---|
| Quadrant | DetID | PixID | Counts | Sigma | Mean | Median | Sigma |
| A | 3 | 14 | 62021 | 341.88 | 724 | 703 | 179.4 |
| A | 7 | 160 | 43341 | 237.73 | 724 | 703 | 179.4 |
| A | 3 | 137 | 8878 | 45.58 | 724 | 703 | 179.4 |
| B | 5 | 172 | 88208 | 570.24 | 717 | 689 | 153.5 |
| B | 10 | 247 | 77582 | 501.01 | 717 | 689 | 153.5 |
| B | 10 | 16 | 74532 | 481.13 | 717 | 689 | 153.5 |
| C | 15 | 224 | 2087021 | 11268.84 | 679 | 672 | 185.1 |
| C | 9 | 38 | 1130472 | 6102.3 | 679 | 672 | 185.1 |
| C | 10 | 22 | 132084 | 709.78 | 679 | 672 | 185.1 |
| D | 15 | 142 | 198334 | 1005.86 | 697 | 665 | 196.5 |
| D | 8 | 160 | 82387 | 415.85 | 697 | 665 | 196.5 |
| D | 3 | 224 | 81402 | 410.84 | 697 | 665 | 196.5 |
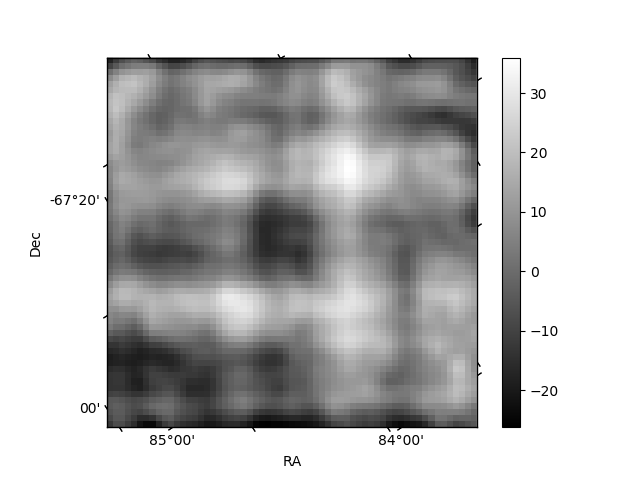
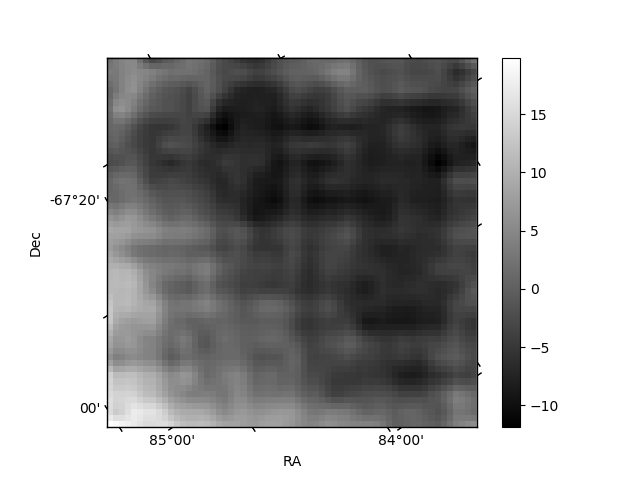
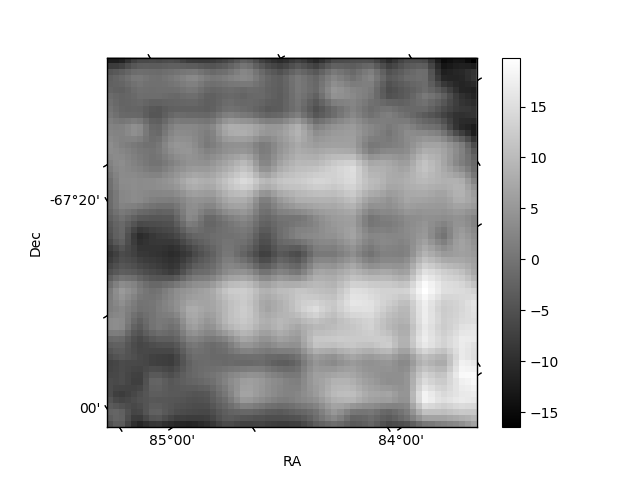
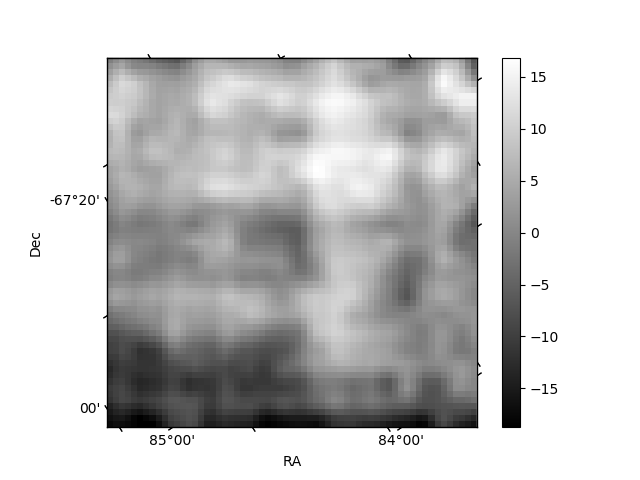
Histogram calculated using DETX and DETY for each event in the final _common_clean file
| Quadrant A | 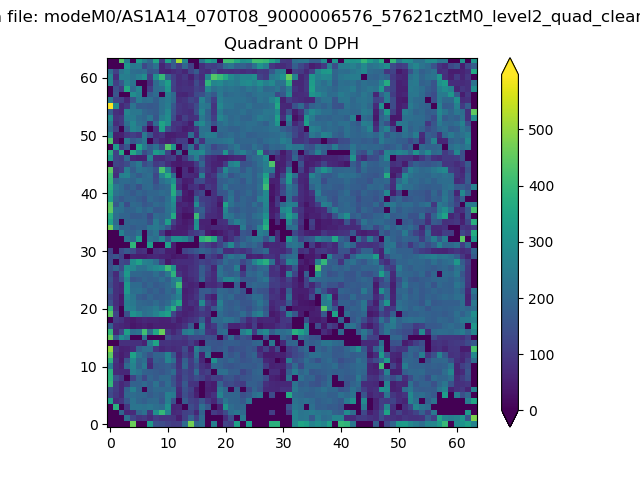 |
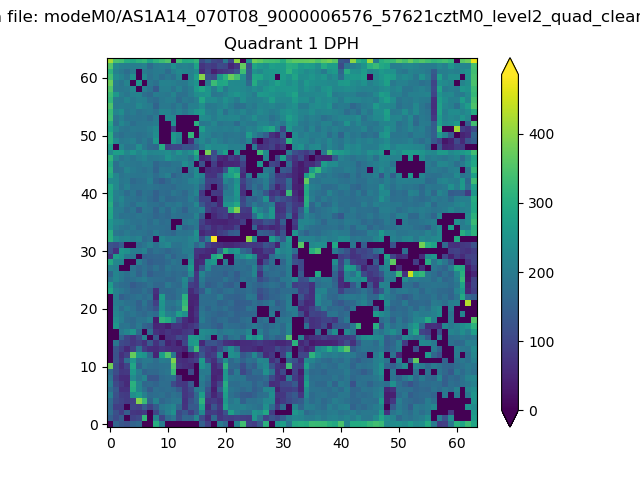 |
Quadrant B |
|---|---|---|---|
| Quadrant D | 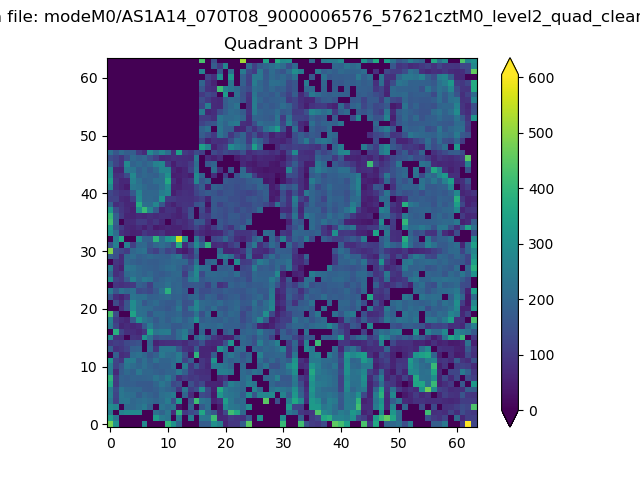 |
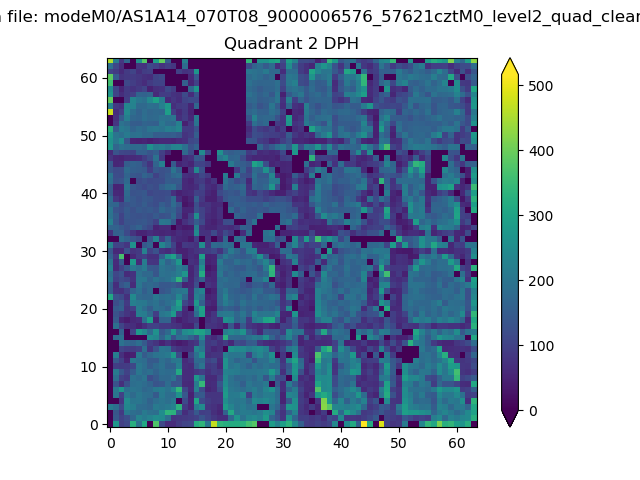 |
Quadrant C |
| Plot type | Count rate plots | Images |
|---|---|---|
| Comparison with Poisson distribution Blue bars denote a histogram of data divided into 1 sec bins. Red curve is a Poisson curve with rate = median count rate of data. |
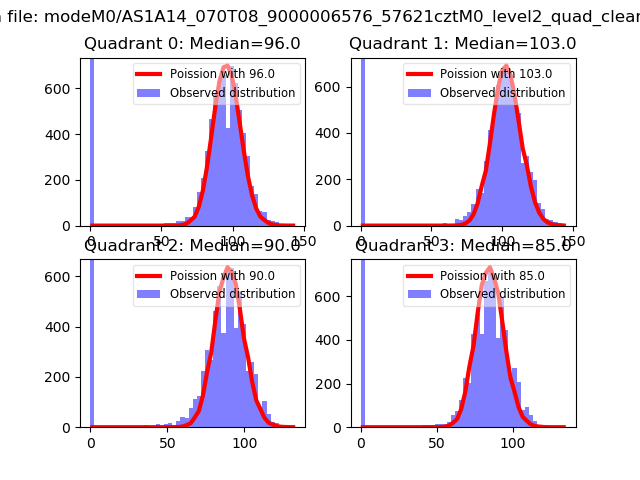 |
 |
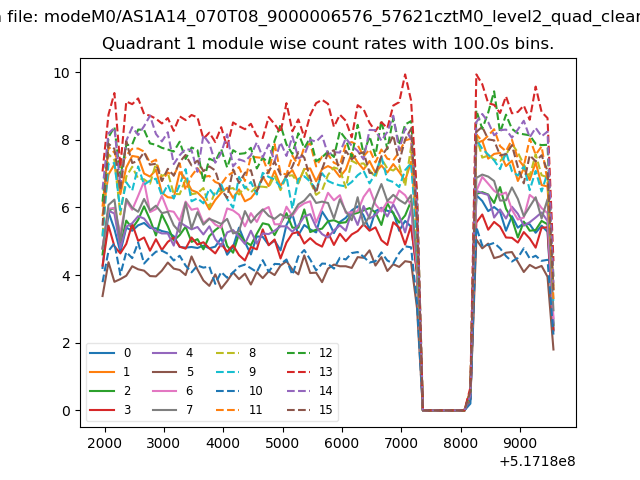
| Quadrant-wise count rates Data is divided into 100 sec bins |
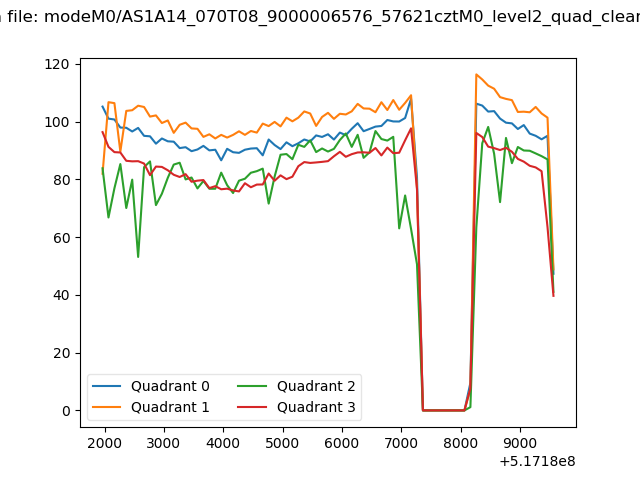 |
|
| Module-wise count rates for Quadrant A Data is divided into 100 sec bins |
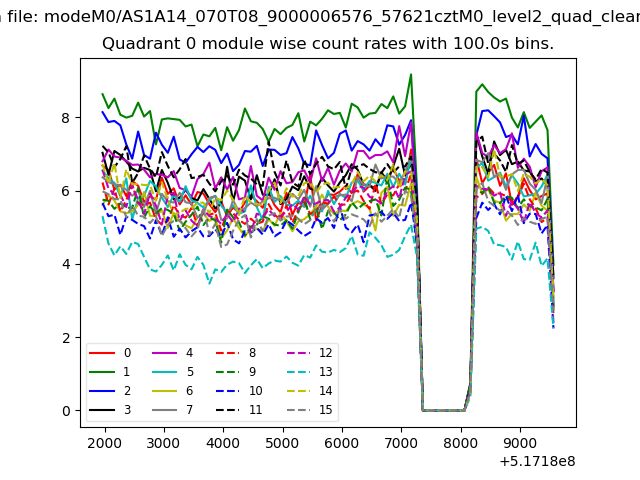 |
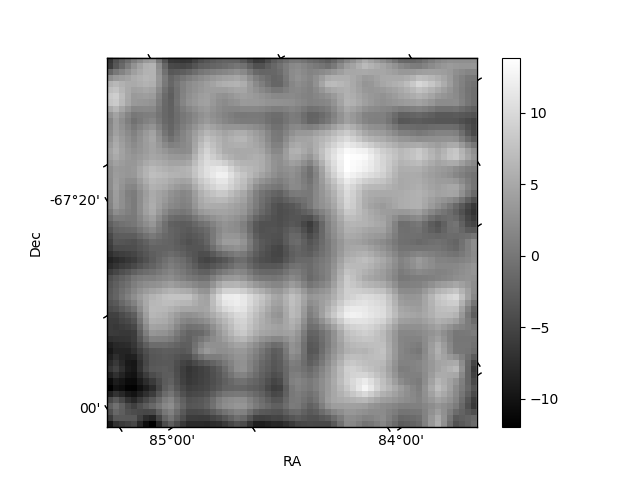 |
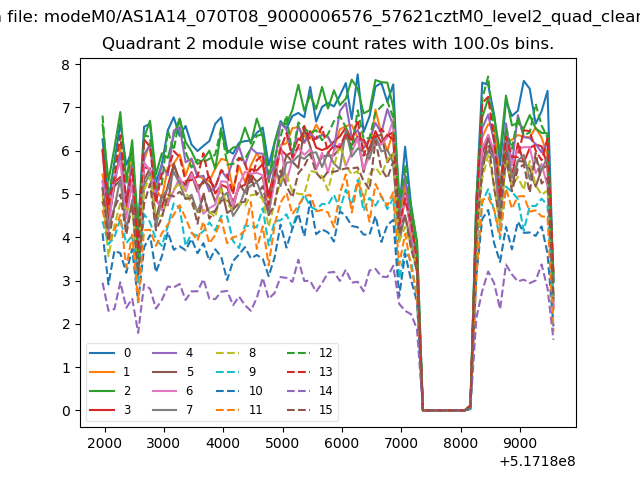
| Module-wise count rates for Quadrant B Data is divided into 100 sec bins |
 |
 |
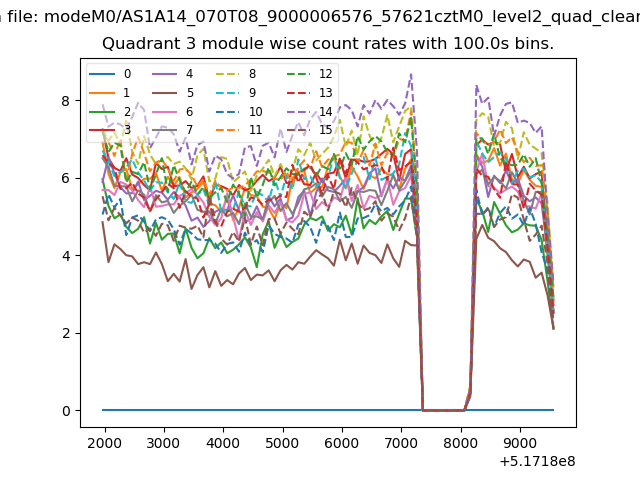
| Module-wise count rates for Quadrant C Data is divided into 100 sec bins |
 |
 |
| Module-wise count rates for Quadrant D Data is divided into 100 sec bins |
 |
 |
| Parameter | Plot |
|---|---|
| CZT HV Monitor | 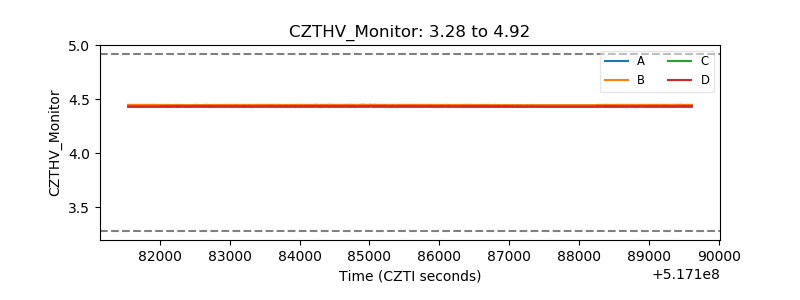 |
| D_VDD | 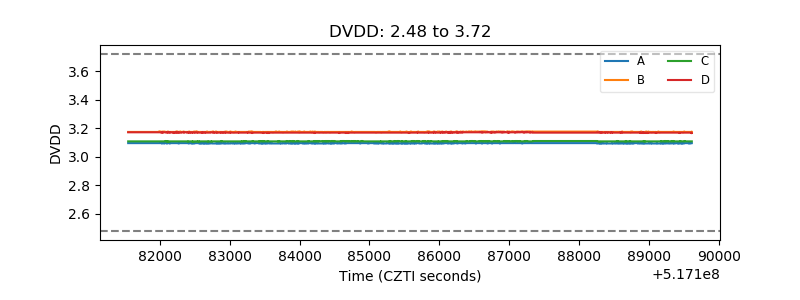 |
| Temperature 1 | 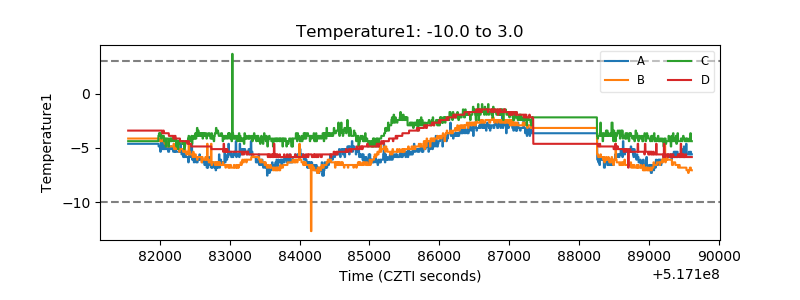 |
| Veto HV Monitor | 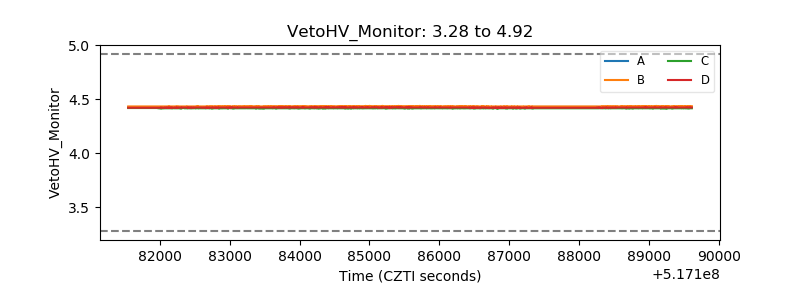 |
| Veto LLD | 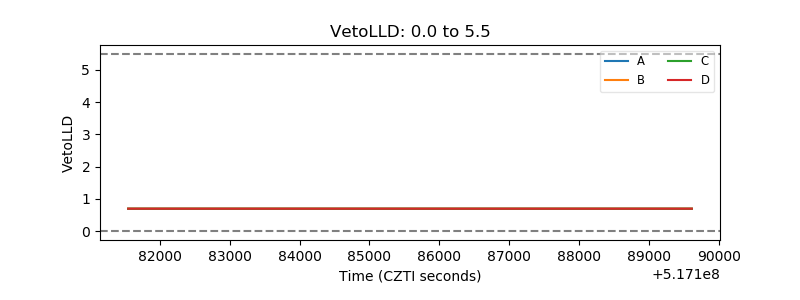 |
| Alpha Counter | 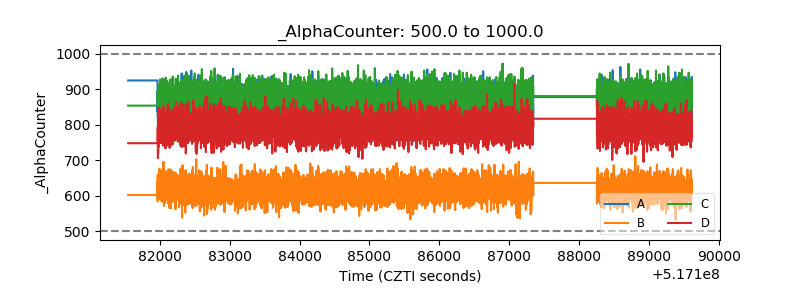 |
| _CPM_Rate | 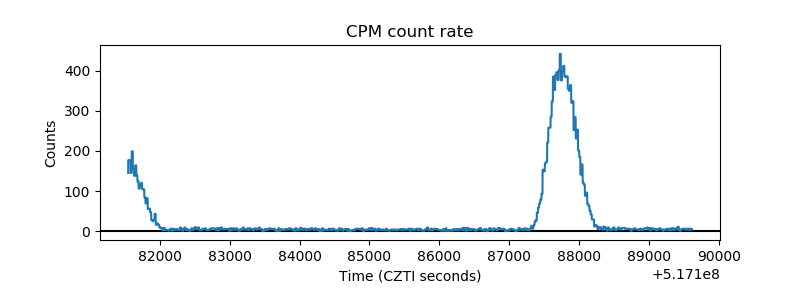 |
| CZT Counter | 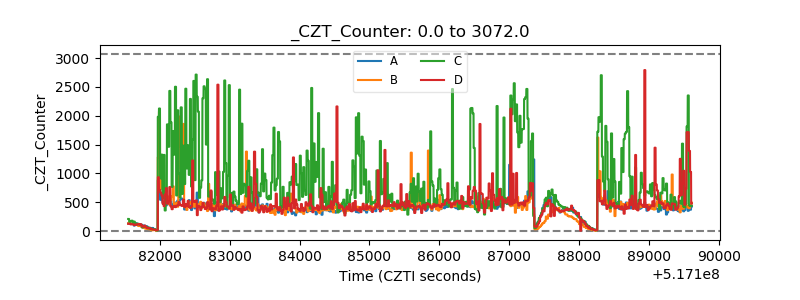 |
| +2.5 Volts monitor |  |
| +5 Volts monitor | 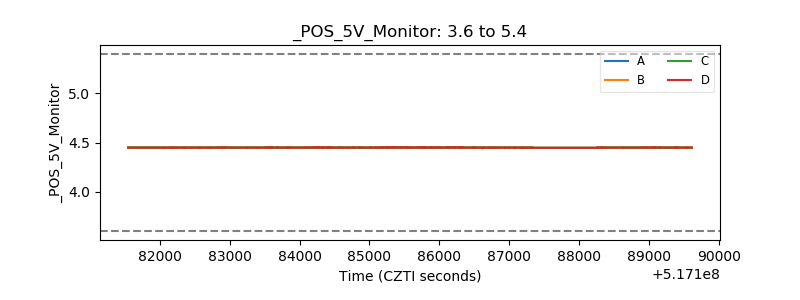 |
| _ROLL_ROT | 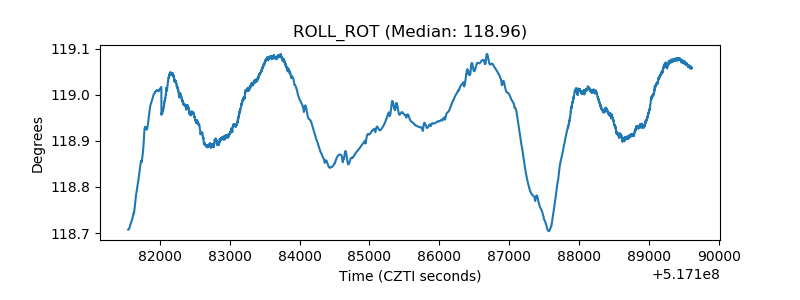 |
| _Roll_DEC | 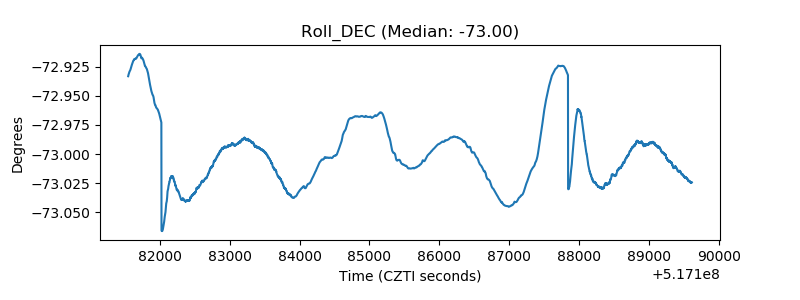 |
| _Roll_RA | 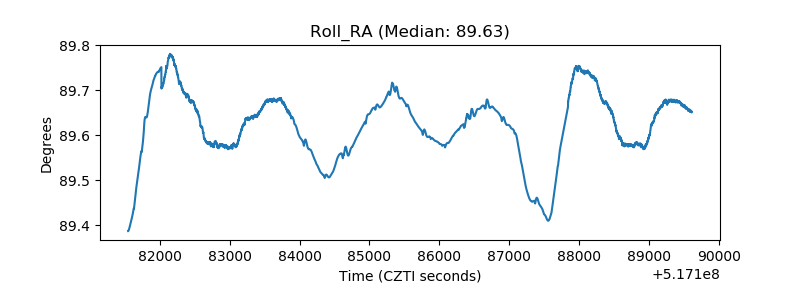 |
| Veto Counter | 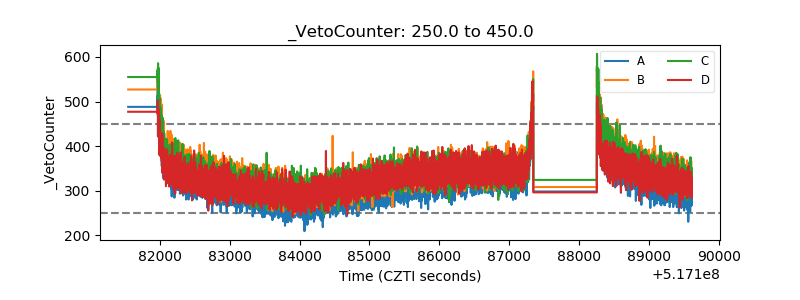 |