| Param | Original file | Final file |
|---|---|---|
| Filename | modeM0/AS1A14_070T08_9000006576_57623cztM0_level2.fits | modeM0/AS1A14_070T08_9000006576_57623cztM0_level2_quad_clean.evt |
| Size (bytes) | 461,197,440 | 96,937,920 |
| Size | 439.8 MB | 92.4 MB |
| Events in quadrant A | 3,336,491 | 634,121 |
| Events in quadrant B | 3,508,094 | 681,084 |
| Events in quadrant C | 5,547,063 | 569,132 |
| Events in quadrant D | 4,130,170 | 557,794 |
| Mode M0 | |||
|---|---|---|---|
| Quadrant | BADHDUFLAG | Total packets | Discarded packets |
| A | 0 | 15057 | 2 |
| B | 0 | 15440 | 2 |
| C | 0 | 21382 | 2 |
| D | 0 | 17188 | 2 |
| Mode M9 | |||
|---|---|---|---|
| Quadrant | BADHDUFLAG | Total packets | Discarded packets |
| A | 0 | 19 | 0 |
| B | 0 | 19 | 0 |
| C | 0 | 19 | 0 |
| D | 0 | 19 | 0 |
| Mode SS | |||
|---|---|---|---|
| Quadrant | BADHDUFLAG | Total packets | Discarded packets |
| A | 0 | 146 | 0 |
| B | 0 | 146 | 0 |
| C | 0 | 146 | 0 |
| D | 0 | 146 | 0 |
| Quadrant | Total seconds | Saturated seconds | Saturation percentage |
|---|---|---|---|
| A | 7078 | 74 | 1.045493% |
| B | 7079 | 73 | 1.031219% |
| C | 7078 | 586 | 8.279175% |
| D | 7078 | 183 | 2.585476% |
Noise dominated data is calculated using 1-second bins in cleaned event files. If a bin has >2000 counts, and if more than 50% of those come from <1% of pixels, then it is considered to be noise-dominated and hence unusable.
| Quadrant | # 1 sec bins | Bins with >0 counts | Bins with >2000 counts | High rate bins dominated by noise | Noise dominated (total time) | Noise dominated (detector-on time) | Marked lightcurve |
|---|---|---|---|---|---|---|---|
| A | 9305 | 7362 | 27 | 27 | 0.29% | 0.37% | 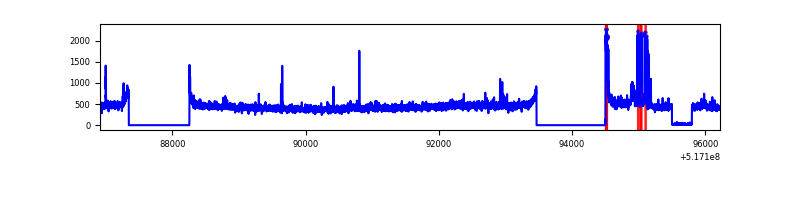 |
| B | 9306 | 7363 | 9 | 9 | 0.10% | 0.12% | 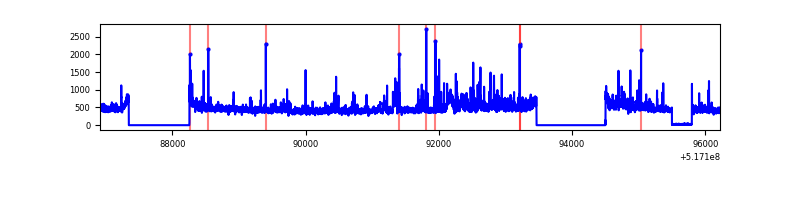 |
| C | 9305 | 7362 | 484 | 484 | 5.20% | 6.57% | 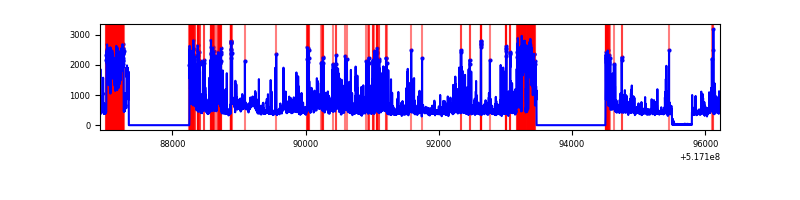 |
| D | 9305 | 7362 | 182 | 182 | 1.96% | 2.47% | 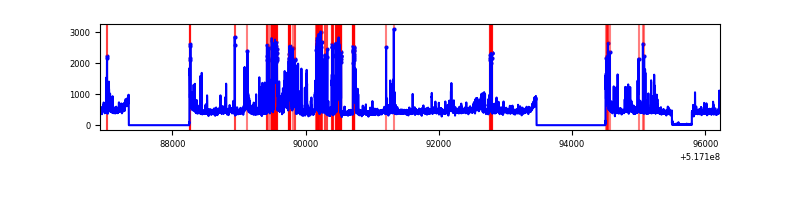 |
Top three noisy pixels from each quadrant. If the there are fewer than three noisy pixels in the level2.evt file, extra rows are filled as -1
| Pixel properties | Quadrant properties | ||||||
|---|---|---|---|---|---|---|---|
| Quadrant | DetID | PixID | Counts | Sigma | Mean | Median | Sigma |
| A | 3 | 14 | 311368 | 1627.23 | 772 | 752 | 190.9 |
| A | 7 | 160 | 27933 | 142.39 | 772 | 752 | 190.9 |
| A | 3 | 128 | 12606 | 62.1 | 772 | 752 | 190.9 |
| B | 4 | 80 | 227347 | 1381.94 | 768 | 738 | 164.0 |
| B | 10 | 247 | 61355 | 369.66 | 768 | 738 | 164.0 |
| B | 7 | 252 | 30707 | 182.76 | 768 | 738 | 164.0 |
| C | 15 | 224 | 1629594 | 8251.6 | 729 | 723 | 197.4 |
| C | 9 | 38 | 887408 | 4491.8 | 729 | 723 | 197.4 |
| C | 12 | 2 | 55082 | 275.37 | 729 | 723 | 197.4 |
| D | 15 | 142 | 627642 | 2970.52 | 744 | 709 | 211.1 |
| D | 2 | 120 | 140551 | 662.6 | 744 | 709 | 211.1 |
| D | 8 | 160 | 115471 | 543.76 | 744 | 709 | 211.1 |
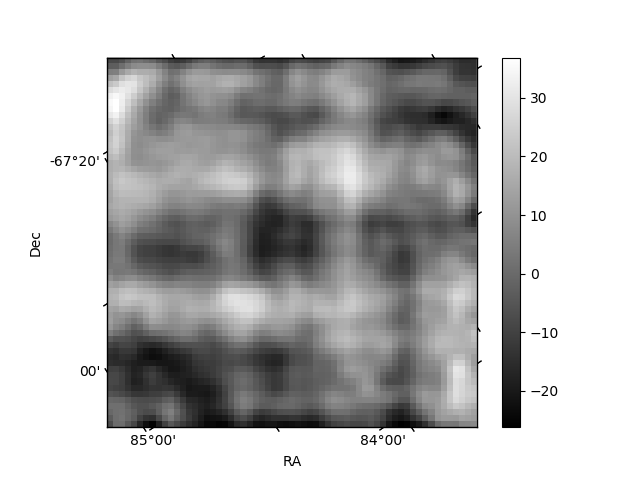
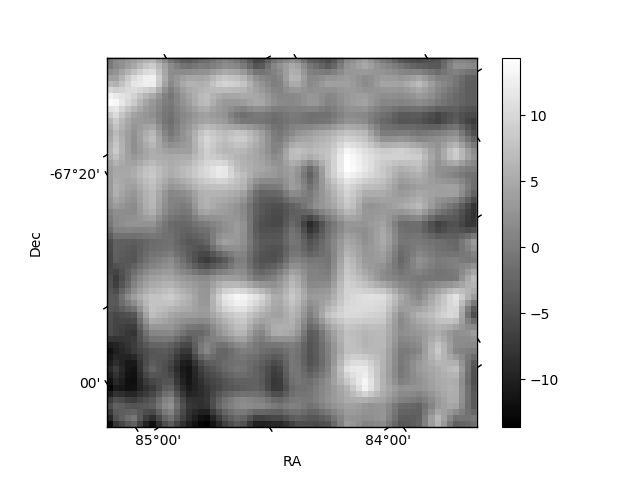
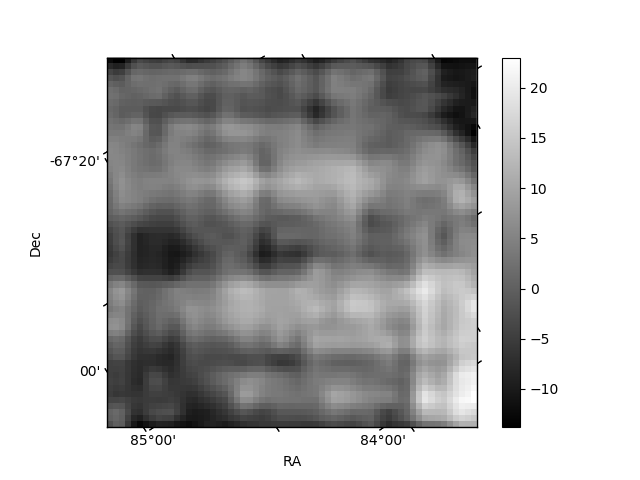
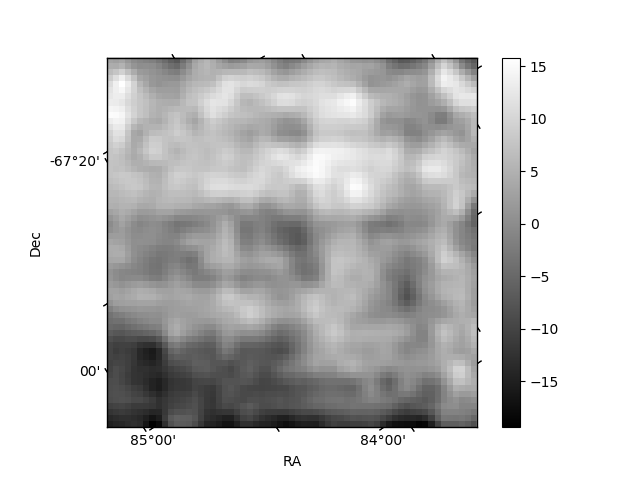
Histogram calculated using DETX and DETY for each event in the final _common_clean file
| Quadrant A | 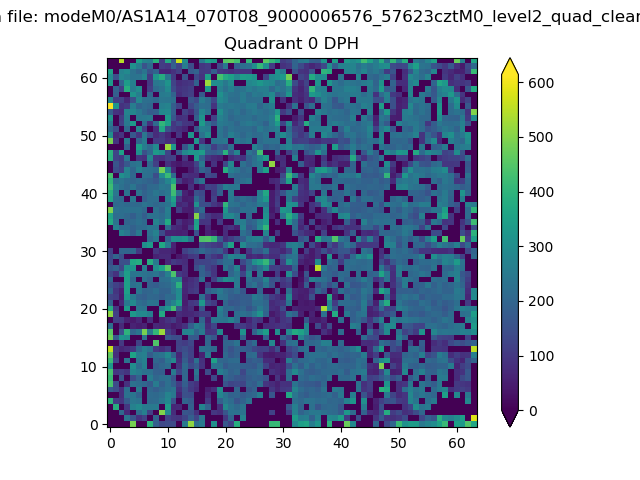 |
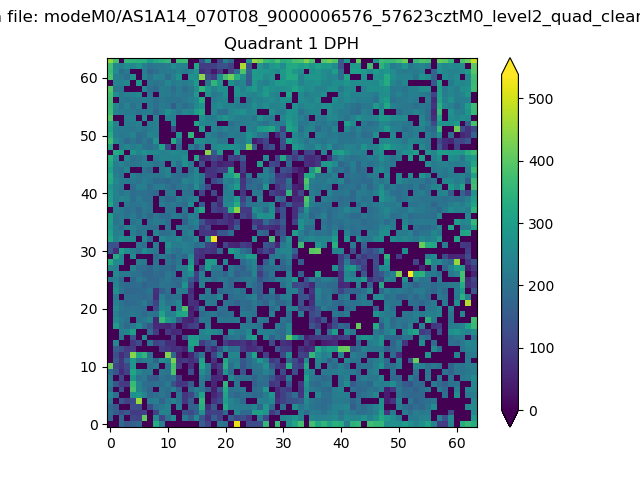 |
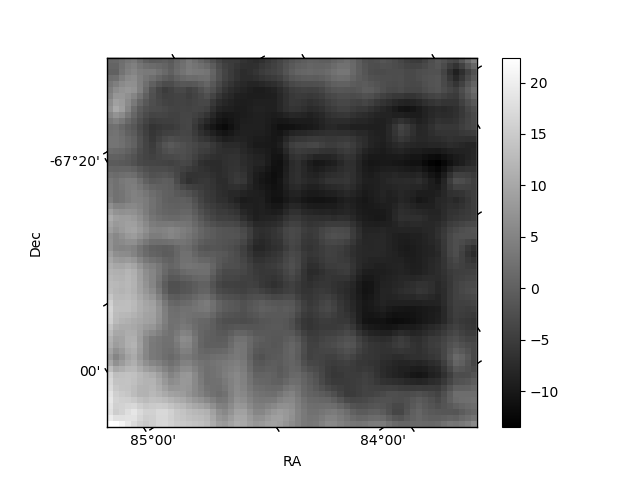
Quadrant B |
|---|---|---|---|
| Quadrant D | 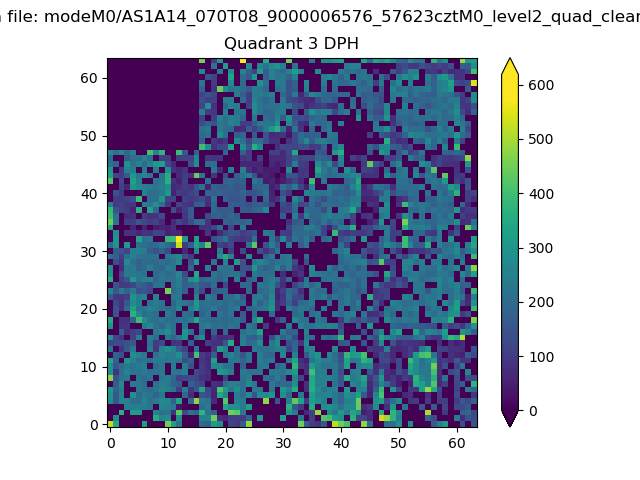 |
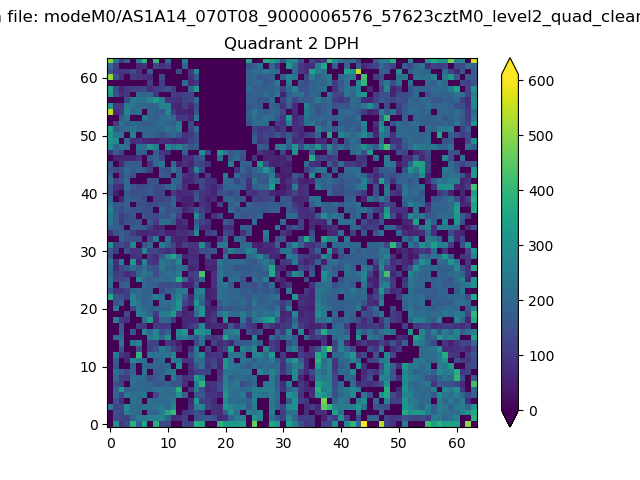 |
Quadrant C |
| Plot type | Count rate plots | Images |
|---|---|---|
| Comparison with Poisson distribution Blue bars denote a histogram of data divided into 1 sec bins. Red curve is a Poisson curve with rate = median count rate of data. |
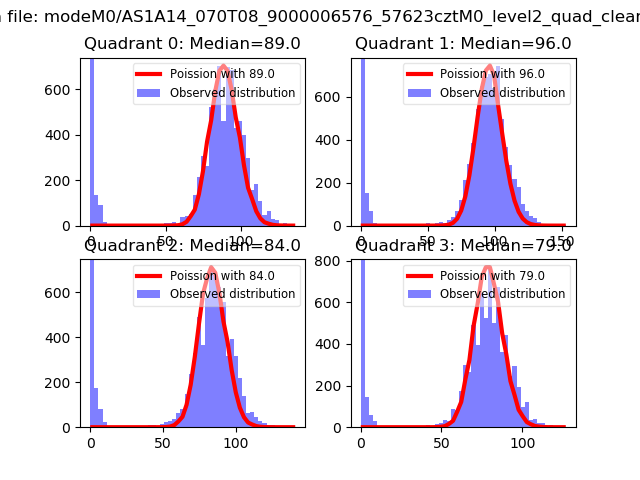 |
 |
| Quadrant-wise count rates Data is divided into 100 sec bins |
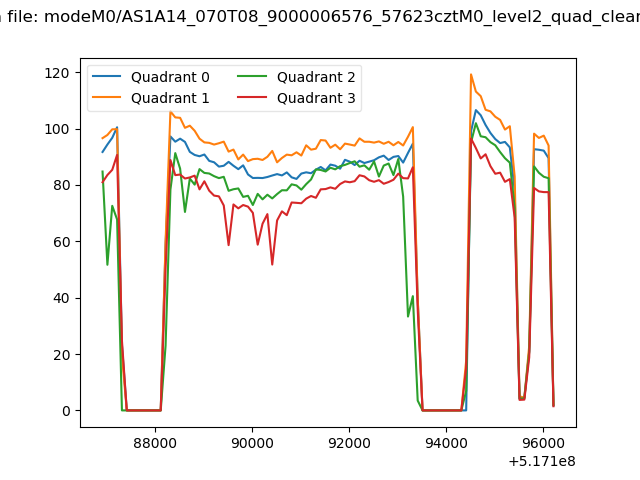 |
|
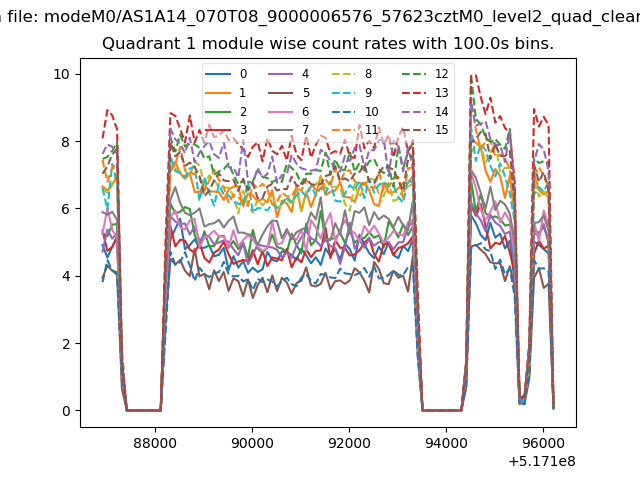
| Module-wise count rates for Quadrant A Data is divided into 100 sec bins |
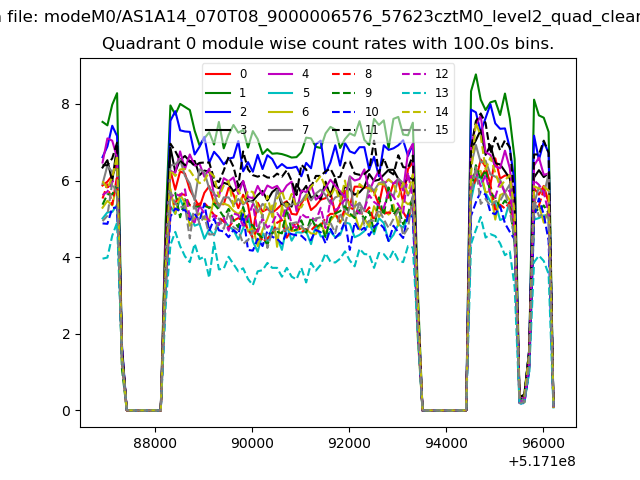 |
 |
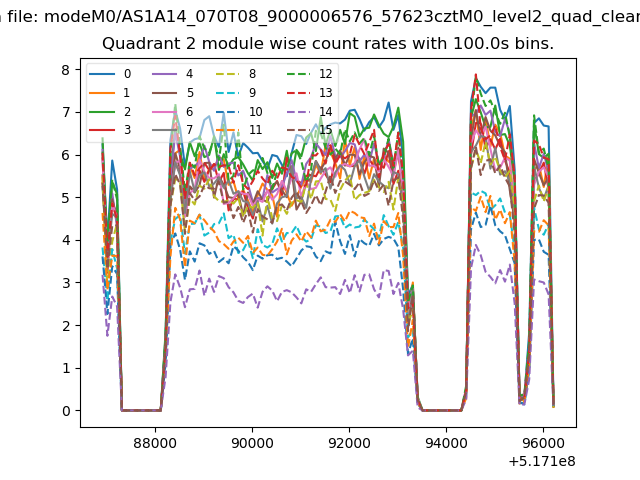
| Module-wise count rates for Quadrant B Data is divided into 100 sec bins |
 |
 |
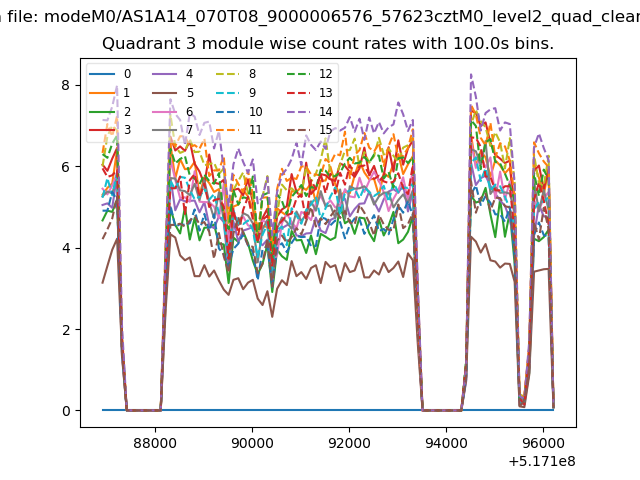
| Module-wise count rates for Quadrant C Data is divided into 100 sec bins |
 |
 |
| Module-wise count rates for Quadrant D Data is divided into 100 sec bins |
 |
 |
| Parameter | Plot |
|---|---|
| CZT HV Monitor | 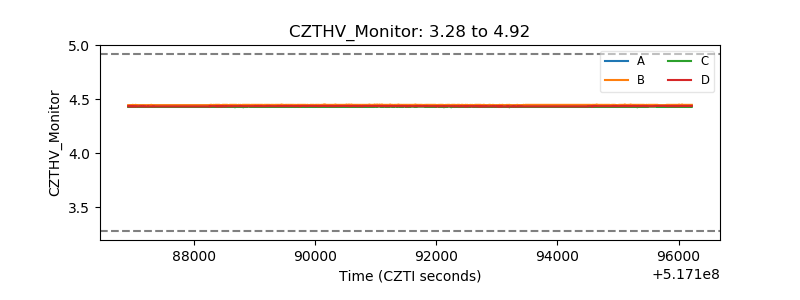 |
| D_VDD | 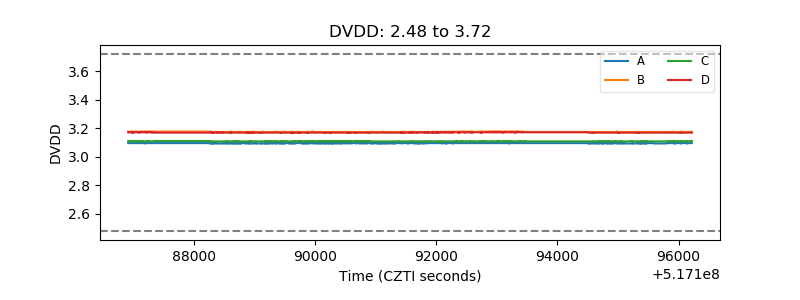 |
| Temperature 1 | 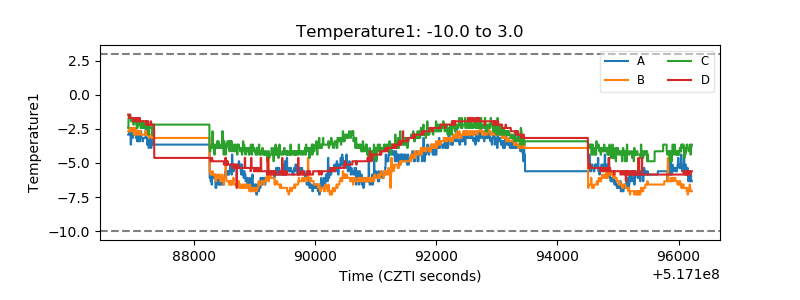 |
| Veto HV Monitor | 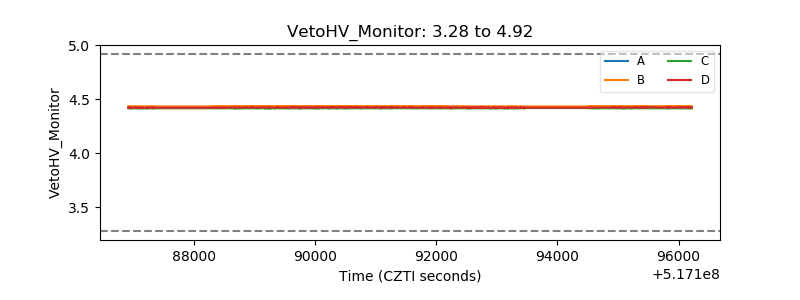 |
| Veto LLD | 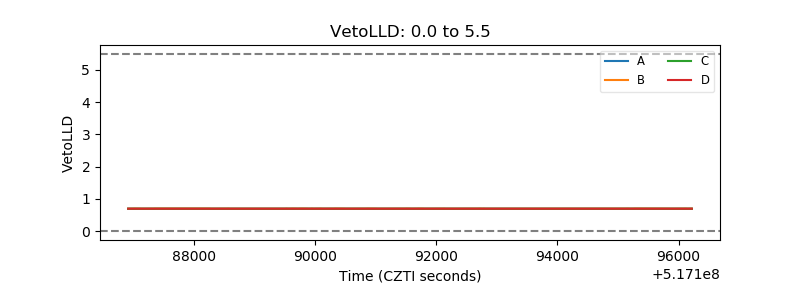 |
| Alpha Counter | 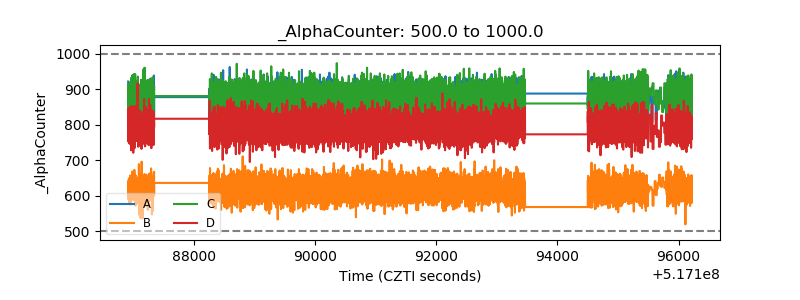 |
| _CPM_Rate | 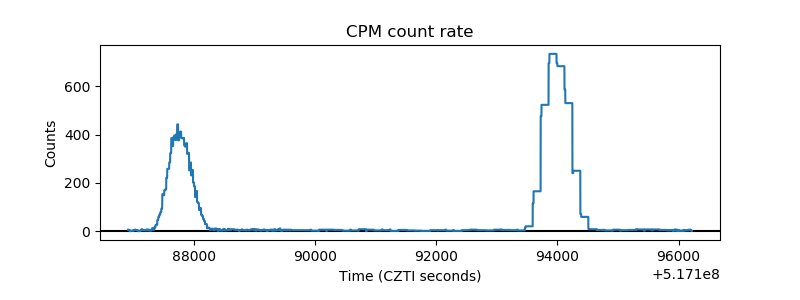 |
| CZT Counter | 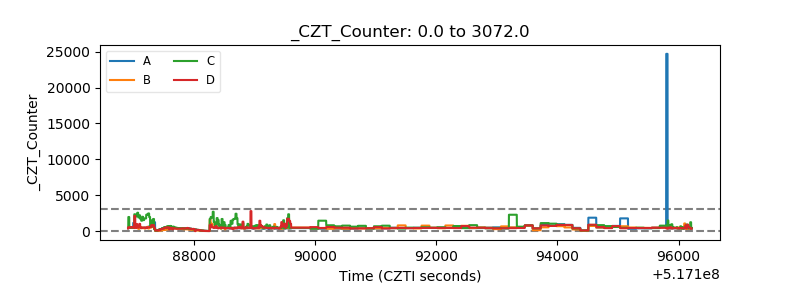 |
| +2.5 Volts monitor | 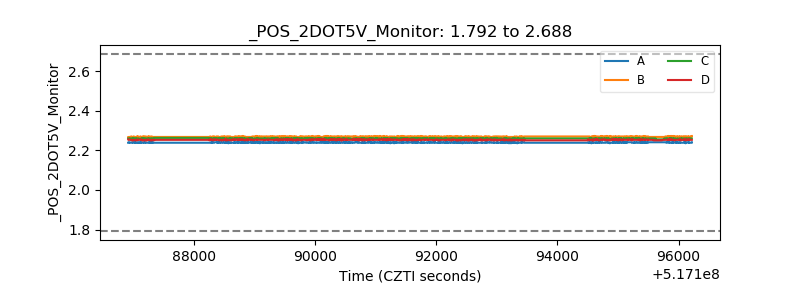 |
| +5 Volts monitor | 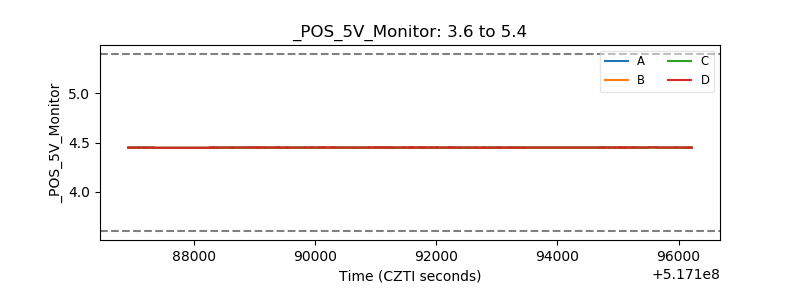 |
| _ROLL_ROT | 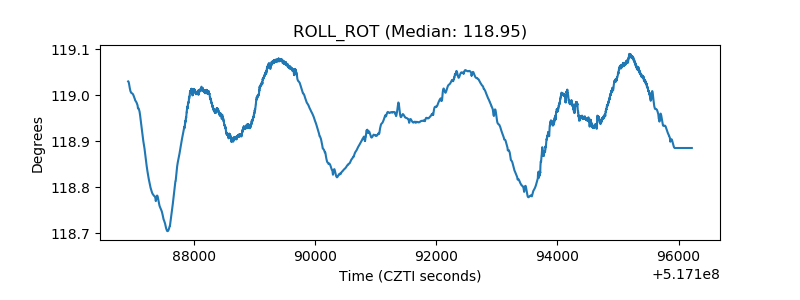 |
| _Roll_DEC | 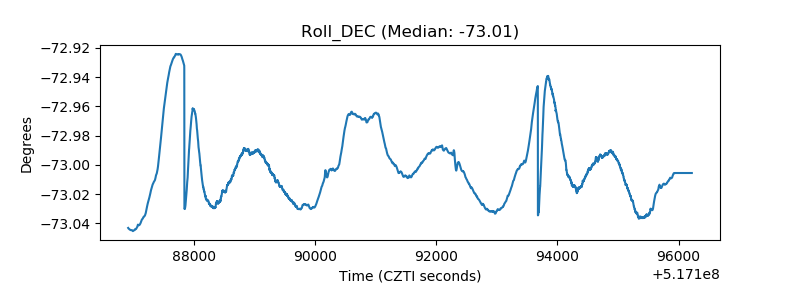 |
| _Roll_RA | 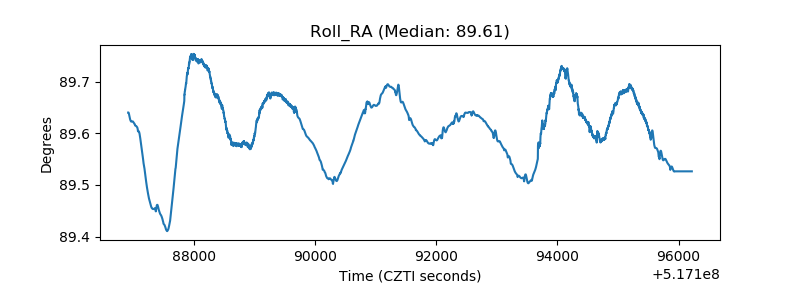 |
| Veto Counter | 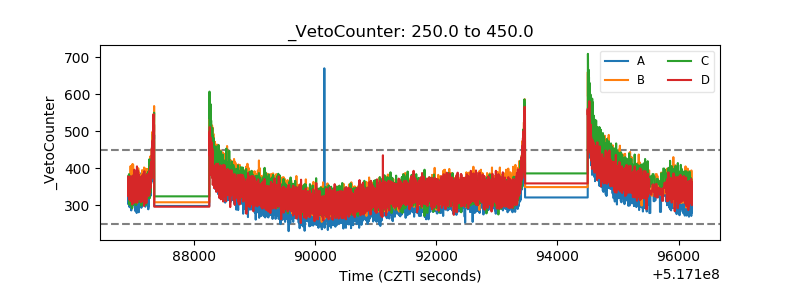 |