| Param | Original file | Final file |
|---|---|---|
| Filename | modeM0/AS1A14_070T08_9000006576_57624cztM0_level2.fits | modeM0/AS1A14_070T08_9000006576_57624cztM0_level2_quad_clean.evt |
| Size (bytes) | 497,494,080 | 89,562,240 |
| Size | 474.4 MB | 85.4 MB |
| Events in quadrant A | 3,295,131 | 597,113 |
| Events in quadrant B | 3,273,478 | 637,623 |
| Events in quadrant C | 5,023,882 | 536,227 |
| Events in quadrant D | 6,301,305 | 472,337 |
| Mode M0 | |||
|---|---|---|---|
| Quadrant | BADHDUFLAG | Total packets | Discarded packets |
| A | 0 | 14473 | 2 |
| B | 0 | 14459 | 2 |
| C | 0 | 19592 | 2 |
| D | 0 | 23396 | 2 |
| Mode M9 | |||
|---|---|---|---|
| Quadrant | BADHDUFLAG | Total packets | Discarded packets |
| A | 0 | 21 | 0 |
| B | 0 | 21 | 0 |
| C | 0 | 21 | 0 |
| D | 0 | 21 | 0 |
| Mode SS | |||
|---|---|---|---|
| Quadrant | BADHDUFLAG | Total packets | Discarded packets |
| A | 0 | 140 | 0 |
| B | 0 | 140 | 0 |
| C | 0 | 140 | 0 |
| D | 0 | 140 | 0 |
| Quadrant | Total seconds | Saturated seconds | Saturation percentage |
|---|---|---|---|
| A | 6715 | 85 | 1.265823% |
| B | 6716 | 107 | 1.593210% |
| C | 6716 | 544 | 8.100060% |
| D | 6716 | 1004 | 14.949375% |
Noise dominated data is calculated using 1-second bins in cleaned event files. If a bin has >2000 counts, and if more than 50% of those come from <1% of pixels, then it is considered to be noise-dominated and hence unusable.
| Quadrant | # 1 sec bins | Bins with >0 counts | Bins with >2000 counts | High rate bins dominated by noise | Noise dominated (total time) | Noise dominated (detector-on time) | Marked lightcurve |
|---|---|---|---|---|---|---|---|
| A | 9157 | 6999 | 30 | 30 | 0.33% | 0.43% | 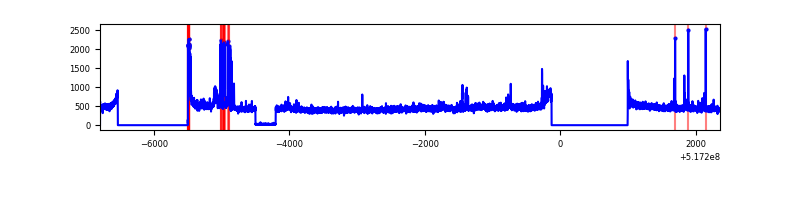 |
| B | 9158 | 7000 | 18 | 18 | 0.20% | 0.26% | 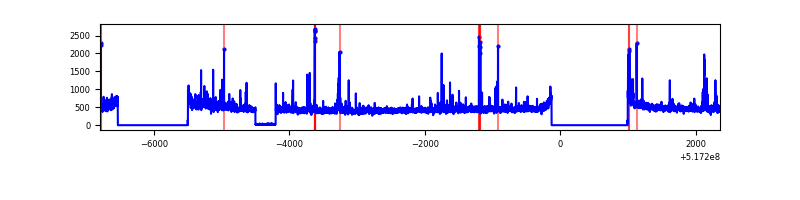 |
| C | 9158 | 7000 | 430 | 430 | 4.70% | 6.14% | 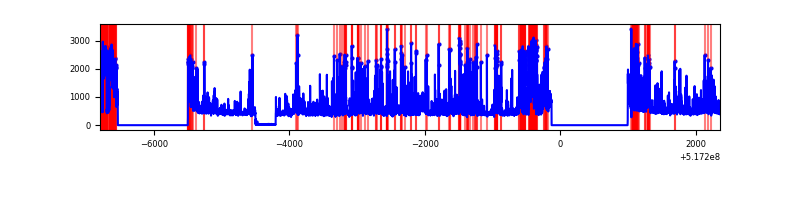 |
| D | 9158 | 7000 | 946 | 946 | 10.33% | 13.51% | 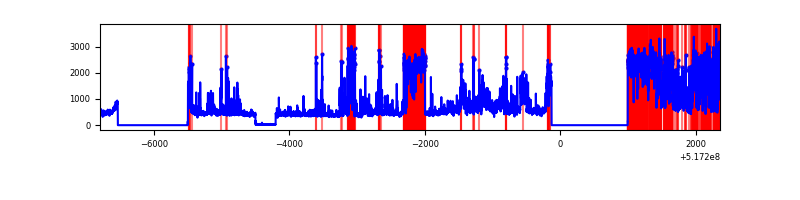 |
Top three noisy pixels from each quadrant. If the there are fewer than three noisy pixels in the level2.evt file, extra rows are filled as -1
| Pixel properties | Quadrant properties | ||||||
|---|---|---|---|---|---|---|---|
| Quadrant | DetID | PixID | Counts | Sigma | Mean | Median | Sigma |
| A | 3 | 14 | 346599 | 1868.94 | 747 | 729 | 185.1 |
| A | 7 | 160 | 35300 | 186.81 | 747 | 729 | 185.1 |
| A | 4 | 249 | 17962 | 93.12 | 747 | 729 | 185.1 |
| B | 4 | 80 | 63594 | 404.68 | 739 | 712 | 155.4 |
| B | 10 | 247 | 49800 | 315.91 | 739 | 712 | 155.4 |
| B | 4 | 201 | 48244 | 305.89 | 739 | 712 | 155.4 |
| C | 15 | 224 | 1489530 | 7776.7 | 706 | 700 | 191.4 |
| C | 12 | 2 | 675934 | 3526.99 | 706 | 700 | 191.4 |
| C | 14 | 254 | 19747 | 99.49 | 706 | 700 | 191.4 |
| D | 8 | 160 | 1081975 | 5588.79 | 676 | 643 | 193.5 |
| D | 2 | 62 | 1067372 | 5513.32 | 676 | 643 | 193.5 |
| D | 15 | 142 | 931061 | 4808.81 | 676 | 643 | 193.5 |
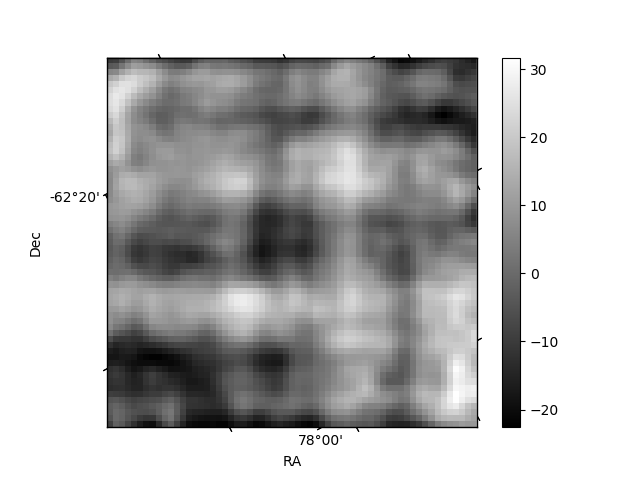
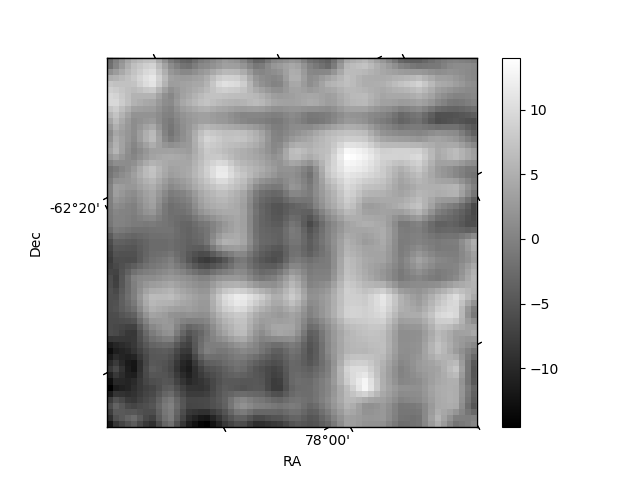
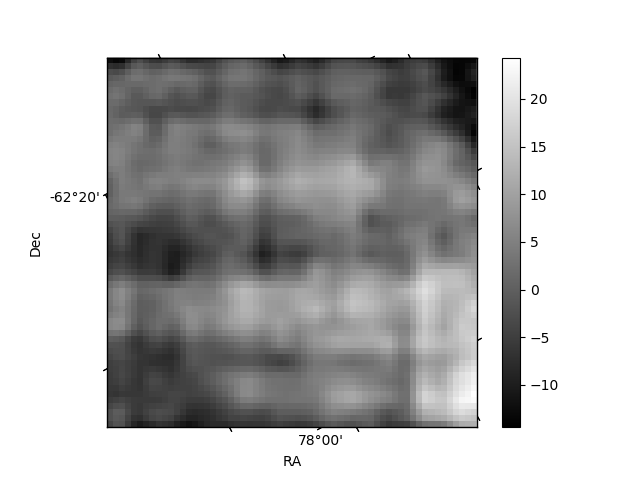
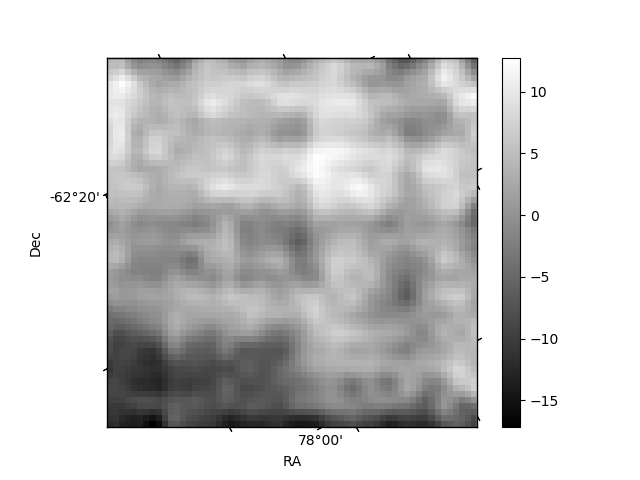
Histogram calculated using DETX and DETY for each event in the final _common_clean file
| Quadrant A | 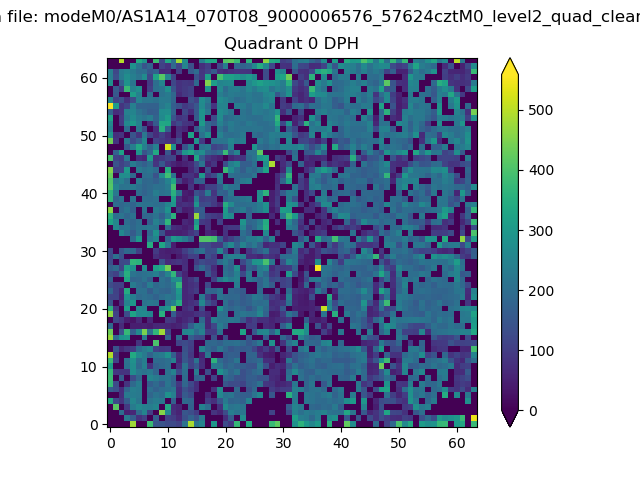 |
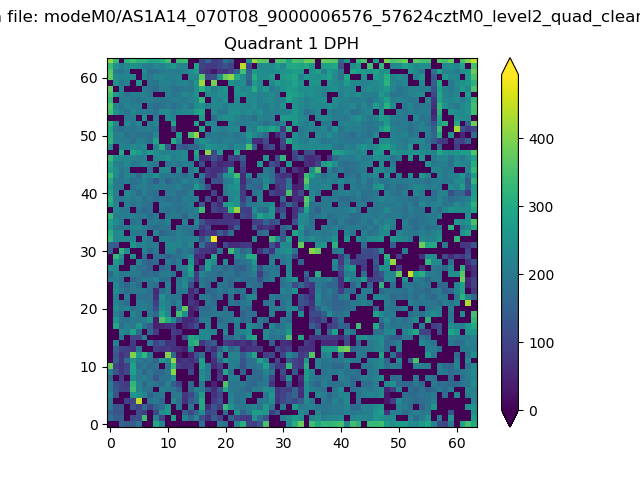 |
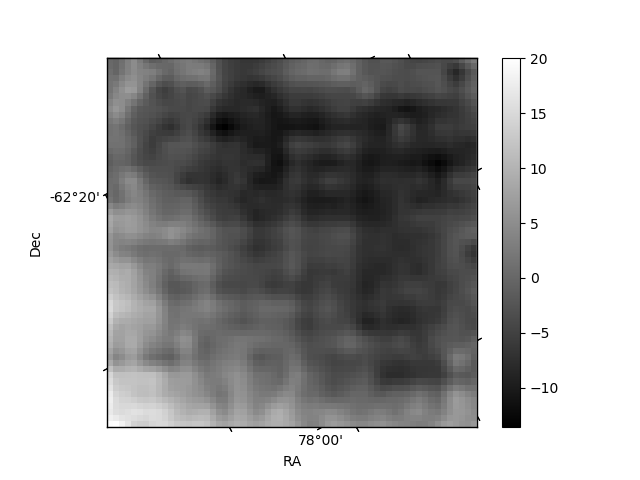
Quadrant B |
|---|---|---|---|
| Quadrant D | 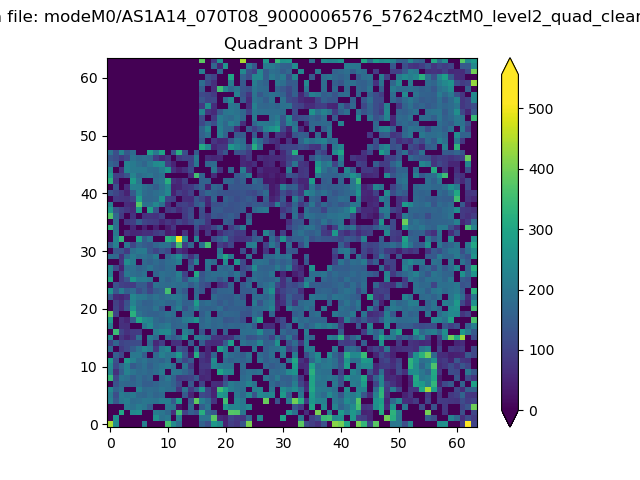 |
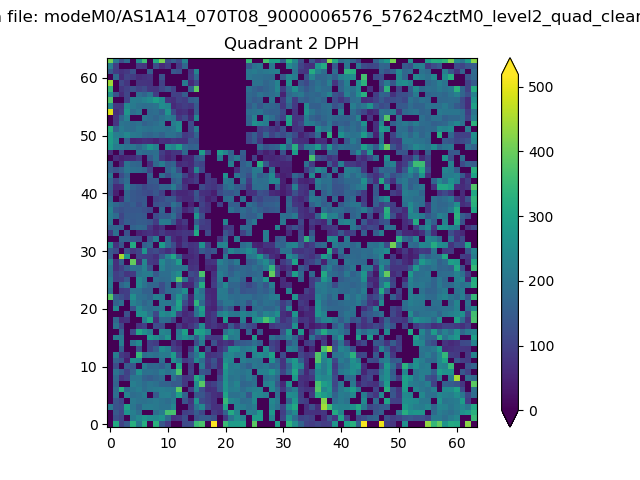 |
Quadrant C |
| Plot type | Count rate plots | Images |
|---|---|---|
| Comparison with Poisson distribution Blue bars denote a histogram of data divided into 1 sec bins. Red curve is a Poisson curve with rate = median count rate of data. |
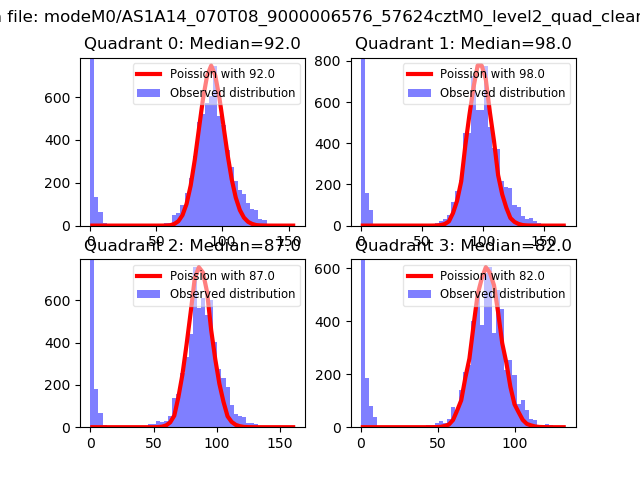 |
 |
| Quadrant-wise count rates Data is divided into 100 sec bins |
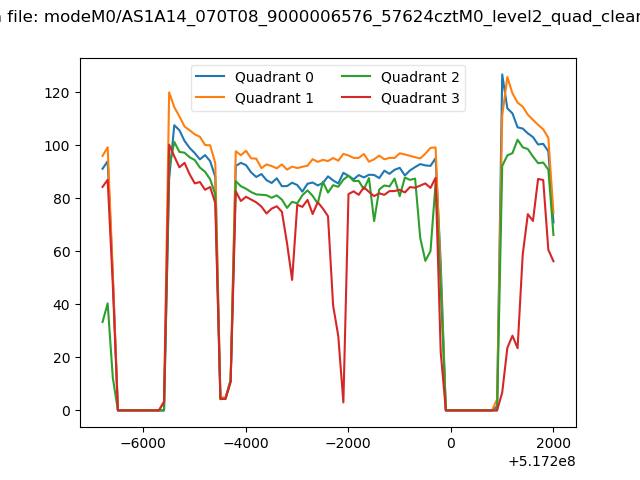 |
|
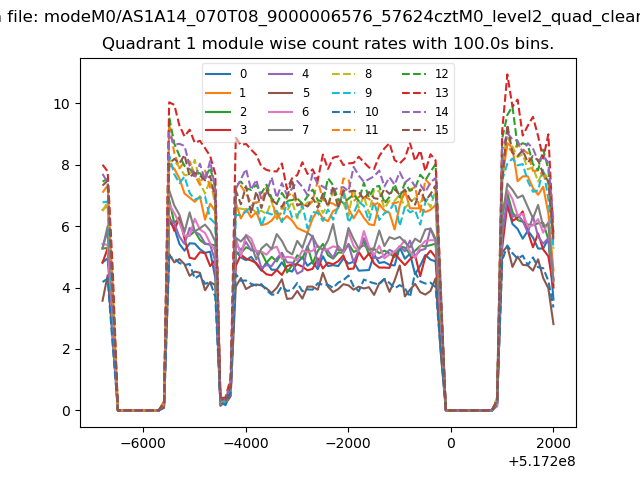
| Module-wise count rates for Quadrant A Data is divided into 100 sec bins |
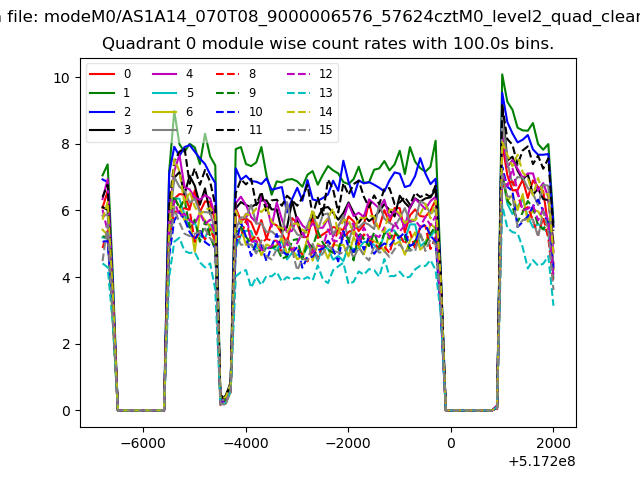 |
 |
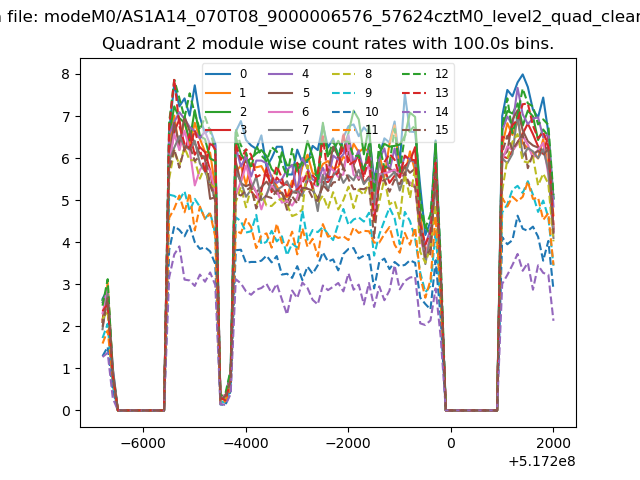
| Module-wise count rates for Quadrant B Data is divided into 100 sec bins |
 |
 |
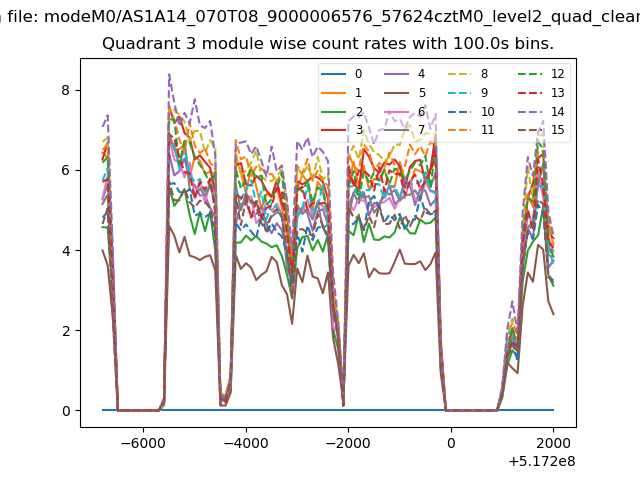
| Module-wise count rates for Quadrant C Data is divided into 100 sec bins |
 |
 |
| Module-wise count rates for Quadrant D Data is divided into 100 sec bins |
 |
 |
| Parameter | Plot |
|---|---|
| CZT HV Monitor | 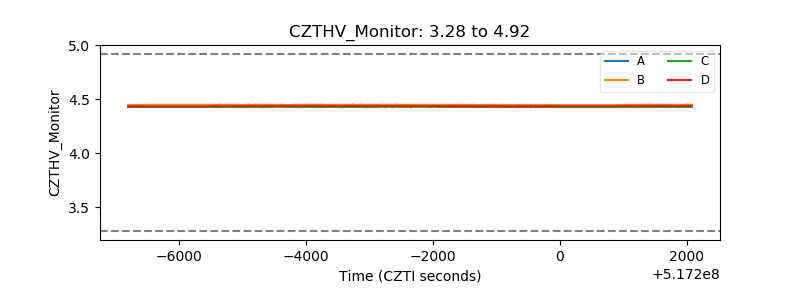 |
| D_VDD | 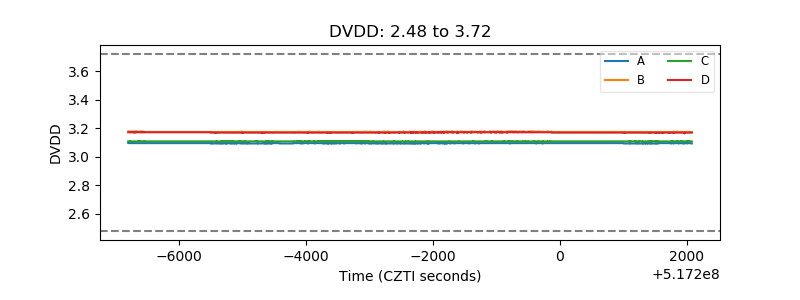 |
| Temperature 1 | 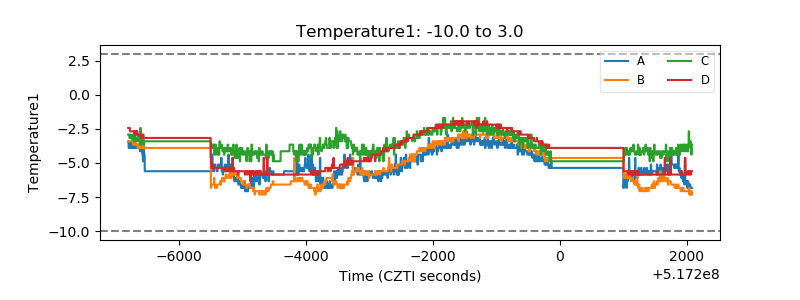 |
| Veto HV Monitor | 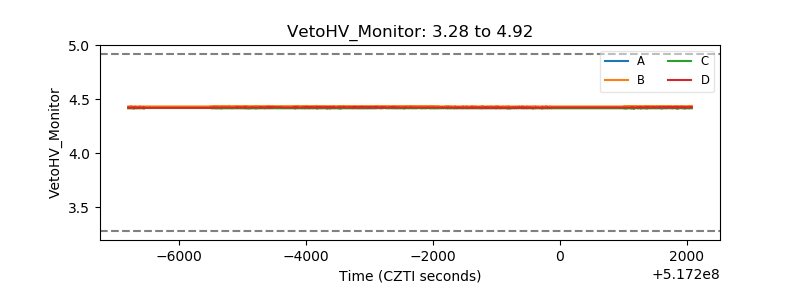 |
| Veto LLD | 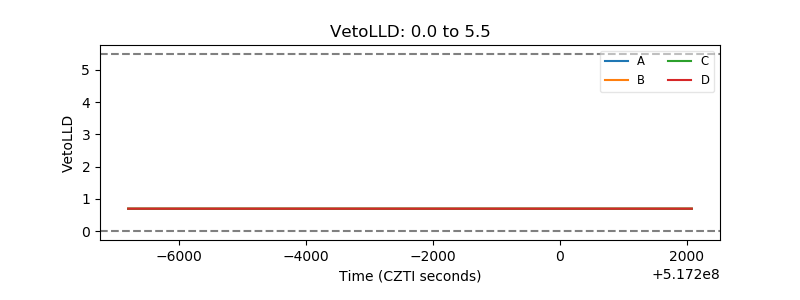 |
| Alpha Counter | 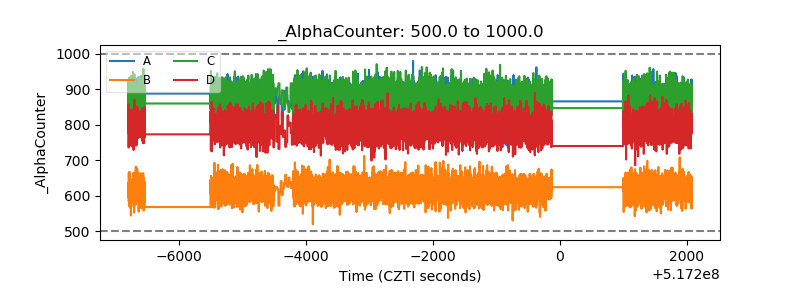 |
| _CPM_Rate | 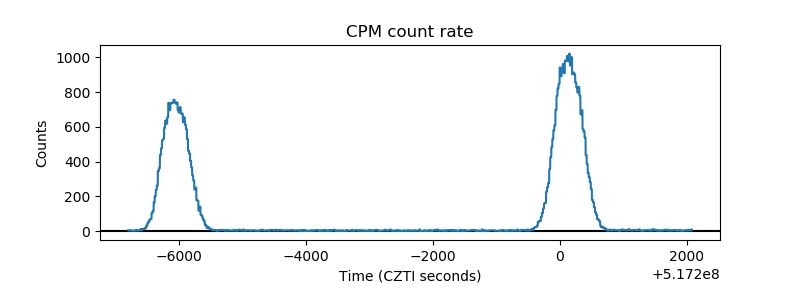 |
| CZT Counter | 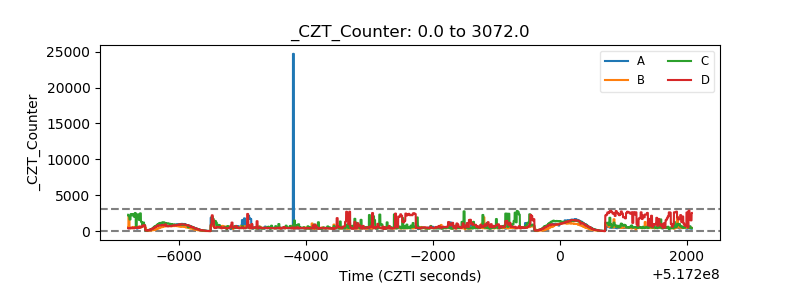 |
| +2.5 Volts monitor | 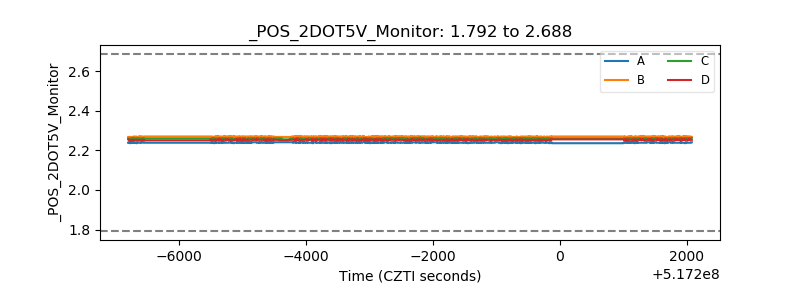 |
| +5 Volts monitor | 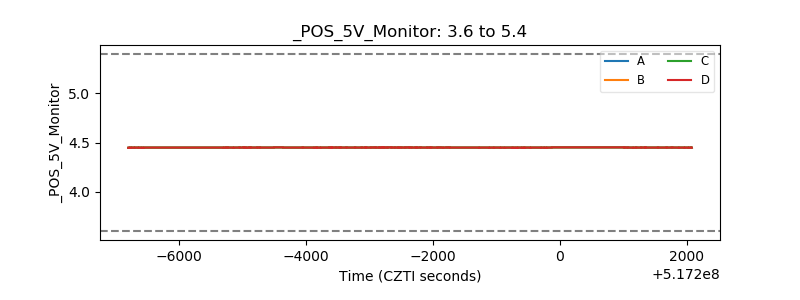 |
| _ROLL_ROT | 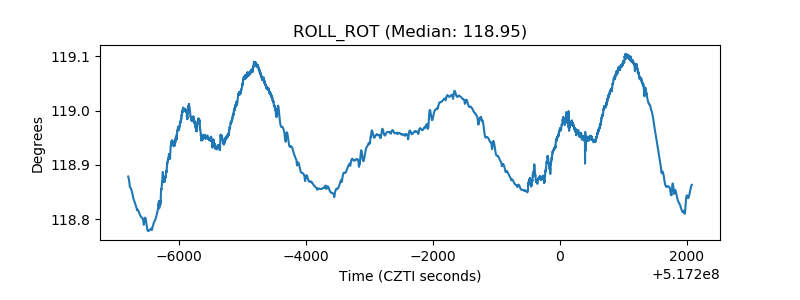 |
| _Roll_DEC | 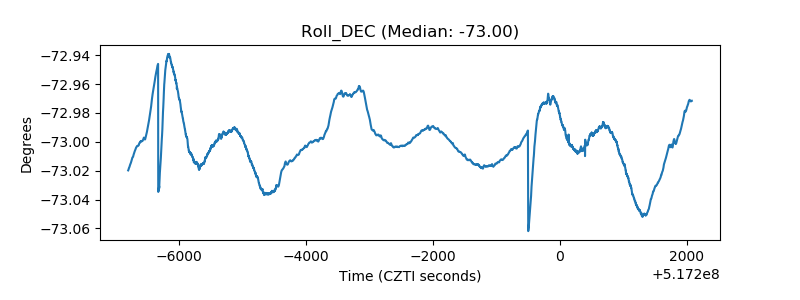 |
| _Roll_RA | 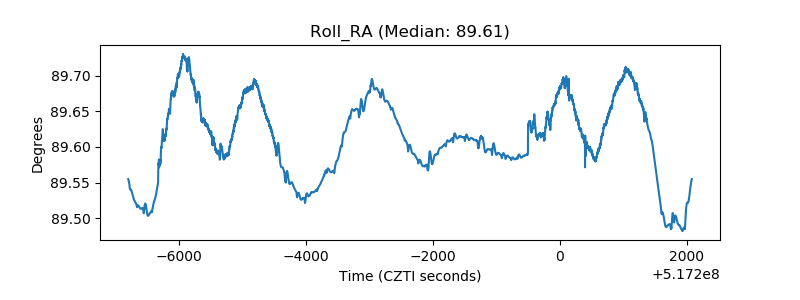 |
| Veto Counter | 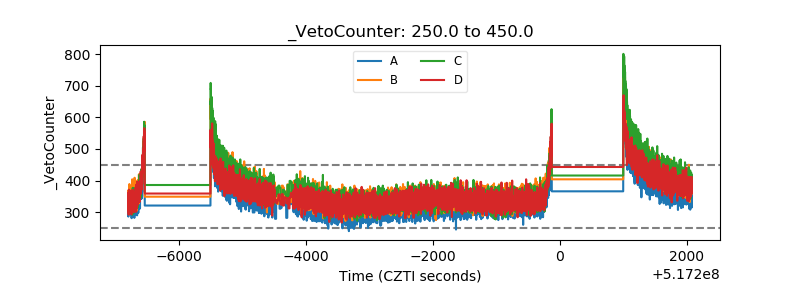 |