| Param | Original file | Final file |
|---|---|---|
| Filename | modeM0/AS1A14_070T08_9000006576_57625cztM0_level2.fits | modeM0/AS1A14_070T08_9000006576_57625cztM0_level2_quad_clean.evt |
| Size (bytes) | 534,479,040 | 93,116,160 |
| Size | 509.7 MB | 88.8 MB |
| Events in quadrant A | 3,142,422 | 651,102 |
| Events in quadrant B | 2,979,693 | 704,509 |
| Events in quadrant C | 4,318,320 | 611,041 |
| Events in quadrant D | 8,853,971 | 412,537 |
| Mode M0 | |||
|---|---|---|---|
| Quadrant | BADHDUFLAG | Total packets | Discarded packets |
| A | 0 | 13764 | 1 |
| B | 0 | 13192 | 1 |
| C | 0 | 17220 | 1 |
| D | 0 | 30701 | 1 |
| Mode M9 | |||
|---|---|---|---|
| Quadrant | BADHDUFLAG | Total packets | Discarded packets |
| A | 0 | 12 | 0 |
| B | 0 | 12 | 0 |
| C | 0 | 12 | 0 |
| D | 0 | 12 | 0 |
| Mode SS | |||
|---|---|---|---|
| Quadrant | BADHDUFLAG | Total packets | Discarded packets |
| A | 0 | 128 | 0 |
| B | 0 | 128 | 0 |
| C | 0 | 128 | 0 |
| D | 0 | 128 | 0 |
| Quadrant | Total seconds | Saturated seconds | Saturation percentage |
|---|---|---|---|
| A | 6310 | 60 | 0.950872% |
| B | 6310 | 44 | 0.697306% |
| C | 6310 | 276 | 4.374010% |
| D | 6311 | 2093 | 33.164316% |
Noise dominated data is calculated using 1-second bins in cleaned event files. If a bin has >2000 counts, and if more than 50% of those come from <1% of pixels, then it is considered to be noise-dominated and hence unusable.
| Quadrant | # 1 sec bins | Bins with >0 counts | Bins with >2000 counts | High rate bins dominated by noise | Noise dominated (total time) | Noise dominated (detector-on time) | Marked lightcurve |
|---|---|---|---|---|---|---|---|
| A | 7510 | 6311 | 30 | 30 | 0.40% | 0.48% | 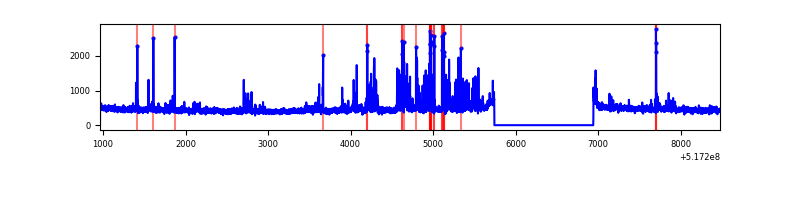 |
| B | 7510 | 6311 | 4 | 4 | 0.05% | 0.06% | 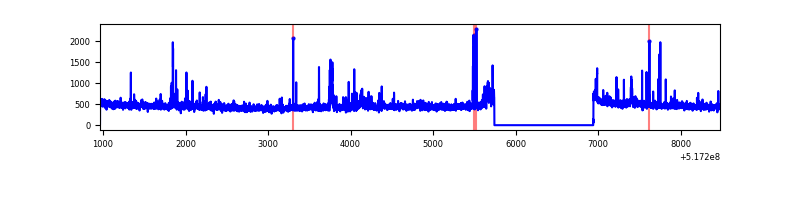 |
| C | 7510 | 6311 | 226 | 226 | 3.01% | 3.58% | 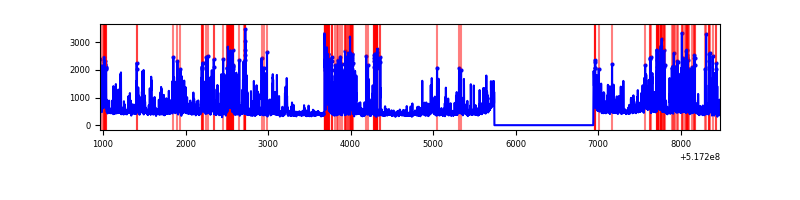 |
| D | 7511 | 6312 | 2074 | 2074 | 27.61% | 32.86% | 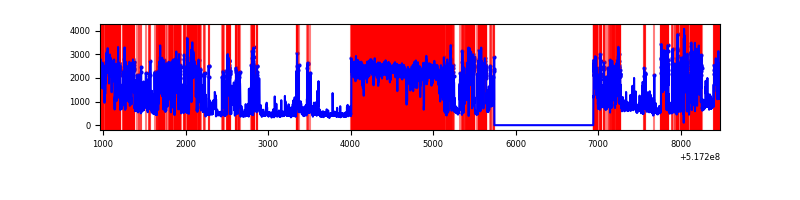 |
Top three noisy pixels from each quadrant. If the there are fewer than three noisy pixels in the level2.evt file, extra rows are filled as -1
| Pixel properties | Quadrant properties | ||||||
|---|---|---|---|---|---|---|---|
| Quadrant | DetID | PixID | Counts | Sigma | Mean | Median | Sigma |
| A | 4 | 249 | 359246 | 2062.59 | 703 | 687 | 173.8 |
| A | 3 | 14 | 45533 | 257.97 | 703 | 687 | 173.8 |
| A | 7 | 160 | 14344 | 78.56 | 703 | 687 | 173.8 |
| B | 0 | 213 | 49643 | 335.44 | 698 | 673 | 146.0 |
| B | 9 | 251 | 42073 | 283.58 | 698 | 673 | 146.0 |
| B | 7 | 252 | 23732 | 157.95 | 698 | 673 | 146.0 |
| C | 15 | 224 | 1341687 | 7276.66 | 681 | 675 | 184.3 |
| C | 12 | 2 | 218914 | 1184.22 | 681 | 675 | 184.3 |
| C | 14 | 254 | 35077 | 186.67 | 681 | 675 | 184.3 |
| D | 2 | 62 | 3262200 | 19115.58 | 602 | 573 | 170.6 |
| D | 15 | 142 | 2322624 | 13608.96 | 602 | 573 | 170.6 |
| D | 8 | 160 | 412399 | 2413.61 | 602 | 573 | 170.6 |
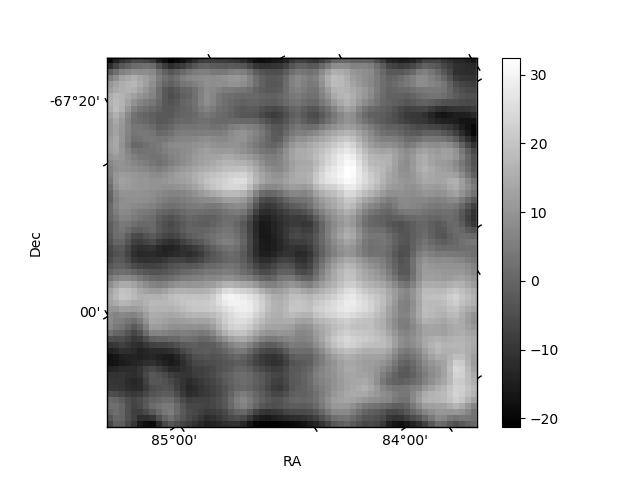
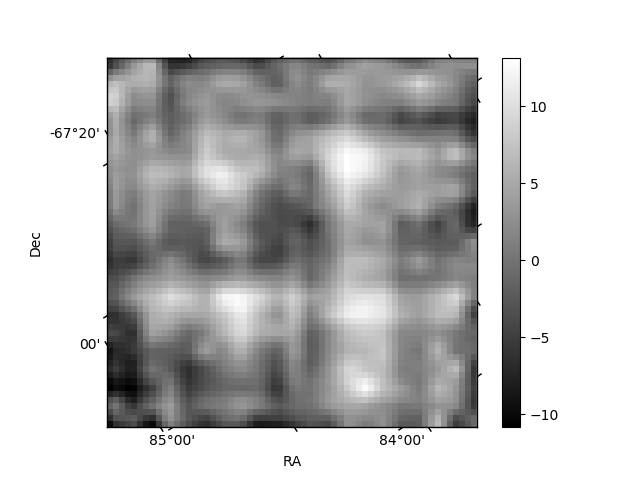
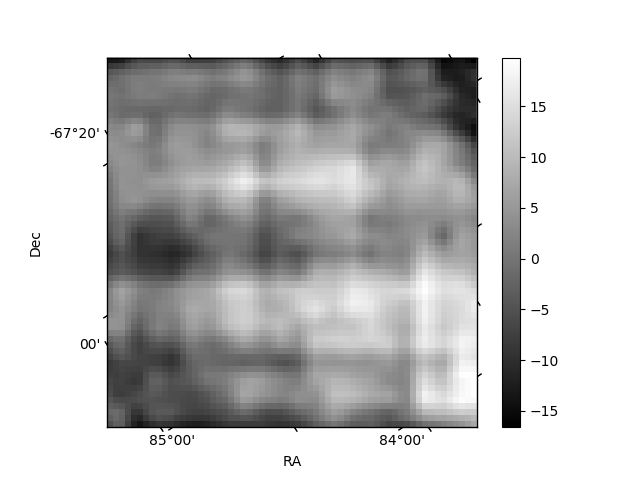
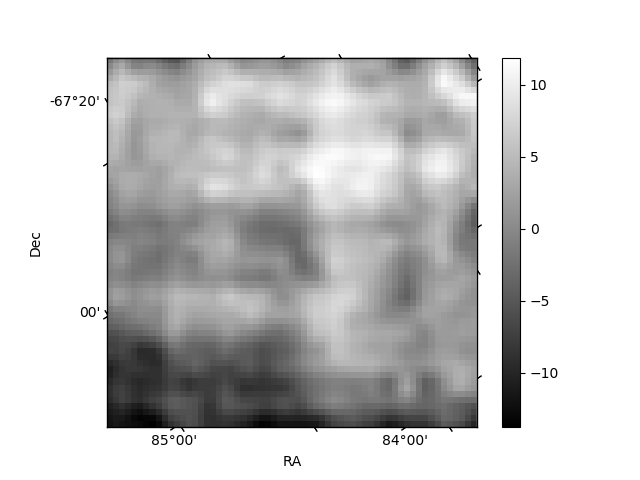
Histogram calculated using DETX and DETY for each event in the final _common_clean file
| Quadrant A | 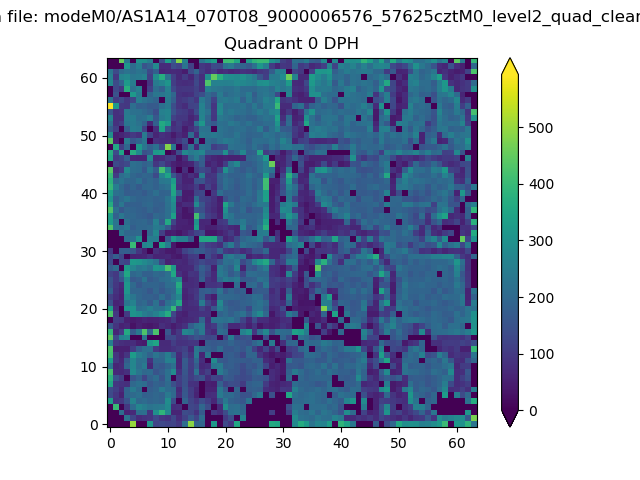 |
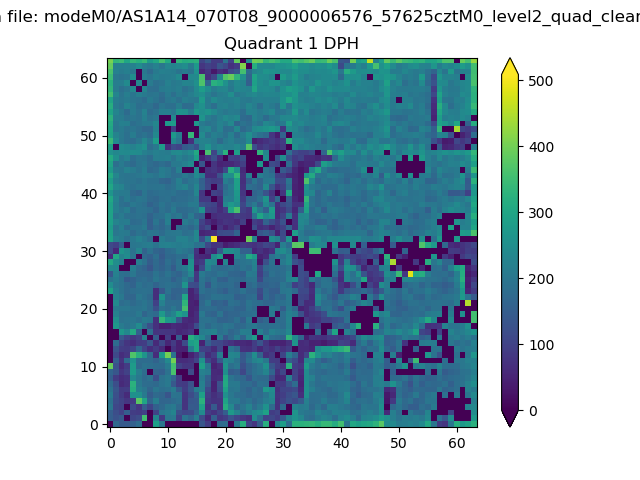 |
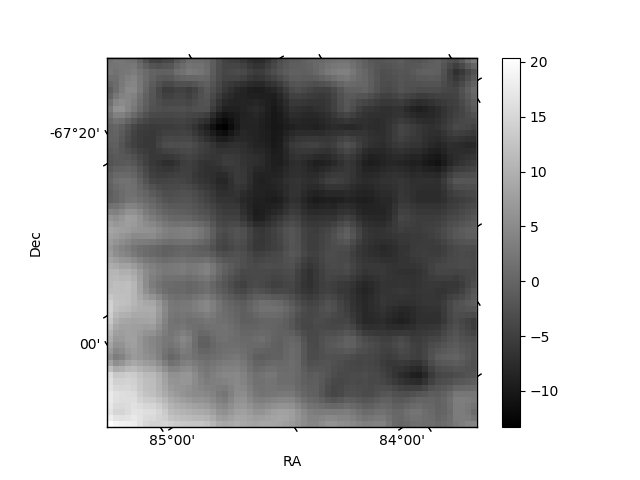
Quadrant B |
|---|---|---|---|
| Quadrant D | 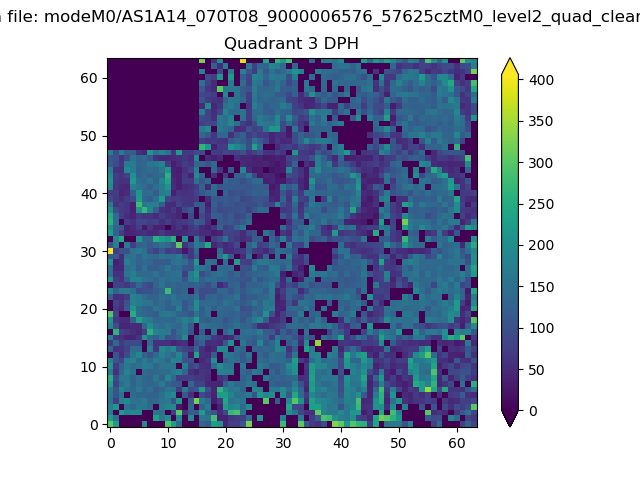 |
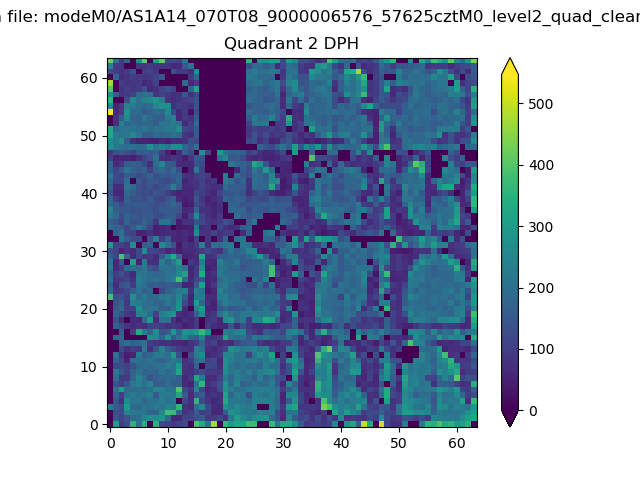 |
Quadrant C |
| Plot type | Count rate plots | Images |
|---|---|---|
| Comparison with Poisson distribution Blue bars denote a histogram of data divided into 1 sec bins. Red curve is a Poisson curve with rate = median count rate of data. |
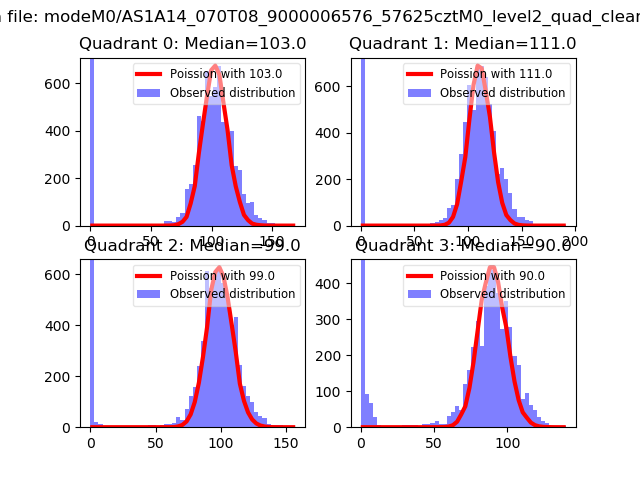 |
 |
| Quadrant-wise count rates Data is divided into 100 sec bins |
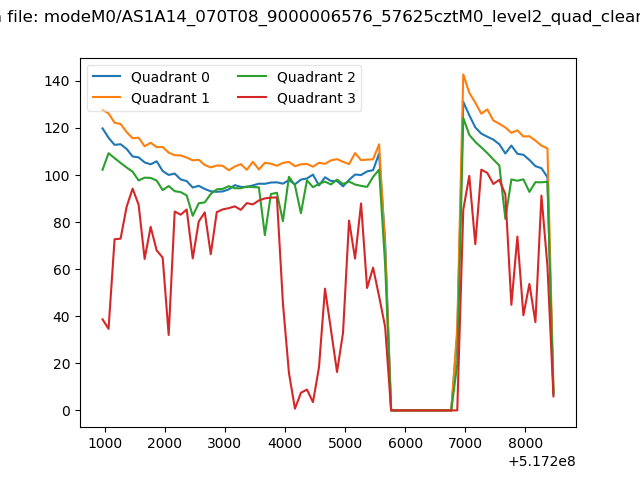 |
|
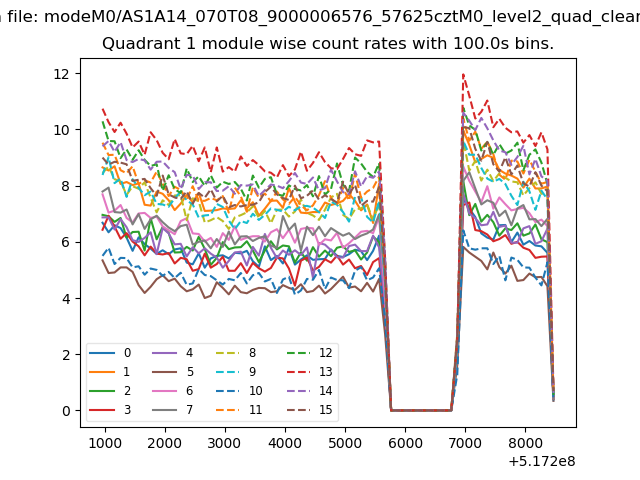
| Module-wise count rates for Quadrant A Data is divided into 100 sec bins |
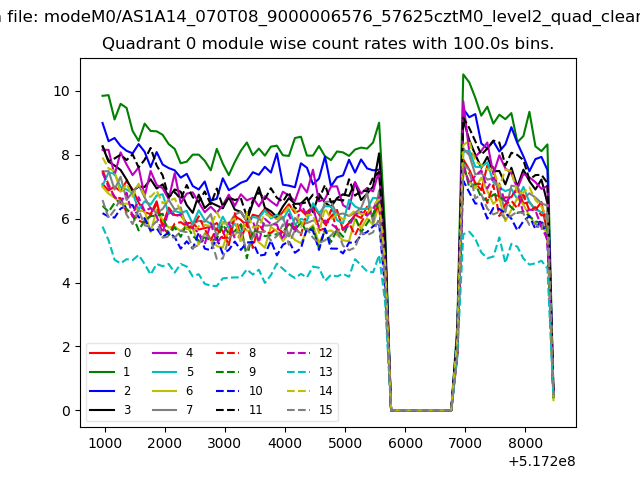 |
 |
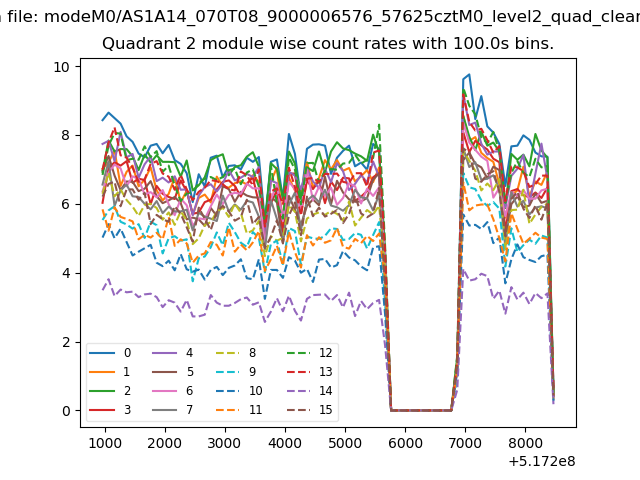
| Module-wise count rates for Quadrant B Data is divided into 100 sec bins |
 |
 |
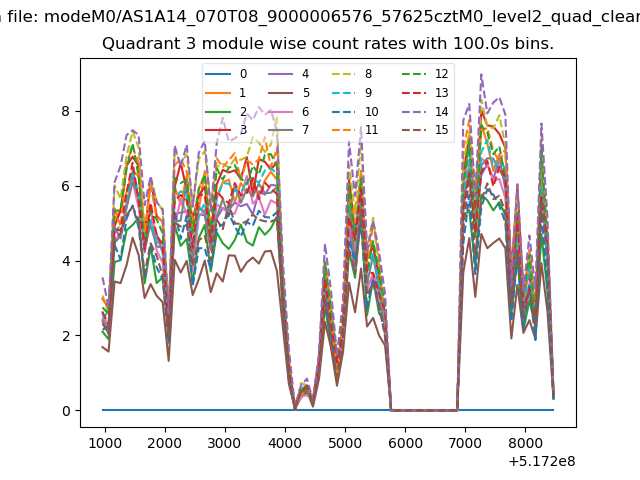
| Module-wise count rates for Quadrant C Data is divided into 100 sec bins |
 |
 |
| Module-wise count rates for Quadrant D Data is divided into 100 sec bins |
 |
 |
| Parameter | Plot |
|---|---|
| CZT HV Monitor | 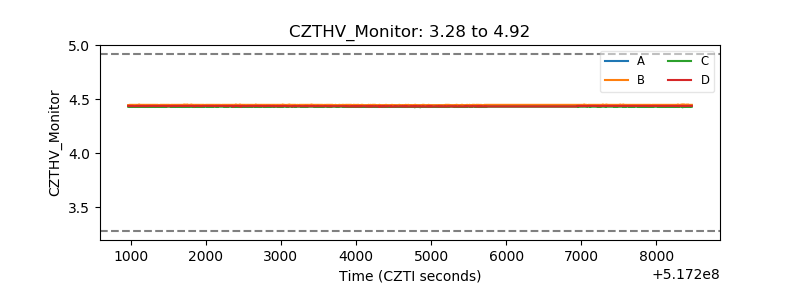 |
| D_VDD | 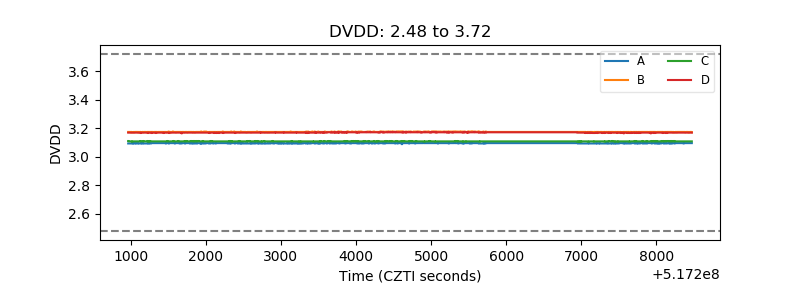 |
| Temperature 1 | 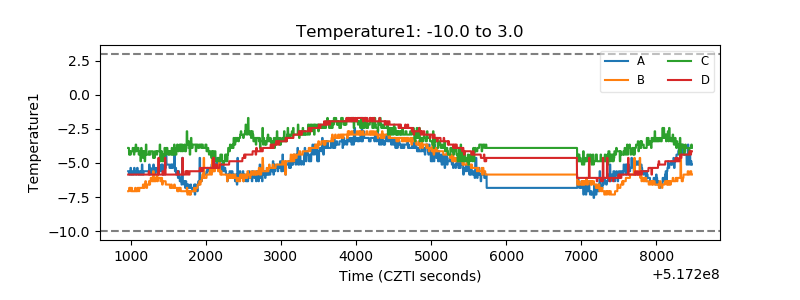 |
| Veto HV Monitor | 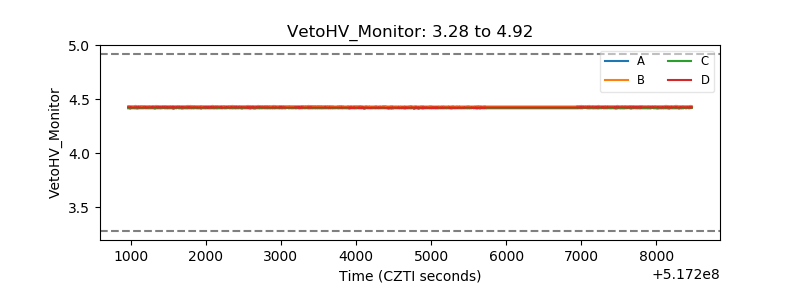 |
| Veto LLD | 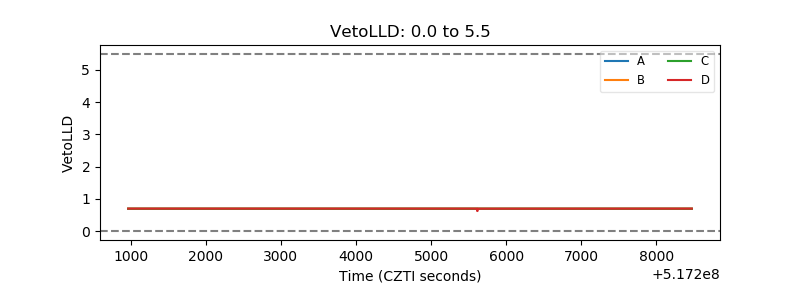 |
| Alpha Counter | 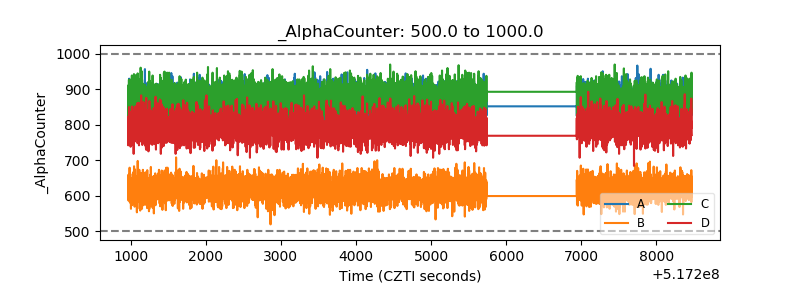 |
| _CPM_Rate | 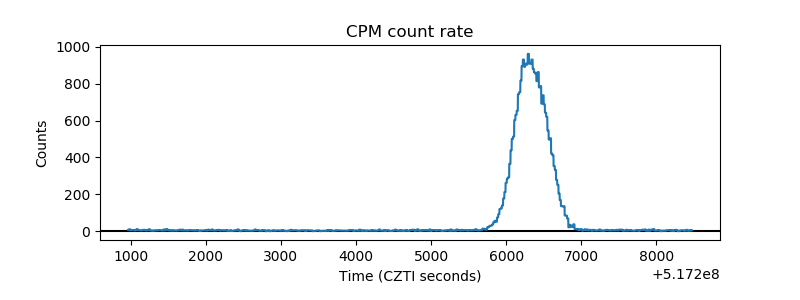 |
| CZT Counter | 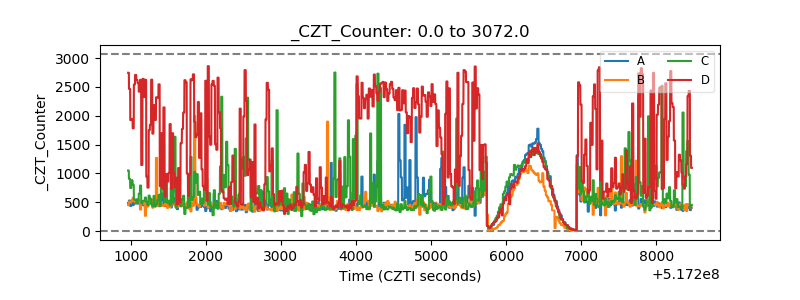 |
| +2.5 Volts monitor | 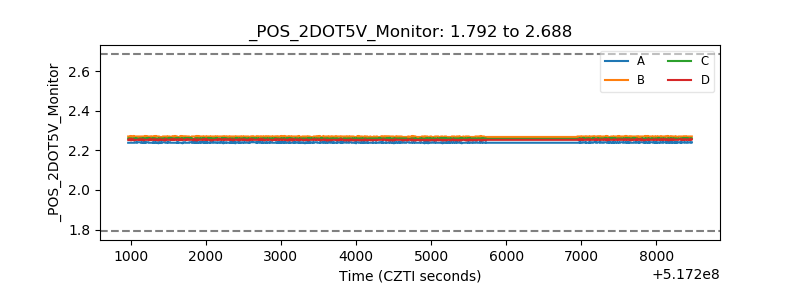 |
| +5 Volts monitor |  |
| _ROLL_ROT | 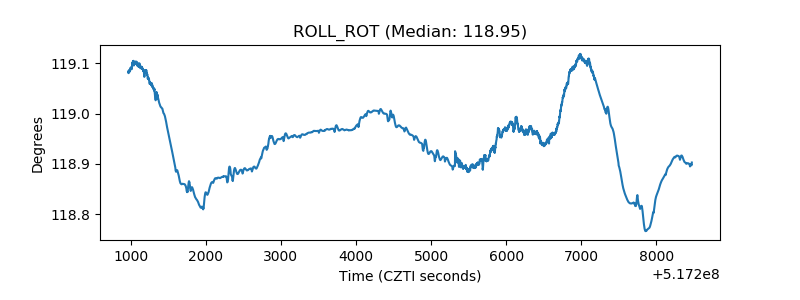 |
| _Roll_DEC | 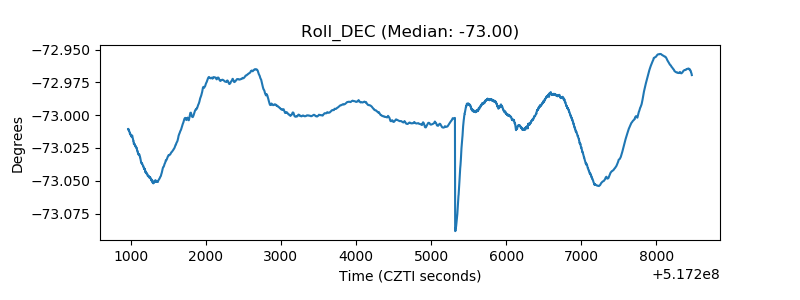 |
| _Roll_RA | 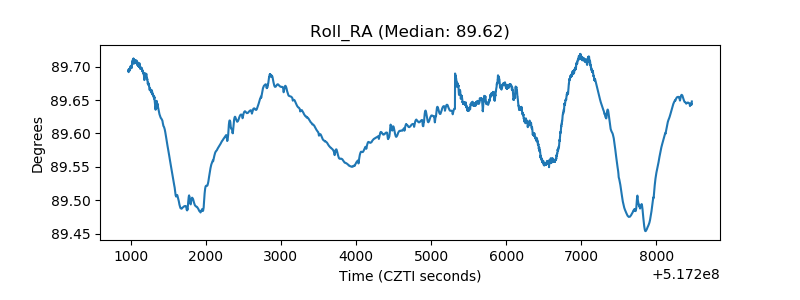 |
| Veto Counter | 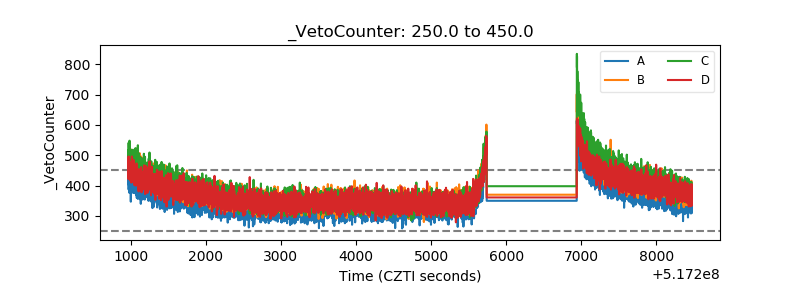 |