| Param | Original file | Final file |
|---|---|---|
| Filename | modeM0/AS1A14_070T08_9000006576_57626cztM0_level2.fits | modeM0/AS1A14_070T08_9000006576_57626cztM0_level2_quad_clean.evt |
| Size (bytes) | 432,020,160 | 88,433,280 |
| Size | 412.0 MB | 84.3 MB |
| Events in quadrant A | 3,155,641 | 592,041 |
| Events in quadrant B | 2,741,001 | 640,441 |
| Events in quadrant C | 3,526,011 | 560,652 |
| Events in quadrant D | 6,120,824 | 481,190 |
| Mode M0 | |||
|---|---|---|---|
| Quadrant | BADHDUFLAG | Total packets | Discarded packets |
| A | 0 | 13384 | 1 |
| B | 0 | 12129 | 1 |
| C | 0 | 14654 | 1 |
| D | 0 | 22189 | 1 |
| Mode M9 | |||
|---|---|---|---|
| Quadrant | BADHDUFLAG | Total packets | Discarded packets |
| A | 0 | 11 | 0 |
| B | 0 | 11 | 0 |
| C | 0 | 11 | 0 |
| D | 0 | 11 | 0 |
| Mode SS | |||
|---|---|---|---|
| Quadrant | BADHDUFLAG | Total packets | Discarded packets |
| A | 0 | 118 | 0 |
| B | 0 | 118 | 0 |
| C | 0 | 118 | 0 |
| D | 0 | 118 | 0 |
| Quadrant | Total seconds | Saturated seconds | Saturation percentage |
|---|---|---|---|
| A | 5770 | 55 | 0.953206% |
| B | 5771 | 83 | 1.438226% |
| C | 5771 | 202 | 3.500260% |
| D | 5771 | 744 | 12.892046% |
Noise dominated data is calculated using 1-second bins in cleaned event files. If a bin has >2000 counts, and if more than 50% of those come from <1% of pixels, then it is considered to be noise-dominated and hence unusable.
| Quadrant | # 1 sec bins | Bins with >0 counts | Bins with >2000 counts | High rate bins dominated by noise | Noise dominated (total time) | Noise dominated (detector-on time) | Marked lightcurve |
|---|---|---|---|---|---|---|---|
| A | 6945 | 5771 | 17 | 17 | 0.24% | 0.29% | 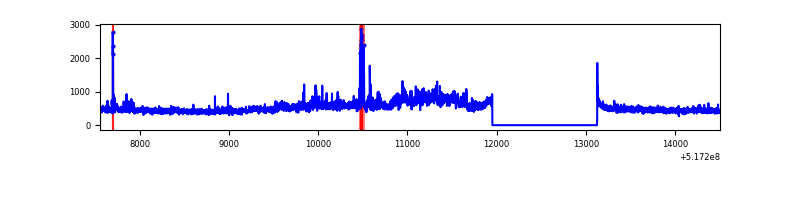 |
| B | 6946 | 5772 | 3 | 3 | 0.04% | 0.05% | 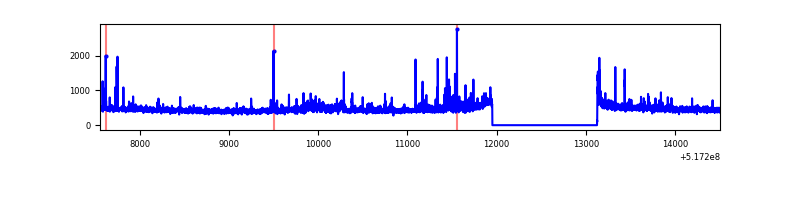 |
| C | 6946 | 5772 | 120 | 120 | 1.73% | 2.08% | 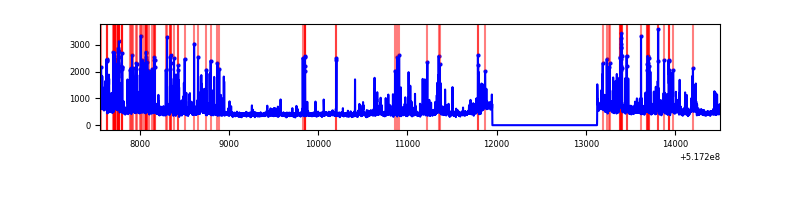 |
| D | 6946 | 5772 | 703 | 703 | 10.12% | 12.18% | 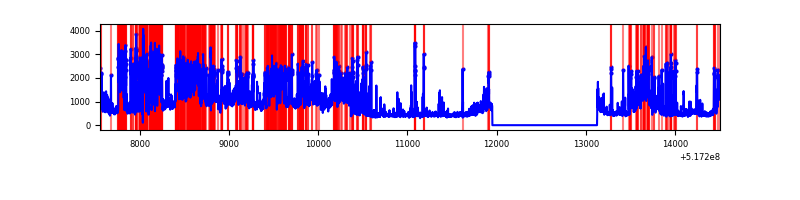 |
Top three noisy pixels from each quadrant. If the there are fewer than three noisy pixels in the level2.evt file, extra rows are filled as -1
| Pixel properties | Quadrant properties | ||||||
|---|---|---|---|---|---|---|---|
| Quadrant | DetID | PixID | Counts | Sigma | Mean | Median | Sigma |
| A | 3 | 14 | 562216 | 3569.65 | 642 | 627 | 157.3 |
| A | 10 | 251 | 57816 | 363.51 | 642 | 627 | 157.3 |
| A | 4 | 249 | 33290 | 207.62 | 642 | 627 | 157.3 |
| B | 7 | 252 | 44062 | 323.7 | 636 | 614 | 134.2 |
| B | 0 | 245 | 30538 | 222.94 | 636 | 614 | 134.2 |
| B | 10 | 247 | 26667 | 194.1 | 636 | 614 | 134.2 |
| C | 15 | 224 | 727320 | 4306.77 | 623 | 617 | 168.7 |
| C | 12 | 2 | 213178 | 1259.73 | 623 | 617 | 168.7 |
| C | 14 | 254 | 73898 | 434.3 | 623 | 617 | 168.7 |
| D | 2 | 62 | 1952860 | 11529.78 | 596 | 569 | 169.3 |
| D | 15 | 142 | 680814 | 4017.37 | 596 | 569 | 169.3 |
| D | 8 | 240 | 614657 | 3626.66 | 596 | 569 | 169.3 |
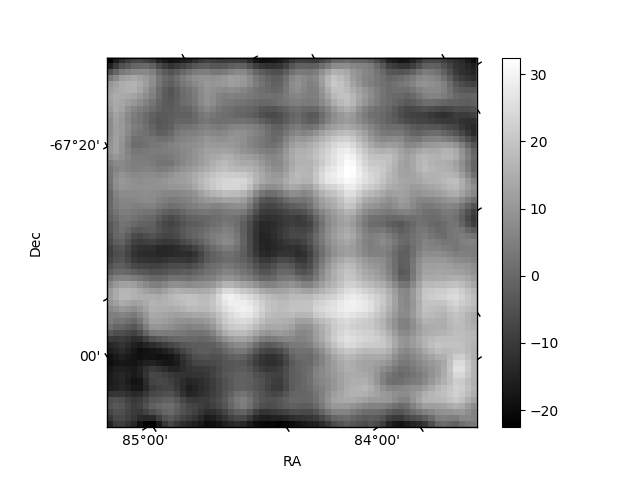
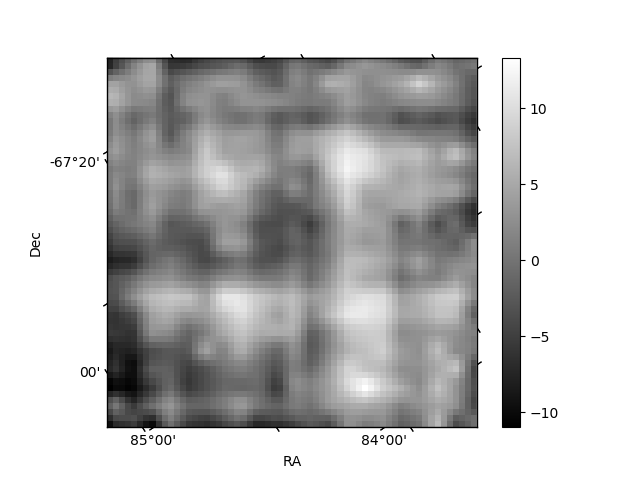
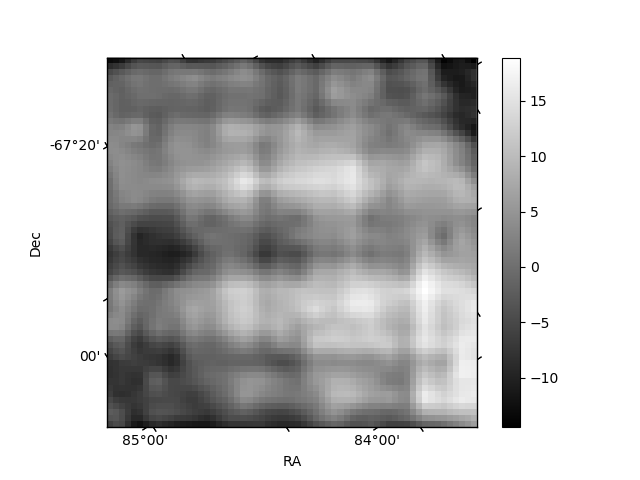
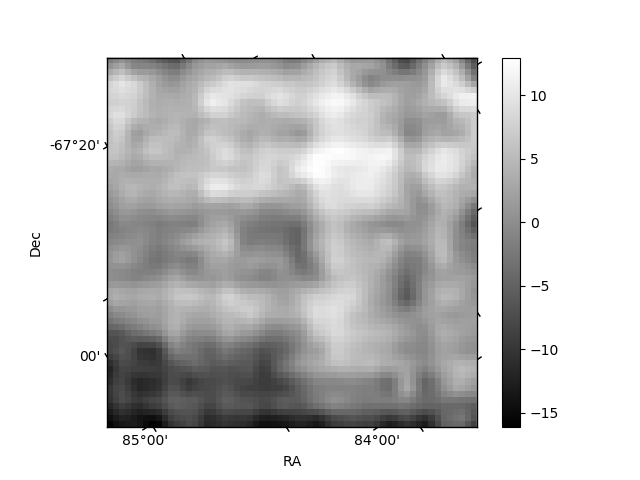
Histogram calculated using DETX and DETY for each event in the final _common_clean file
| Quadrant A | 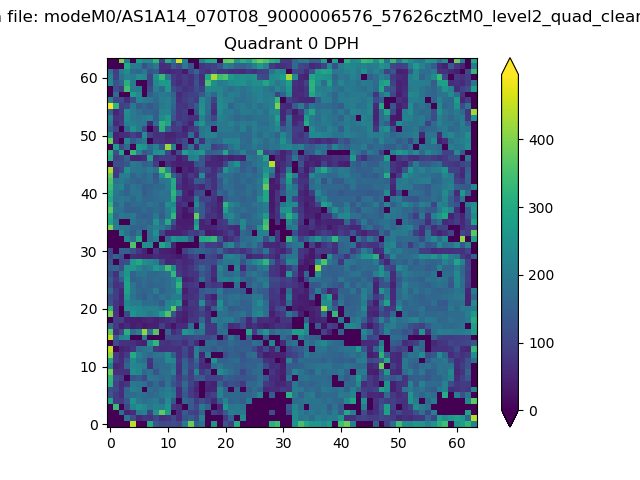 |
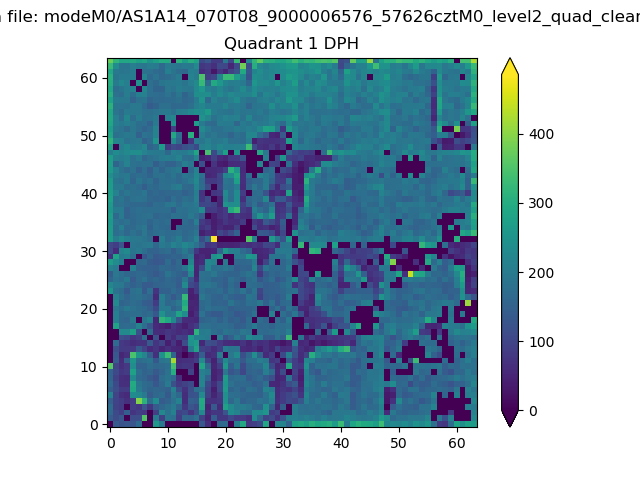 |
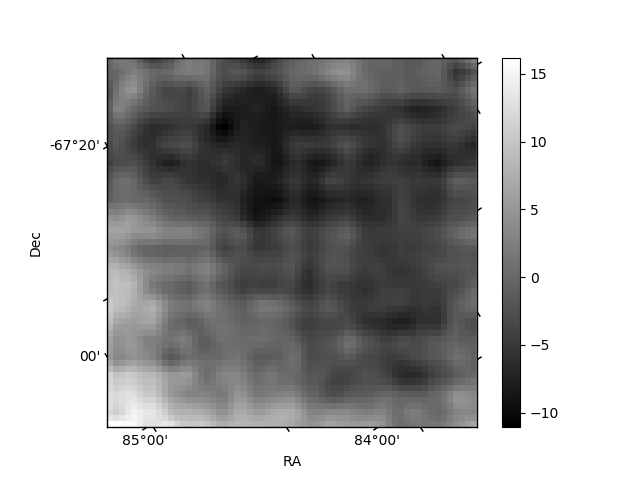
Quadrant B |
|---|---|---|---|
| Quadrant D | 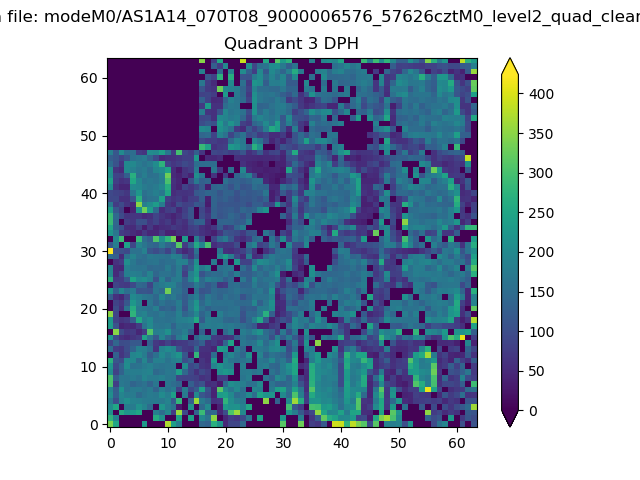 |
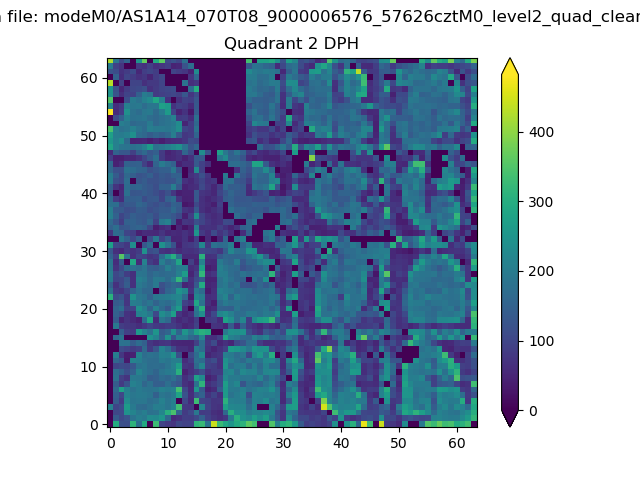 |
Quadrant C |
| Plot type | Count rate plots | Images |
|---|---|---|
| Comparison with Poisson distribution Blue bars denote a histogram of data divided into 1 sec bins. Red curve is a Poisson curve with rate = median count rate of data. |
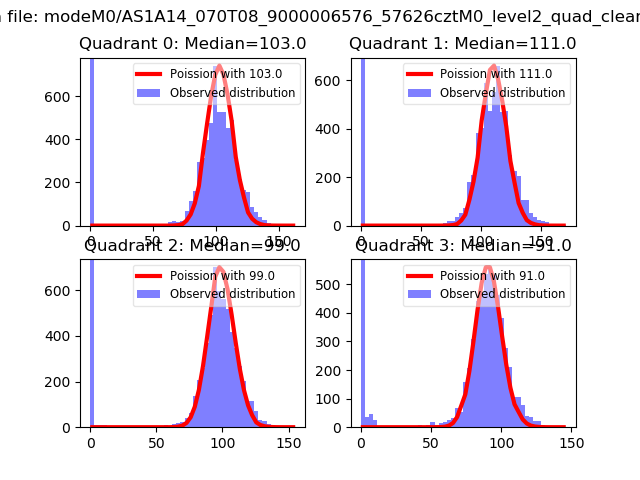 |
 |
| Quadrant-wise count rates Data is divided into 100 sec bins |
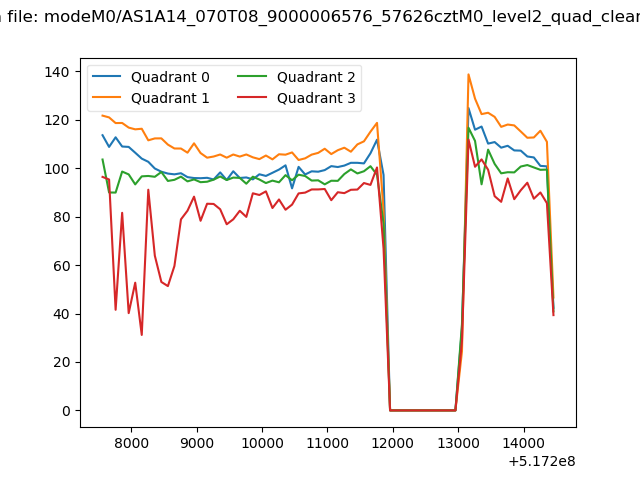 |
|
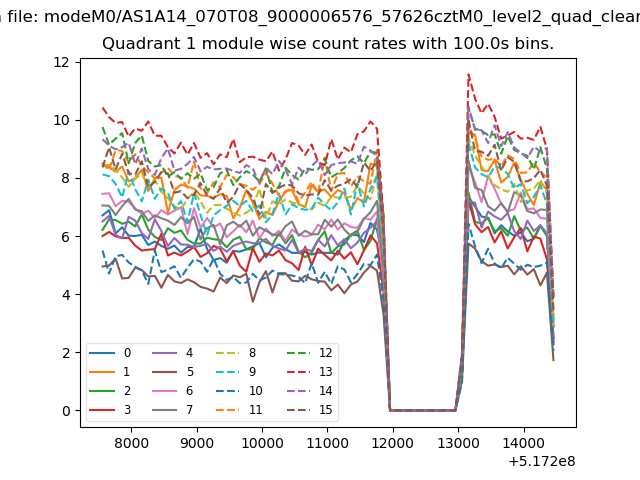
| Module-wise count rates for Quadrant A Data is divided into 100 sec bins |
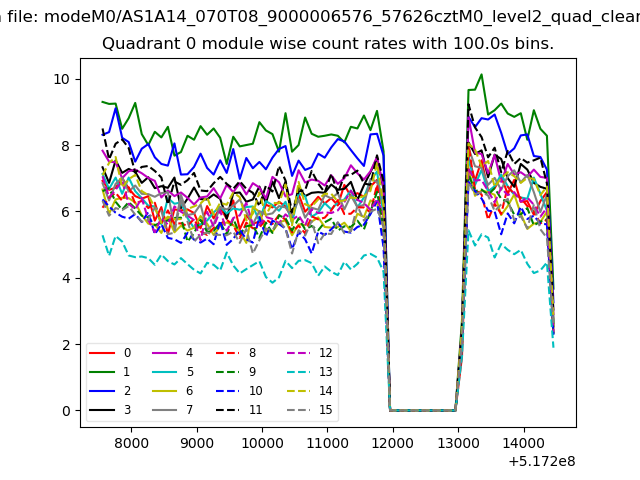 |
 |
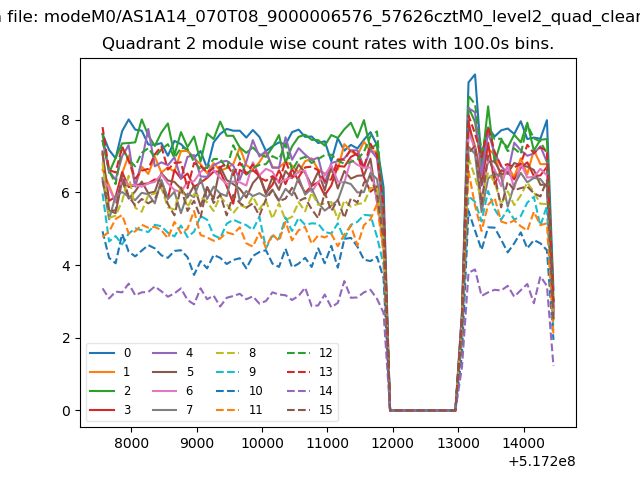
| Module-wise count rates for Quadrant B Data is divided into 100 sec bins |
 |
 |
| Module-wise count rates for Quadrant C Data is divided into 100 sec bins |
 |
 |
| Module-wise count rates for Quadrant D Data is divided into 100 sec bins |
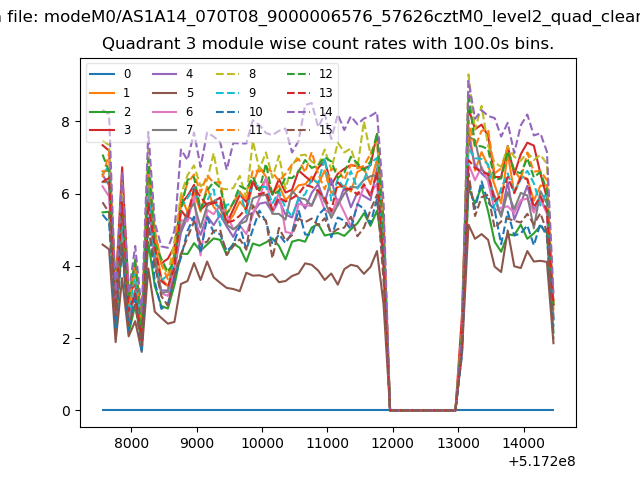 |
 |
| Parameter | Plot |
|---|---|
| CZT HV Monitor | 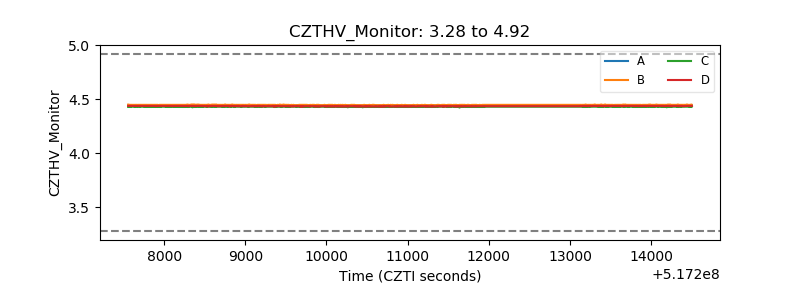 |
| D_VDD | 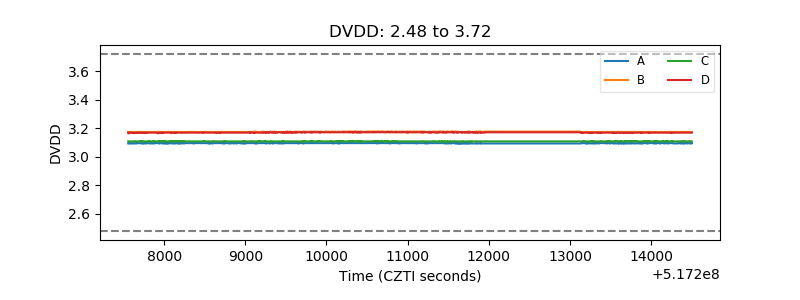 |
| Temperature 1 | 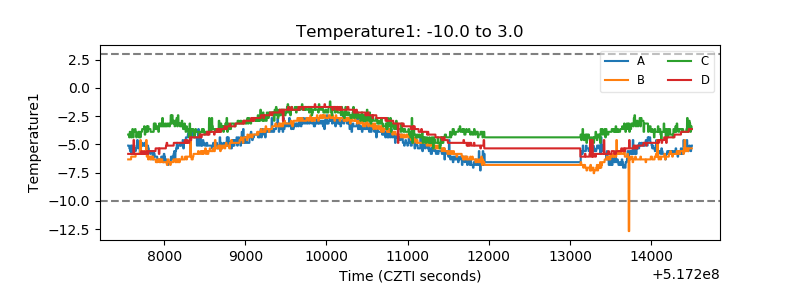 |
| Veto HV Monitor | 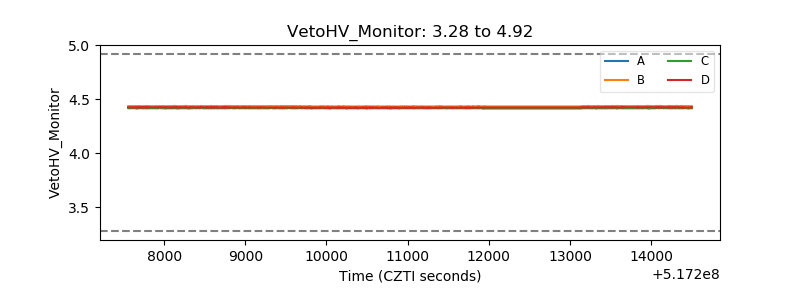 |
| Veto LLD | 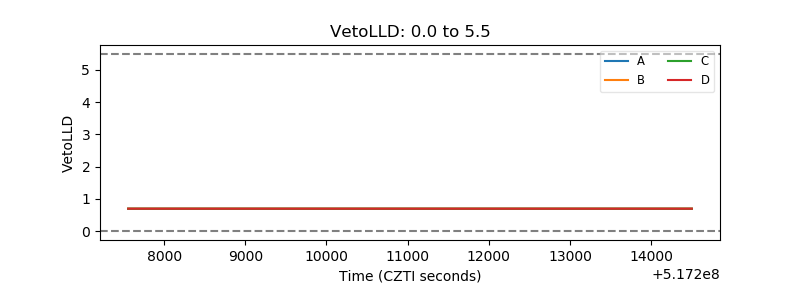 |
| Alpha Counter | 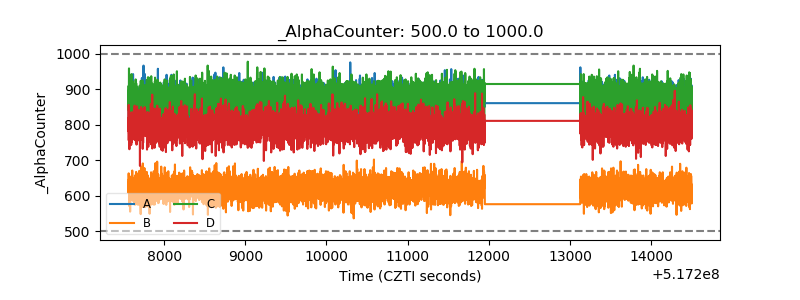 |
| _CPM_Rate | 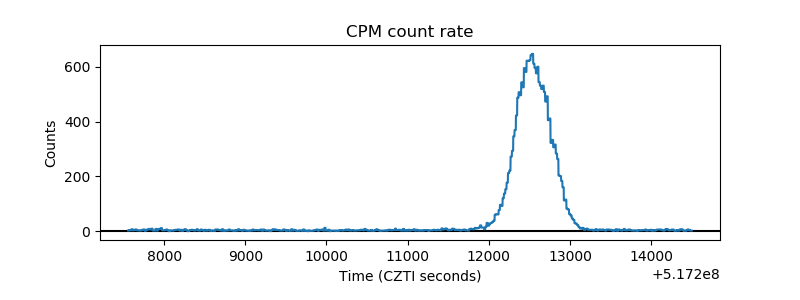 |
| CZT Counter | 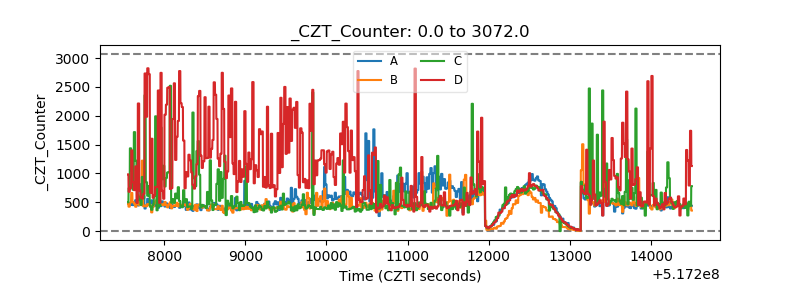 |
| +2.5 Volts monitor | 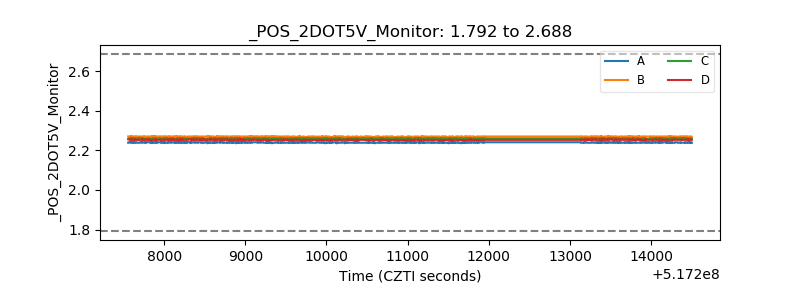 |
| +5 Volts monitor | 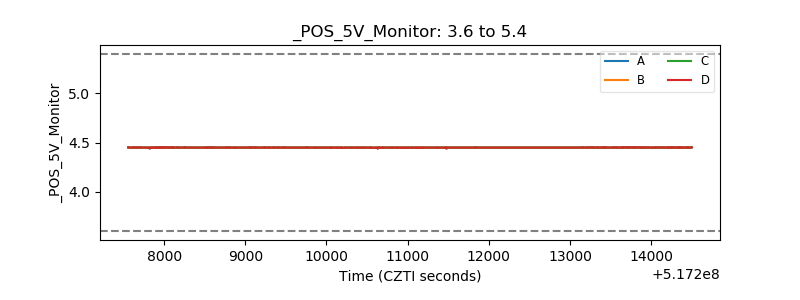 |
| _ROLL_ROT | 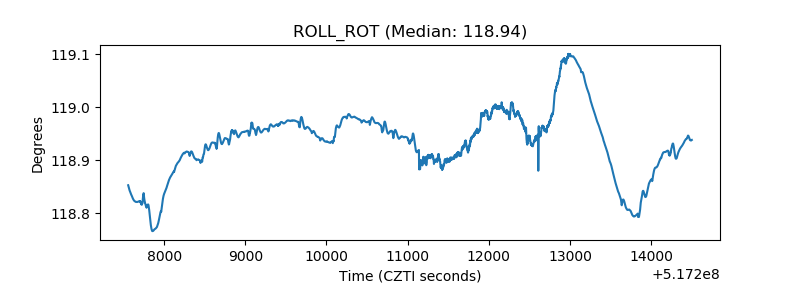 |
| _Roll_DEC | 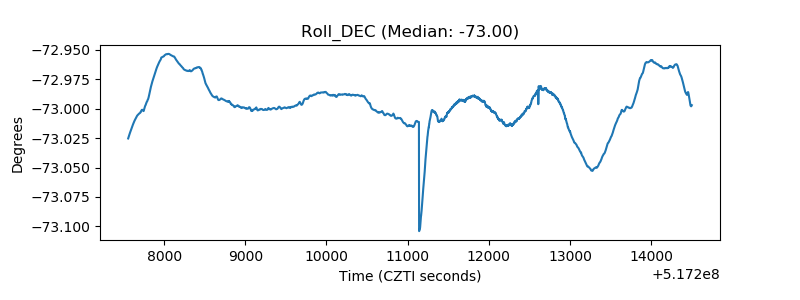 |
| _Roll_RA | 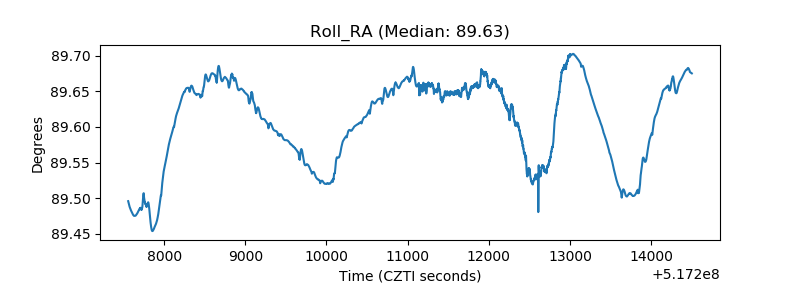 |
| Veto Counter | 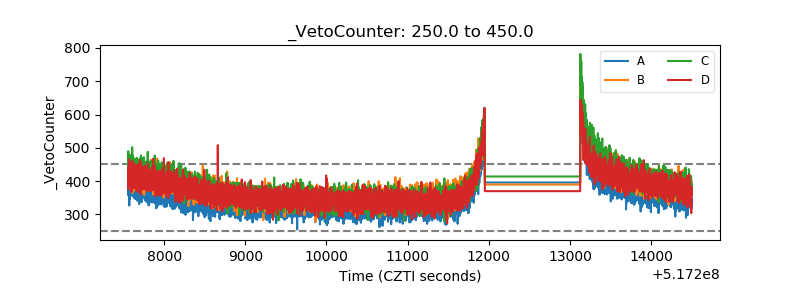 |