| Param | Original file | Final file |
|---|---|---|
| Filename | modeM0/AS1A14_070T08_9000006576_57627cztM0_level2.fits | modeM0/AS1A14_070T08_9000006576_57627cztM0_level2_quad_clean.evt |
| Size (bytes) | 479,868,480 | 87,946,560 |
| Size | 457.6 MB | 83.9 MB |
| Events in quadrant A | 3,335,636 | 603,790 |
| Events in quadrant B | 2,836,939 | 654,152 |
| Events in quadrant C | 3,854,458 | 577,068 |
| Events in quadrant D | 7,263,613 | 403,313 |
| Mode M0 | |||
|---|---|---|---|
| Quadrant | BADHDUFLAG | Total packets | Discarded packets |
| A | 0 | 14503 | 1 |
| B | 0 | 12742 | 1 |
| C | 0 | 15698 | 1 |
| D | 0 | 25725 | 1 |
| Mode M9 | |||
|---|---|---|---|
| Quadrant | BADHDUFLAG | Total packets | Discarded packets |
| A | 0 | 10 | 0 |
| B | 0 | 10 | 0 |
| C | 0 | 10 | 0 |
| D | 0 | 10 | 0 |
| Mode SS | |||
|---|---|---|---|
| Quadrant | BADHDUFLAG | Total packets | Discarded packets |
| A | 0 | 126 | 0 |
| B | 0 | 126 | 0 |
| C | 0 | 126 | 0 |
| D | 0 | 126 | 0 |
| Quadrant | Total seconds | Saturated seconds | Saturation percentage |
|---|---|---|---|
| A | 6071 | 106 | 1.746006% |
| B | 6072 | 121 | 1.992754% |
| C | 6072 | 234 | 3.853755% |
| D | 6072 | 1782 | 29.347826% |
Noise dominated data is calculated using 1-second bins in cleaned event files. If a bin has >2000 counts, and if more than 50% of those come from <1% of pixels, then it is considered to be noise-dominated and hence unusable.
| Quadrant | # 1 sec bins | Bins with >0 counts | Bins with >2000 counts | High rate bins dominated by noise | Noise dominated (total time) | Noise dominated (detector-on time) | Marked lightcurve |
|---|---|---|---|---|---|---|---|
| A | 7136 | 6072 | 1 | 1 | 0.01% | 0.02% | 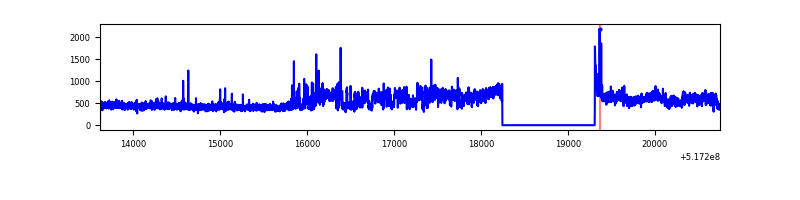 |
| B | 7137 | 6073 | 12 | 12 | 0.17% | 0.20% | 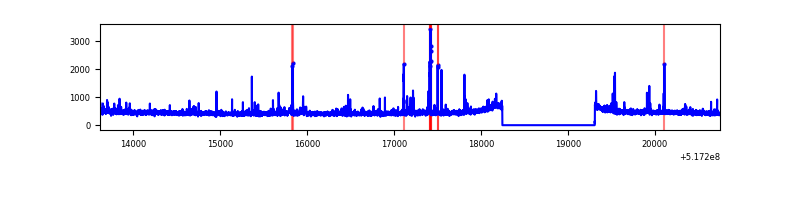 |
| C | 7137 | 6073 | 145 | 145 | 2.03% | 2.39% | 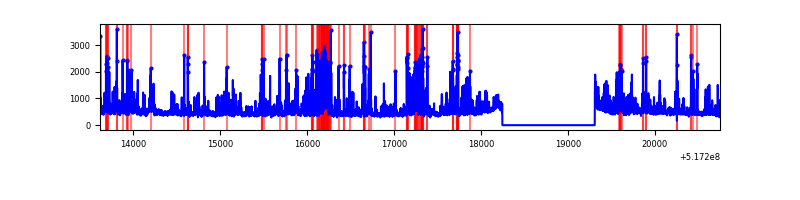 |
| D | 7137 | 6073 | 1189 | 1189 | 16.66% | 19.58% | 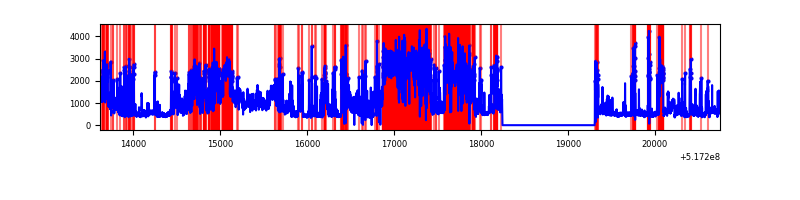 |
Top three noisy pixels from each quadrant. If the there are fewer than three noisy pixels in the level2.evt file, extra rows are filled as -1
| Pixel properties | Quadrant properties | ||||||
|---|---|---|---|---|---|---|---|
| Quadrant | DetID | PixID | Counts | Sigma | Mean | Median | Sigma |
| A | 3 | 14 | 689805 | 4156.33 | 670 | 653 | 165.8 |
| A | 4 | 249 | 15821 | 91.48 | 670 | 653 | 165.8 |
| A | 3 | 245 | 14875 | 85.77 | 670 | 653 | 165.8 |
| B | 7 | 252 | 45670 | 321.28 | 662 | 636 | 140.2 |
| B | 10 | 247 | 35223 | 246.75 | 662 | 636 | 140.2 |
| B | 0 | 63 | 28928 | 201.84 | 662 | 636 | 140.2 |
| C | 15 | 224 | 1136284 | 6420.42 | 650 | 643 | 176.9 |
| C | 14 | 254 | 55595 | 310.67 | 650 | 643 | 176.9 |
| C | 12 | 2 | 50805 | 283.59 | 650 | 643 | 176.9 |
| D | 8 | 240 | 2931358 | 19175.5 | 538 | 513 | 152.8 |
| D | 8 | 160 | 1782169 | 11656.75 | 538 | 513 | 152.8 |
| D | 15 | 142 | 331477 | 2165.38 | 538 | 513 | 152.8 |
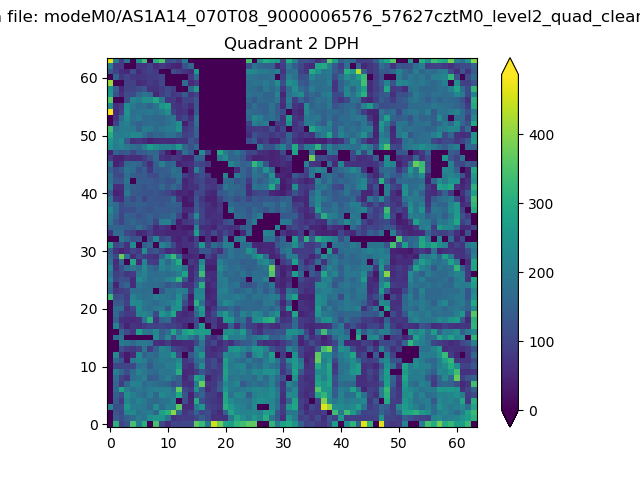
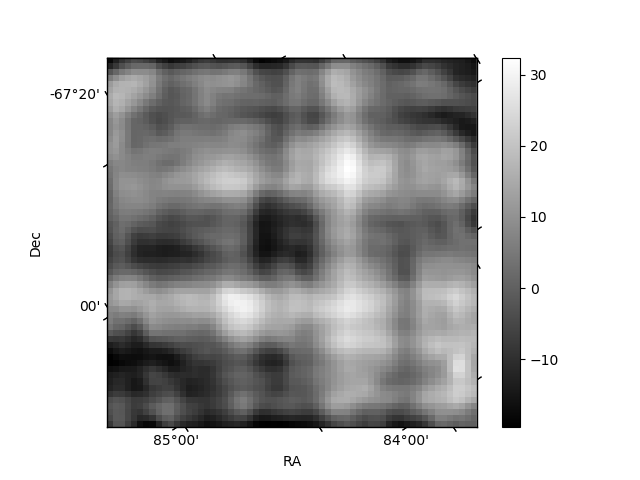
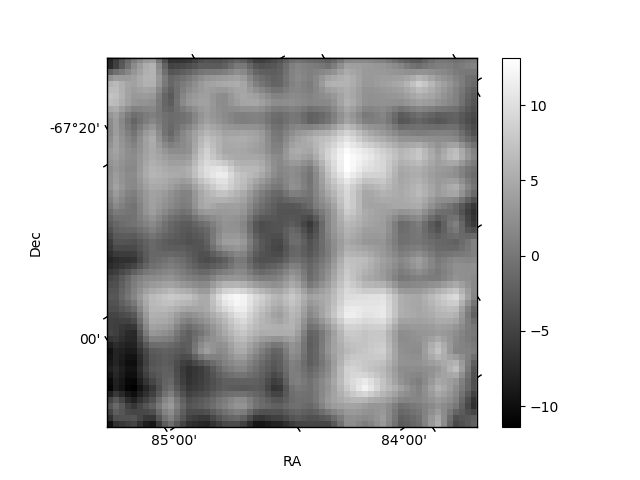
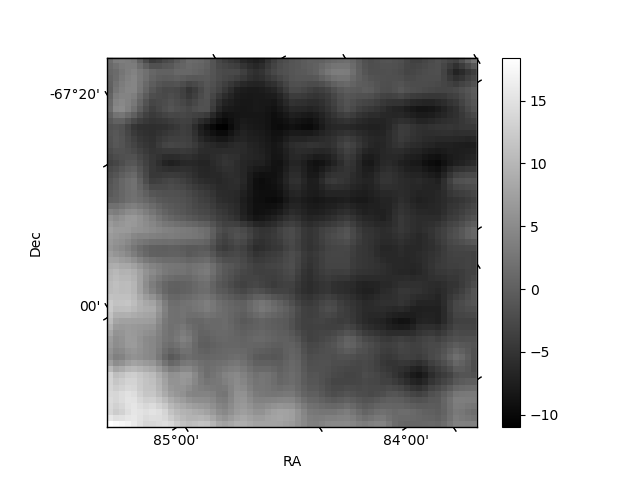
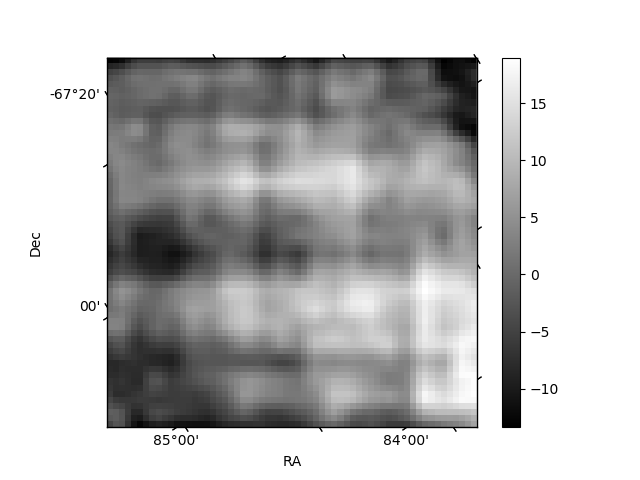
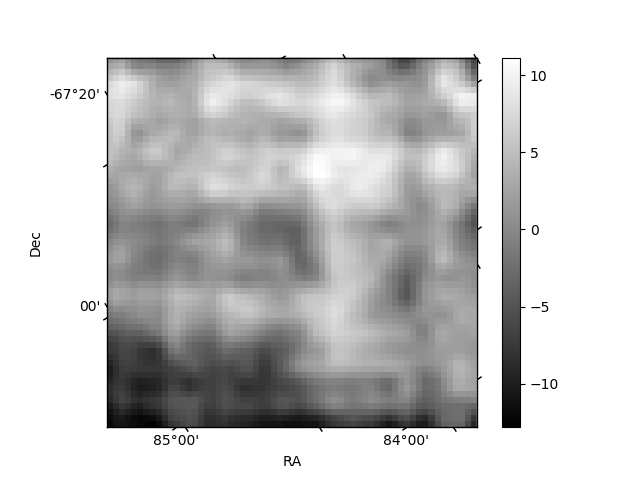
Histogram calculated using DETX and DETY for each event in the final _common_clean file
| Quadrant A | 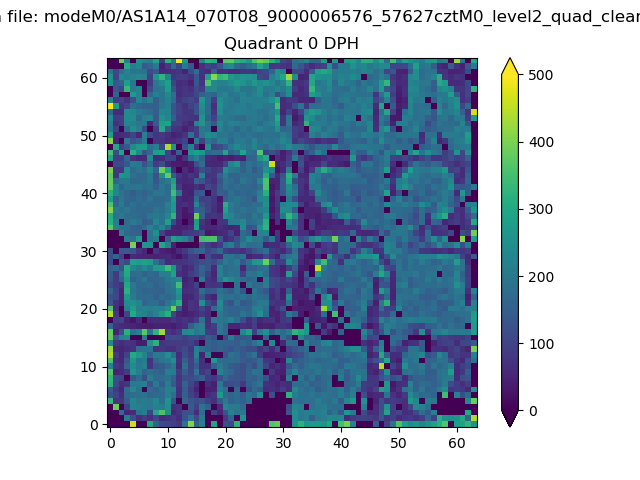 |
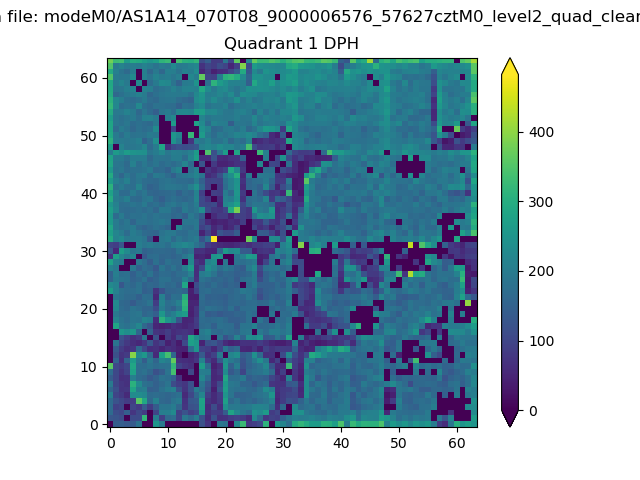 |
Quadrant B |
|---|---|---|---|
| Quadrant D | 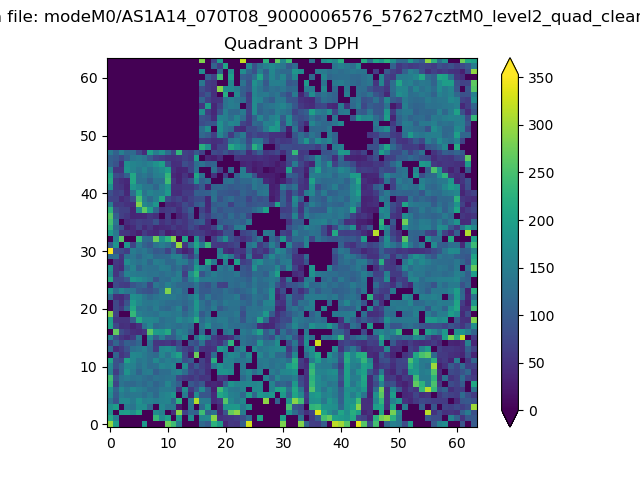 |
 |
Quadrant C |
| Plot type | Count rate plots | Images |
|---|---|---|
| Comparison with Poisson distribution Blue bars denote a histogram of data divided into 1 sec bins. Red curve is a Poisson curve with rate = median count rate of data. |
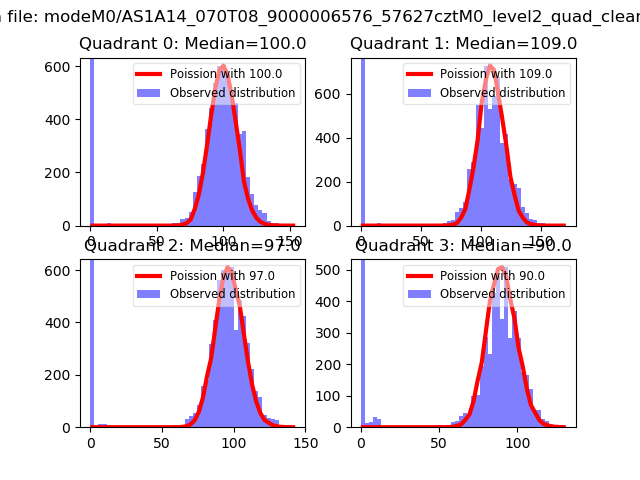 |
 |
| Quadrant-wise count rates Data is divided into 100 sec bins |
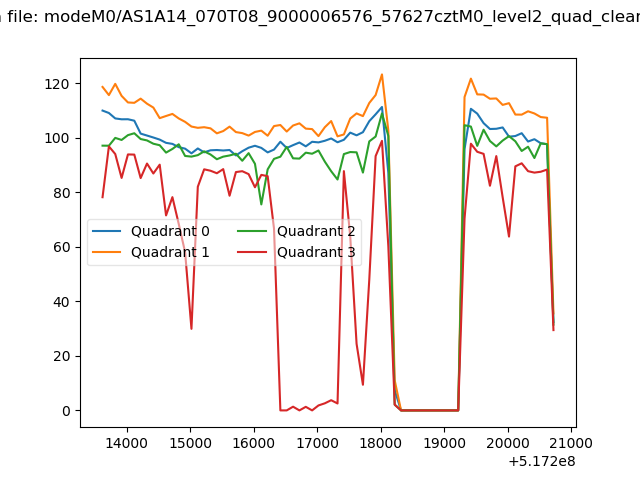 |
|
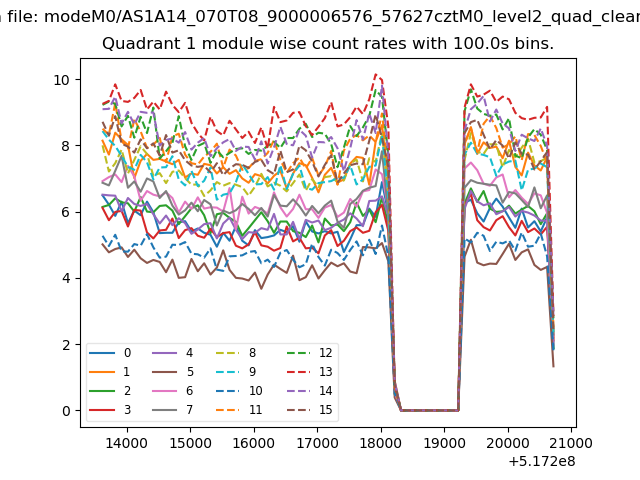
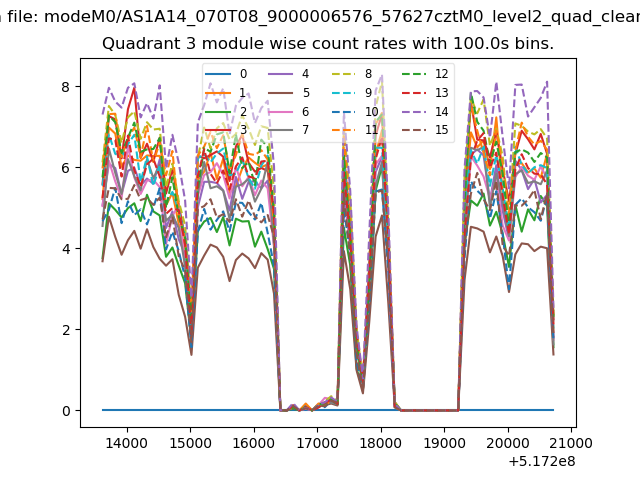
| Module-wise count rates for Quadrant A Data is divided into 100 sec bins |
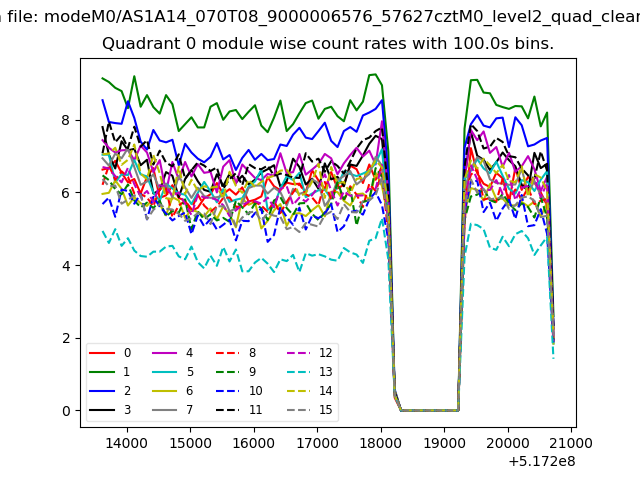 |
 |
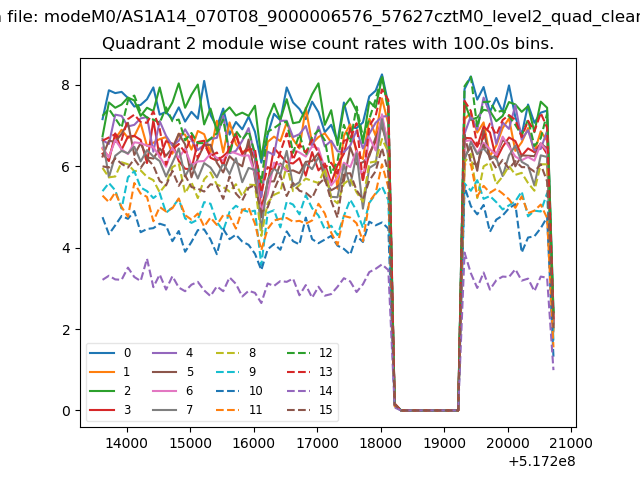
| Module-wise count rates for Quadrant B Data is divided into 100 sec bins |
 |
 |
| Module-wise count rates for Quadrant C Data is divided into 100 sec bins |
 |
 |
| Module-wise count rates for Quadrant D Data is divided into 100 sec bins |
 |
 |
| Parameter | Plot |
|---|---|
| CZT HV Monitor |  |
| D_VDD | 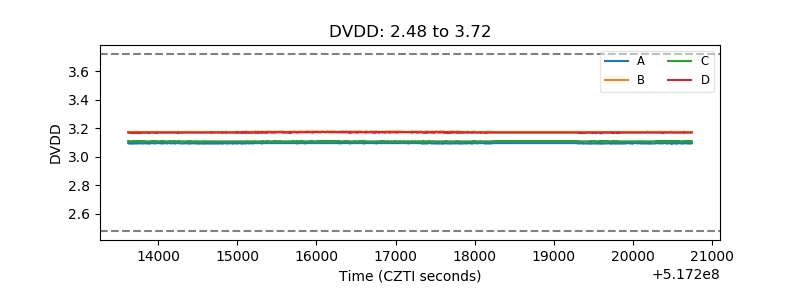 |
| Temperature 1 | 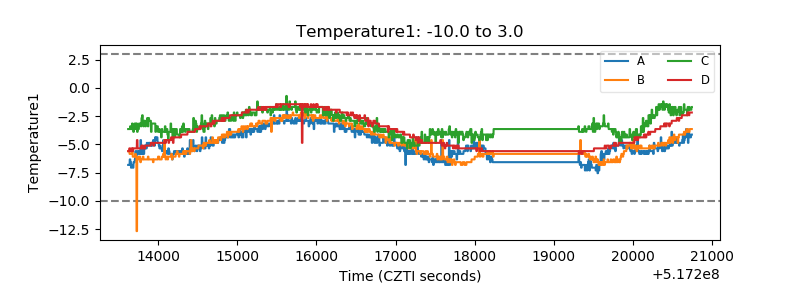 |
| Veto HV Monitor | 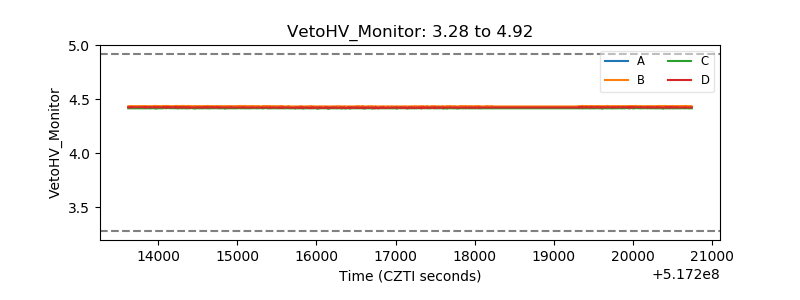 |
| Veto LLD | 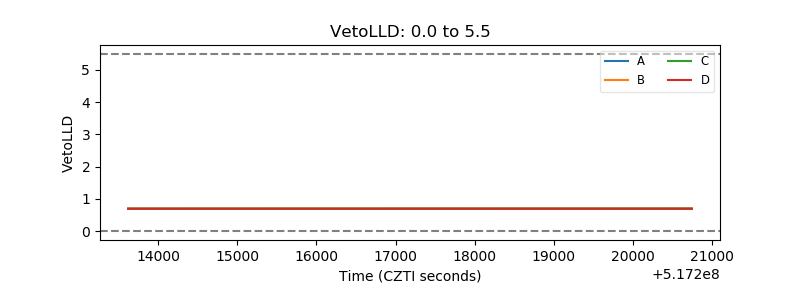 |
| Alpha Counter | 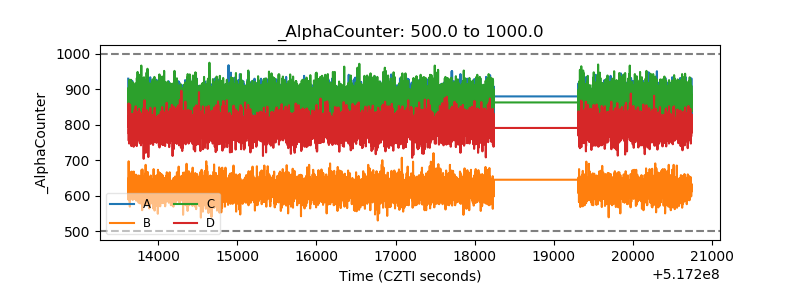 |
| _CPM_Rate | 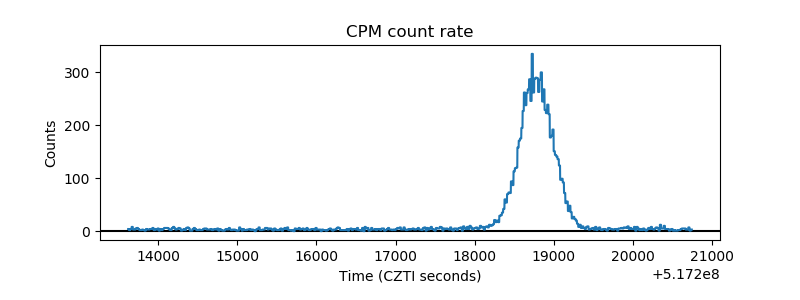 |
| CZT Counter | 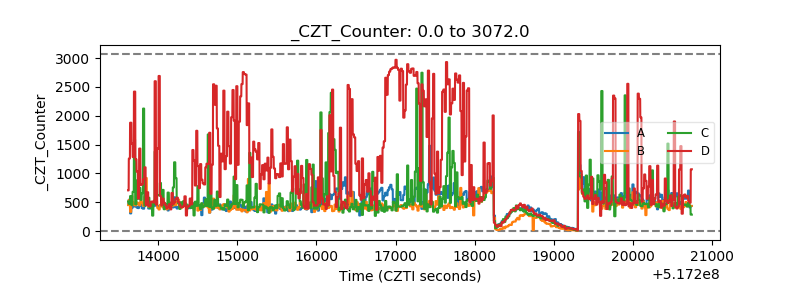 |
| +2.5 Volts monitor | 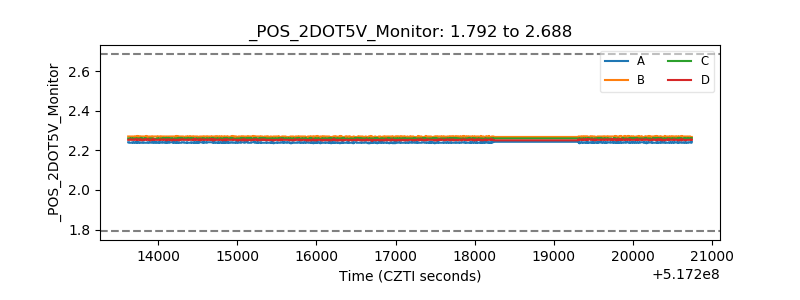 |
| +5 Volts monitor | 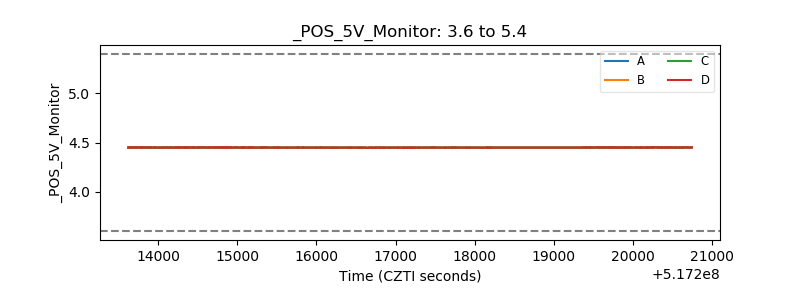 |
| _ROLL_ROT | 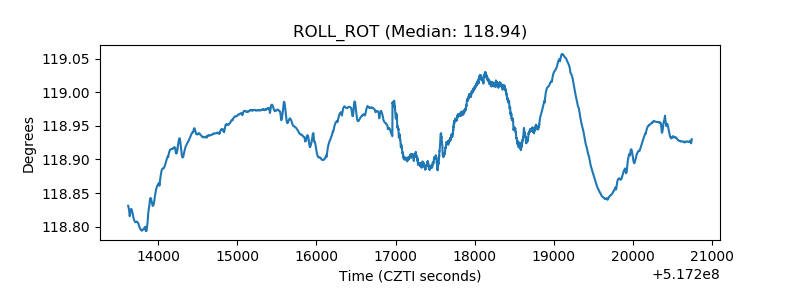 |
| _Roll_DEC | 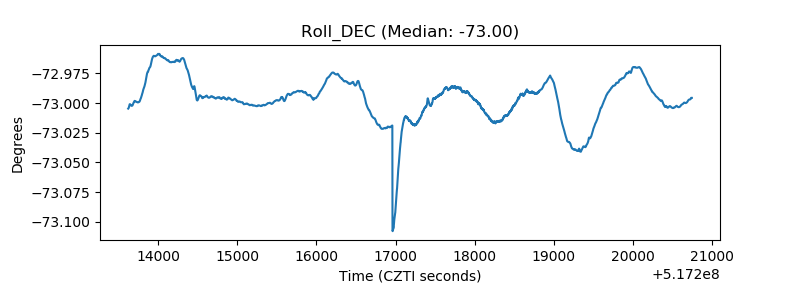 |
| _Roll_RA | 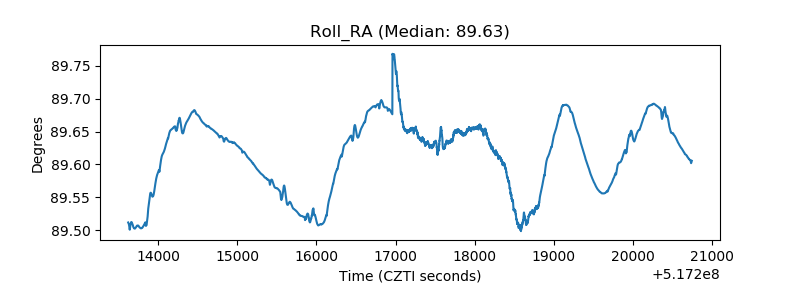 |
| Veto Counter | 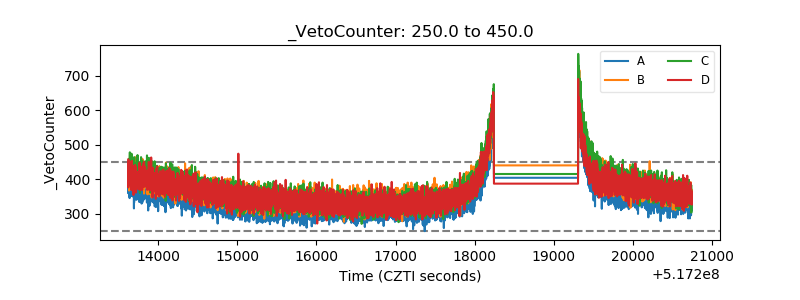 |