| Param | Original file | Final file |
|---|---|---|
| Filename | modeM0/AS1A14_070T08_9000006576_57628cztM0_level2.fits | modeM0/AS1A14_070T08_9000006576_57628cztM0_level2_quad_clean.evt |
| Size (bytes) | 523,393,920 | 97,493,760 |
| Size | 499.1 MB | 93.0 MB |
| Events in quadrant A | 3,686,966 | 660,745 |
| Events in quadrant B | 3,399,396 | 713,952 |
| Events in quadrant C | 6,727,320 | 517,511 |
| Events in quadrant D | 5,028,789 | 583,276 |
| Mode M0 | |||
|---|---|---|---|
| Quadrant | BADHDUFLAG | Total packets | Discarded packets |
| A | 0 | 15474 | 1 |
| B | 0 | 14950 | 1 |
| C | 0 | 24721 | 1 |
| D | 0 | 19644 | 1 |
| Mode M9 | |||
|---|---|---|---|
| Quadrant | BADHDUFLAG | Total packets | Discarded packets |
| A | 0 | 8 | 0 |
| B | 0 | 8 | 0 |
| C | 0 | 8 | 0 |
| D | 0 | 8 | 0 |
| Mode SS | |||
|---|---|---|---|
| Quadrant | BADHDUFLAG | Total packets | Discarded packets |
| A | 0 | 138 | 0 |
| B | 0 | 138 | 0 |
| C | 0 | 138 | 0 |
| D | 0 | 138 | 0 |
| Quadrant | Total seconds | Saturated seconds | Saturation percentage |
|---|---|---|---|
| A | 6840 | 121 | 1.769006% |
| B | 6841 | 152 | 2.221897% |
| C | 6841 | 1417 | 20.713346% |
| D | 6841 | 352 | 5.145447% |
Noise dominated data is calculated using 1-second bins in cleaned event files. If a bin has >2000 counts, and if more than 50% of those come from <1% of pixels, then it is considered to be noise-dominated and hence unusable.
| Quadrant | # 1 sec bins | Bins with >0 counts | Bins with >2000 counts | High rate bins dominated by noise | Noise dominated (total time) | Noise dominated (detector-on time) | Marked lightcurve |
|---|---|---|---|---|---|---|---|
| A | 7675 | 6841 | 5 | 5 | 0.07% | 0.07% | 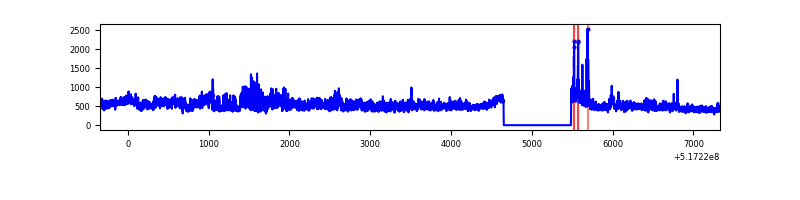 |
| B | 7676 | 6842 | 32 | 32 | 0.42% | 0.47% | 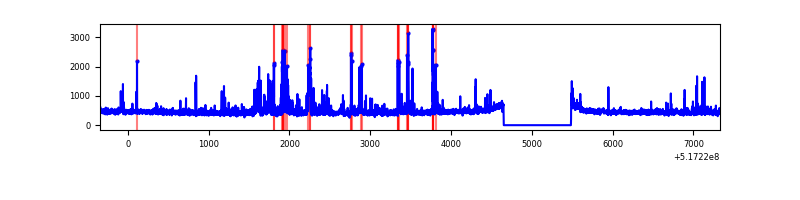 |
| C | 7676 | 6842 | 1234 | 1234 | 16.08% | 18.04% | 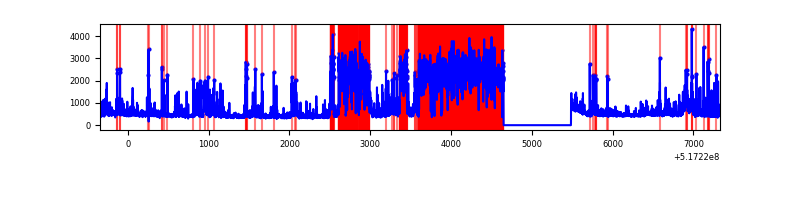 |
| D | 7676 | 6842 | 266 | 266 | 3.47% | 3.89% | 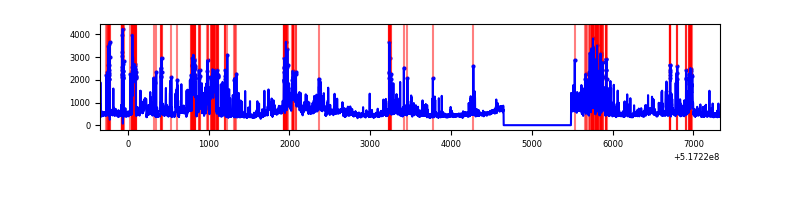 |
Top three noisy pixels from each quadrant. If the there are fewer than three noisy pixels in the level2.evt file, extra rows are filled as -1
| Pixel properties | Quadrant properties | ||||||
|---|---|---|---|---|---|---|---|
| Quadrant | DetID | PixID | Counts | Sigma | Mean | Median | Sigma |
| A | 3 | 14 | 711332 | 3873.25 | 743 | 722 | 183.5 |
| A | 7 | 64 | 53503 | 287.69 | 743 | 722 | 183.5 |
| A | 3 | 245 | 41594 | 222.78 | 743 | 722 | 183.5 |
| B | 10 | 247 | 114658 | 728.52 | 731 | 703 | 156.4 |
| B | 0 | 213 | 113245 | 719.49 | 731 | 703 | 156.4 |
| B | 0 | 171 | 57314 | 361.92 | 731 | 703 | 156.4 |
| C | 9 | 38 | 3349045 | 19611.58 | 626 | 617 | 170.7 |
| C | 15 | 224 | 417129 | 2439.49 | 626 | 617 | 170.7 |
| C | 6 | 223 | 205520 | 1200.11 | 626 | 617 | 170.7 |
| D | 8 | 160 | 1145094 | 5711.97 | 715 | 683 | 200.4 |
| D | 8 | 240 | 449079 | 2238.03 | 715 | 683 | 200.4 |
| D | 15 | 142 | 246789 | 1228.36 | 715 | 683 | 200.4 |
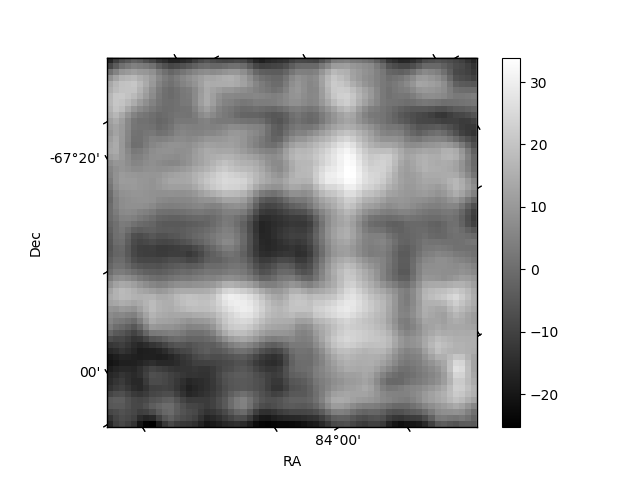
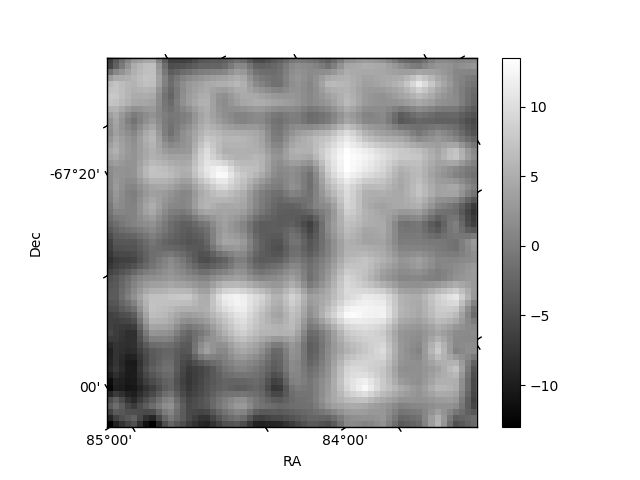
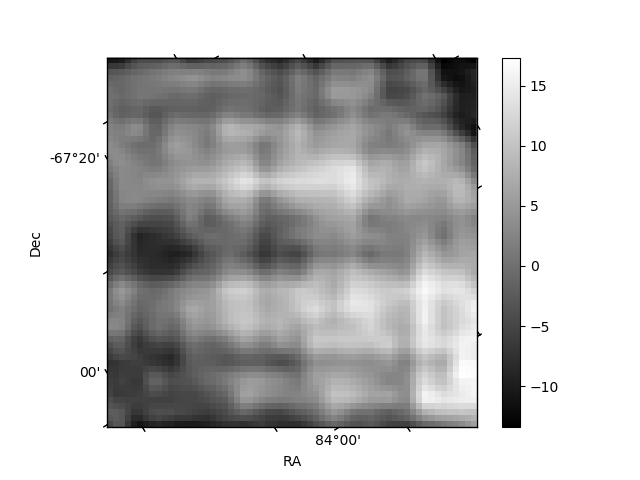
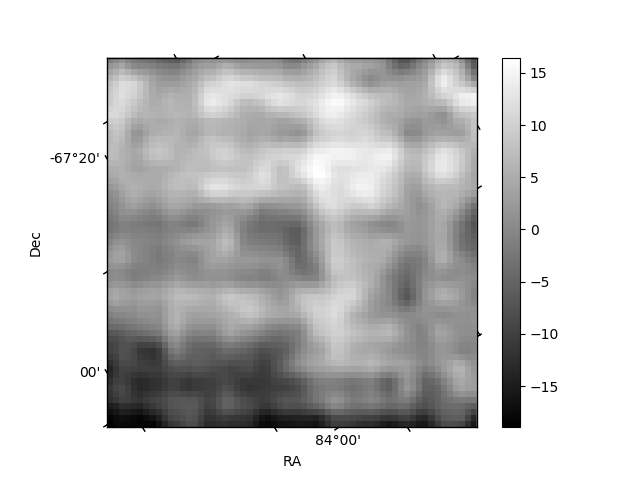
Histogram calculated using DETX and DETY for each event in the final _common_clean file
| Quadrant A | 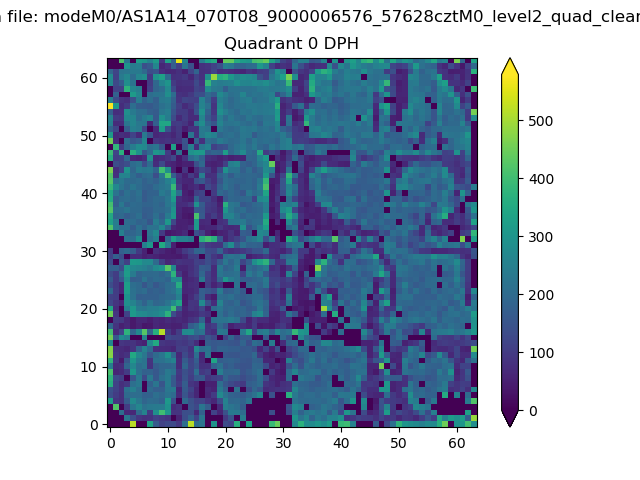 |
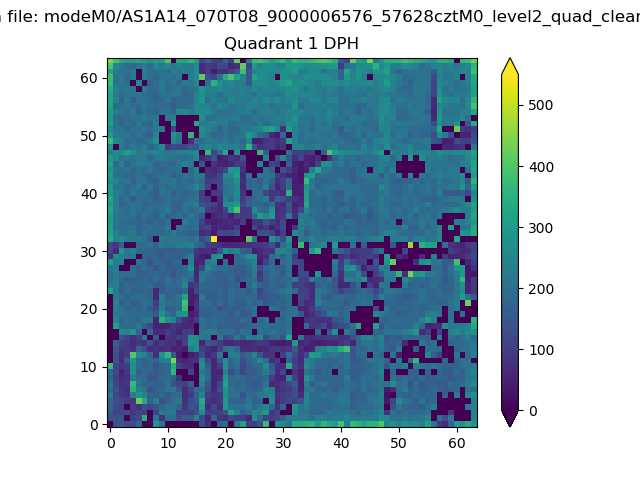 |
Quadrant B |
|---|---|---|---|
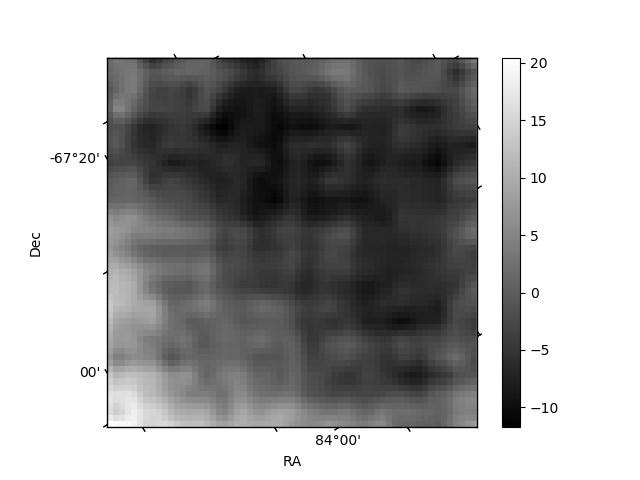
| Quadrant D | 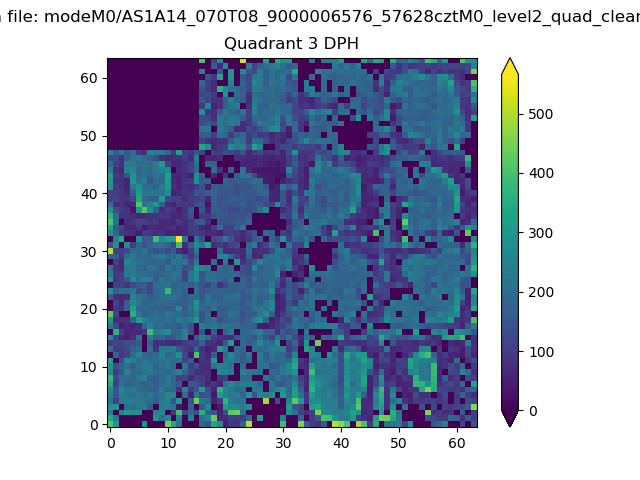 |
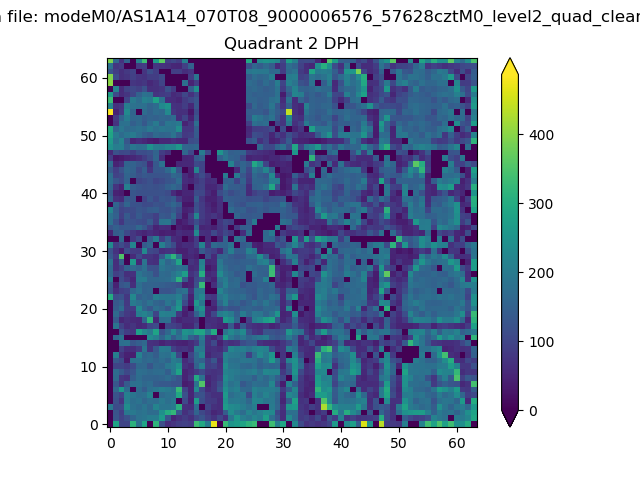 |
Quadrant C |
| Plot type | Count rate plots | Images |
|---|---|---|
| Comparison with Poisson distribution Blue bars denote a histogram of data divided into 1 sec bins. Red curve is a Poisson curve with rate = median count rate of data. |
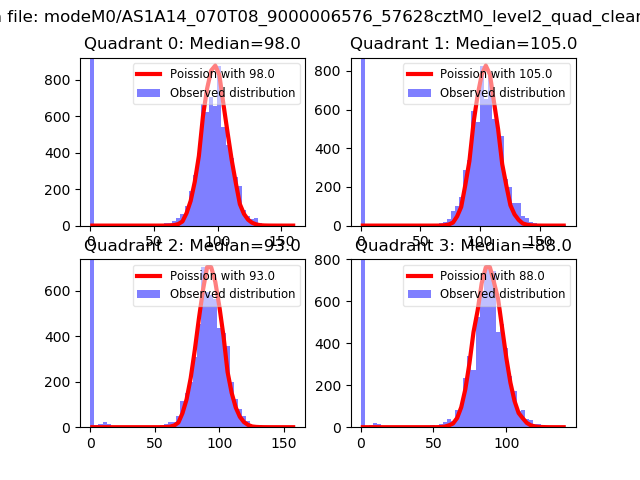 |
 |
| Quadrant-wise count rates Data is divided into 100 sec bins |
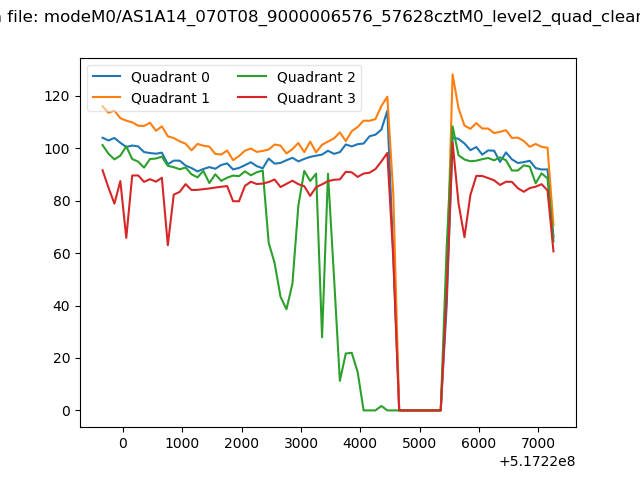 |
|
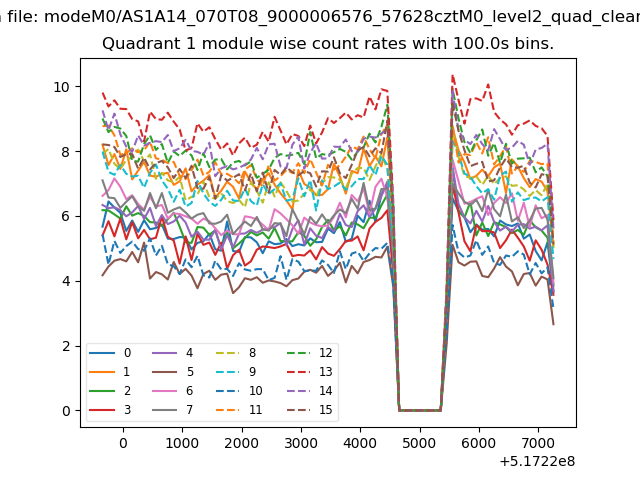
| Module-wise count rates for Quadrant A Data is divided into 100 sec bins |
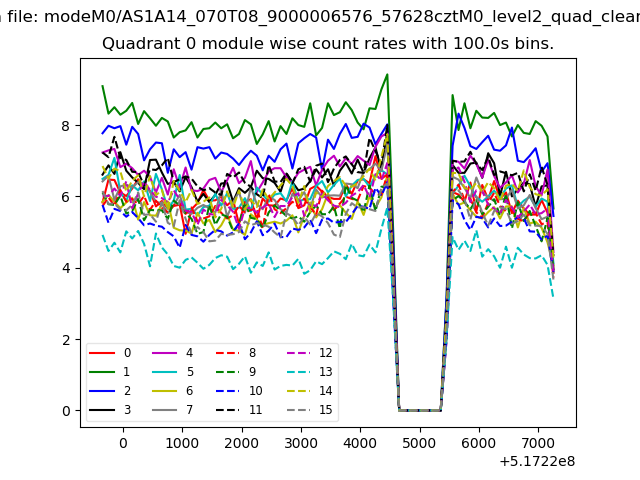 |
 |
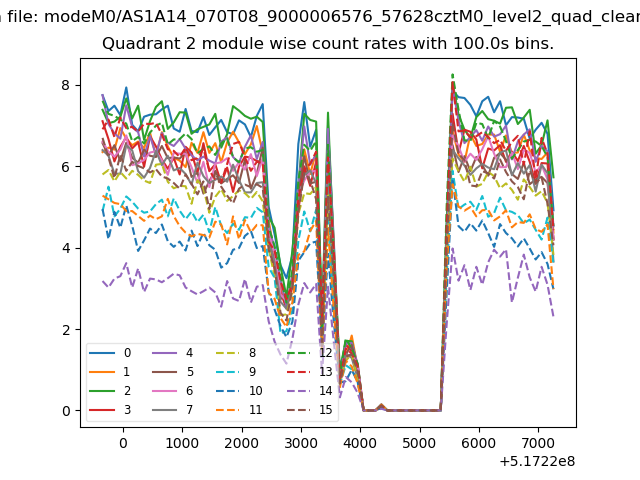
| Module-wise count rates for Quadrant B Data is divided into 100 sec bins |
 |
 |
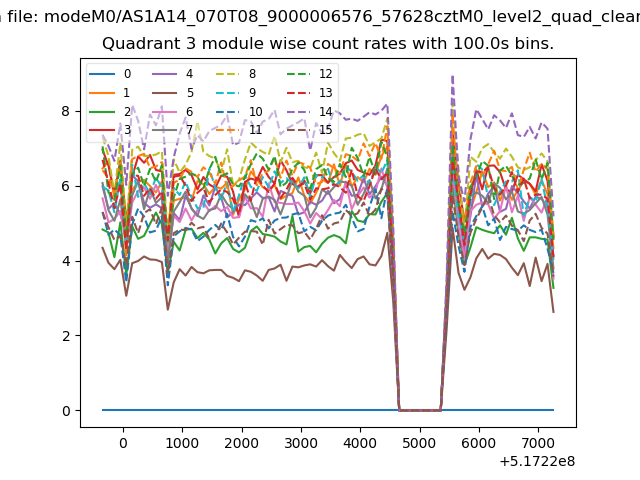
| Module-wise count rates for Quadrant C Data is divided into 100 sec bins |
 |
 |
| Module-wise count rates for Quadrant D Data is divided into 100 sec bins |
 |
 |
| Parameter | Plot |
|---|---|
| CZT HV Monitor | 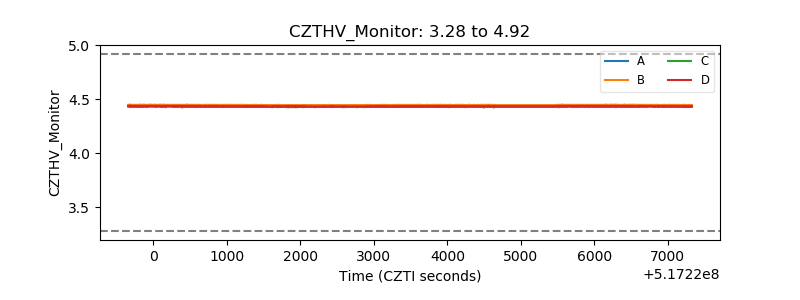 |
| D_VDD | 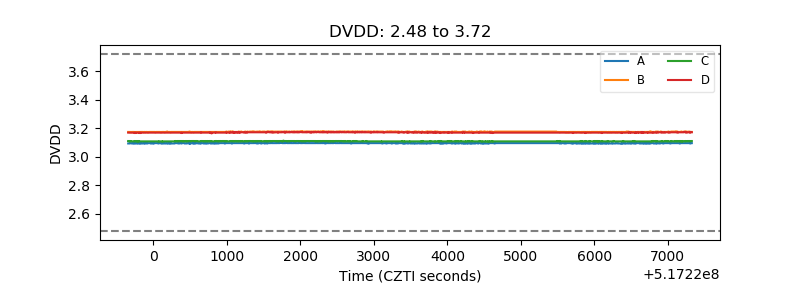 |
| Temperature 1 | 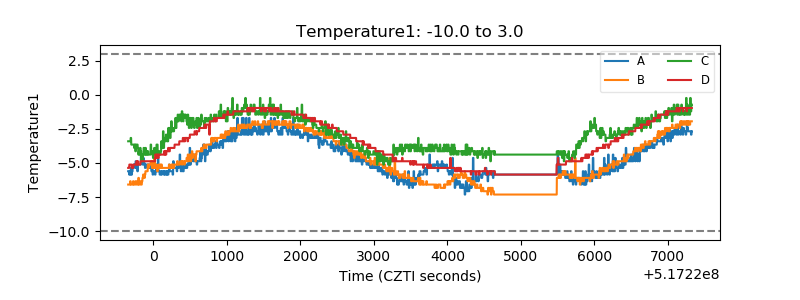 |
| Veto HV Monitor |  |
| Veto LLD | 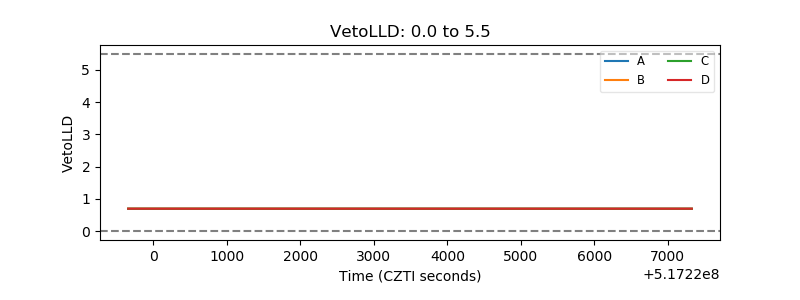 |
| Alpha Counter | 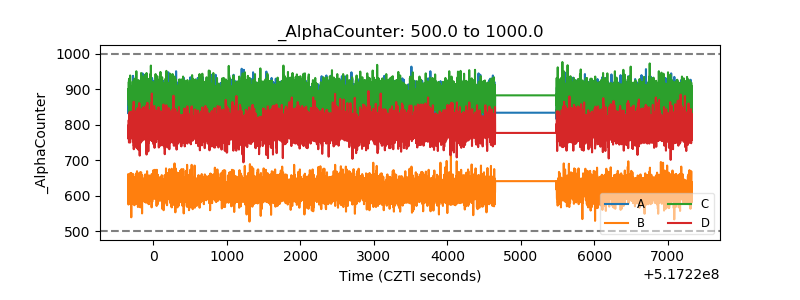 |
| _CPM_Rate | 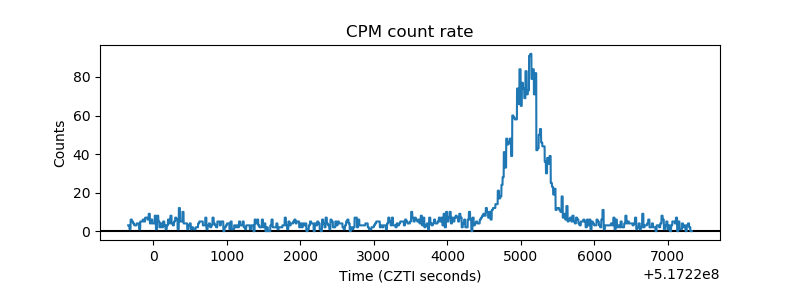 |
| CZT Counter | 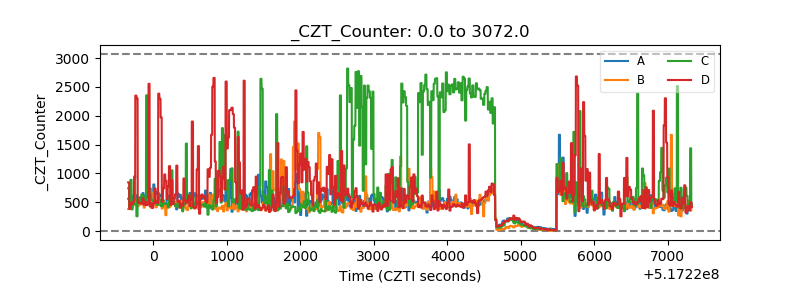 |
| +2.5 Volts monitor | 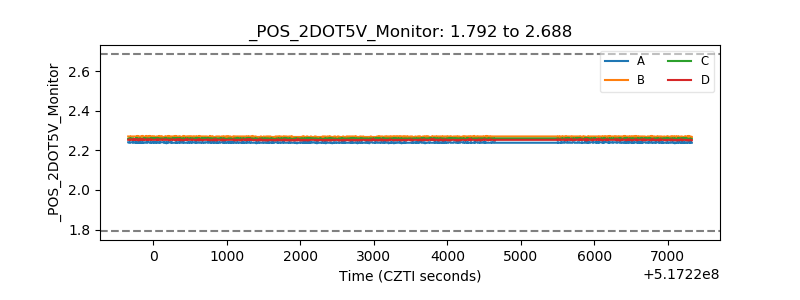 |
| +5 Volts monitor | 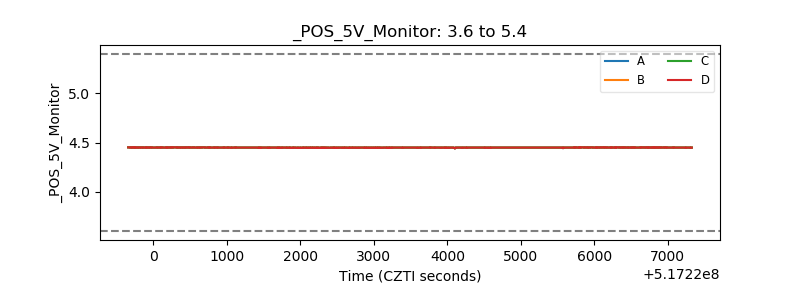 |
| _ROLL_ROT | 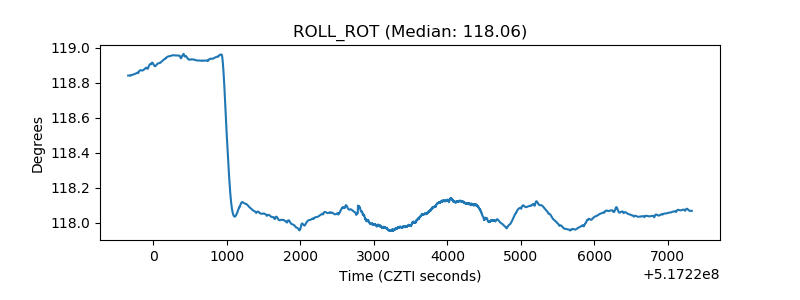 |
| _Roll_DEC | 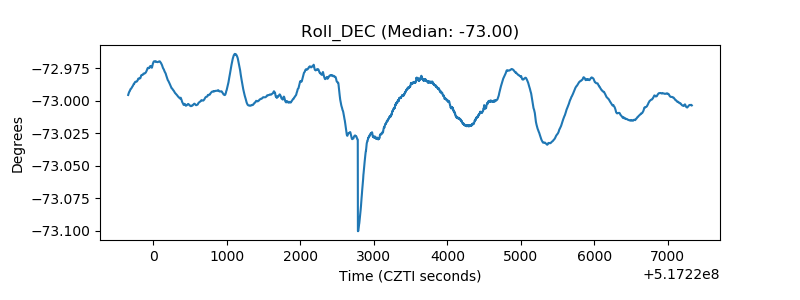 |
| _Roll_RA | 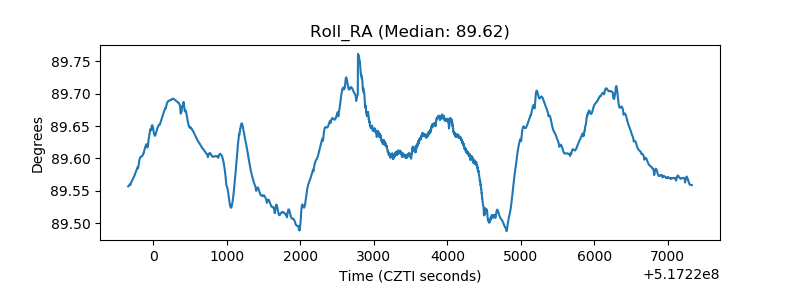 |
| Veto Counter | 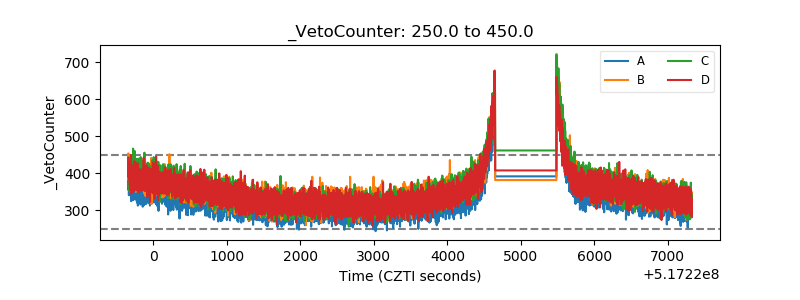 |