| Param | Original file | Final file |
|---|---|---|
| Filename | modeM0/AS1A14_070T08_9000006576_57629cztM0_level2.fits | modeM0/AS1A14_070T08_9000006576_57629cztM0_level2_quad_clean.evt |
| Size (bytes) | 423,040,320 | 94,726,080 |
| Size | 403.4 MB | 90.3 MB |
| Events in quadrant A | 3,260,206 | 617,147 |
| Events in quadrant B | 3,450,581 | 654,756 |
| Events in quadrant C | 3,873,202 | 597,797 |
| Events in quadrant D | 4,565,041 | 541,119 |
| Mode M0 | |||
|---|---|---|---|
| Quadrant | BADHDUFLAG | Total packets | Discarded packets |
| A | 0 | 14534 | 1 |
| B | 0 | 14809 | 1 |
| C | 0 | 16136 | 1 |
| D | 0 | 18121 | 1 |
| Mode M9 | |||
|---|---|---|---|
| Quadrant | BADHDUFLAG | Total packets | Discarded packets |
| A | 0 | 4 | 0 |
| B | 0 | 4 | 0 |
| C | 0 | 4 | 0 |
| D | 0 | 4 | 0 |
| Mode SS | |||
|---|---|---|---|
| Quadrant | BADHDUFLAG | Total packets | Discarded packets |
| A | 0 | 132 | 0 |
| B | 0 | 132 | 0 |
| C | 0 | 132 | 0 |
| D | 0 | 134 | 0 |
| Quadrant | Total seconds | Saturated seconds | Saturation percentage |
|---|---|---|---|
| A | 6561 | 158 | 2.408169% |
| B | 6561 | 245 | 3.734187% |
| C | 6561 | 169 | 2.575827% |
| D | 6561 | 406 | 6.188081% |
Noise dominated data is calculated using 1-second bins in cleaned event files. If a bin has >2000 counts, and if more than 50% of those come from <1% of pixels, then it is considered to be noise-dominated and hence unusable.
| Quadrant | # 1 sec bins | Bins with >0 counts | Bins with >2000 counts | High rate bins dominated by noise | Noise dominated (total time) | Noise dominated (detector-on time) | Marked lightcurve |
|---|---|---|---|---|---|---|---|
| A | 6956 | 6562 | 9 | 9 | 0.13% | 0.14% | 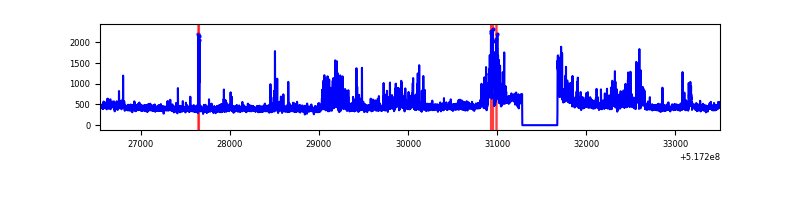 |
| B | 6956 | 6562 | 54 | 54 | 0.78% | 0.82% | 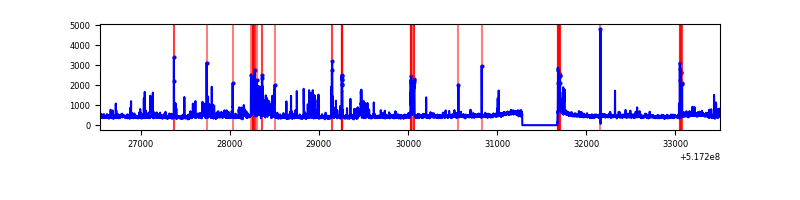 |
| C | 6956 | 6562 | 78 | 78 | 1.12% | 1.19% | 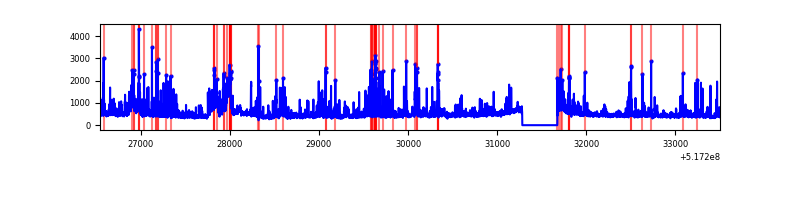 |
| D | 6956 | 6562 | 217 | 217 | 3.12% | 3.31% | 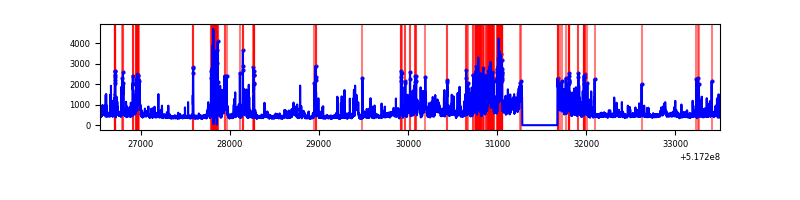 |
Top three noisy pixels from each quadrant. If the there are fewer than three noisy pixels in the level2.evt file, extra rows are filled as -1
| Pixel properties | Quadrant properties | ||||||
|---|---|---|---|---|---|---|---|
| Quadrant | DetID | PixID | Counts | Sigma | Mean | Median | Sigma |
| A | 7 | 64 | 395424 | 2272.07 | 707 | 689 | 173.7 |
| A | 4 | 249 | 66724 | 380.09 | 707 | 689 | 173.7 |
| A | 3 | 14 | 28678 | 161.1 | 707 | 689 | 173.7 |
| B | 10 | 247 | 248370 | 1691.36 | 692 | 667 | 146.5 |
| B | 0 | 213 | 91085 | 617.39 | 692 | 667 | 146.5 |
| B | 7 | 252 | 76377 | 516.96 | 692 | 667 | 146.5 |
| C | 15 | 224 | 611715 | 3269.59 | 684 | 676 | 186.9 |
| C | 12 | 252 | 430990 | 2302.55 | 684 | 676 | 186.9 |
| C | 14 | 254 | 81185 | 430.79 | 684 | 676 | 186.9 |
| D | 8 | 160 | 566433 | 2974.59 | 671 | 639 | 190.2 |
| D | 2 | 249 | 341511 | 1792.09 | 671 | 639 | 190.2 |
| D | 7 | 96 | 192814 | 1010.34 | 671 | 639 | 190.2 |
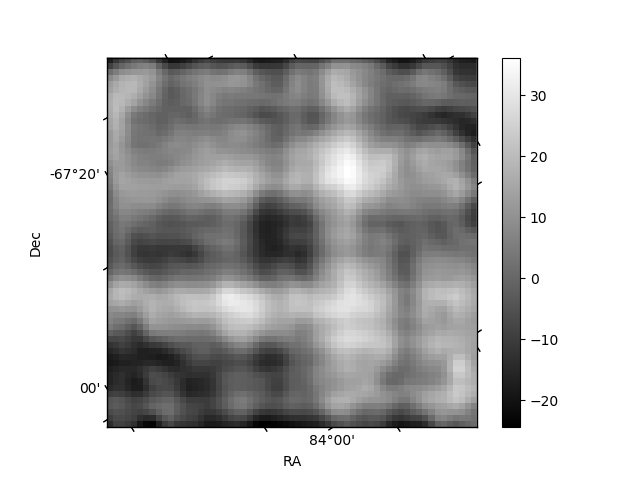
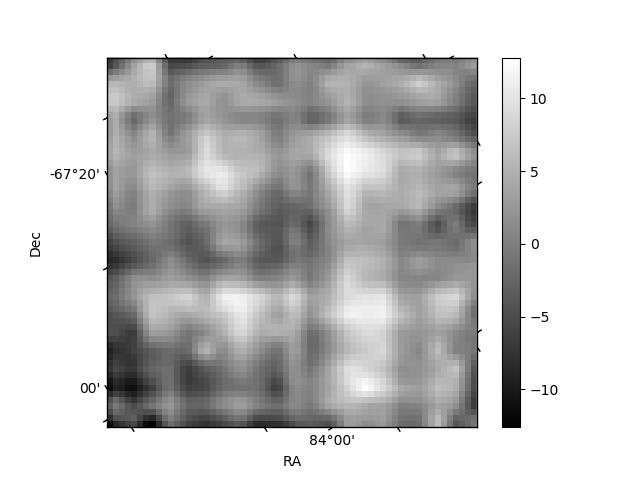
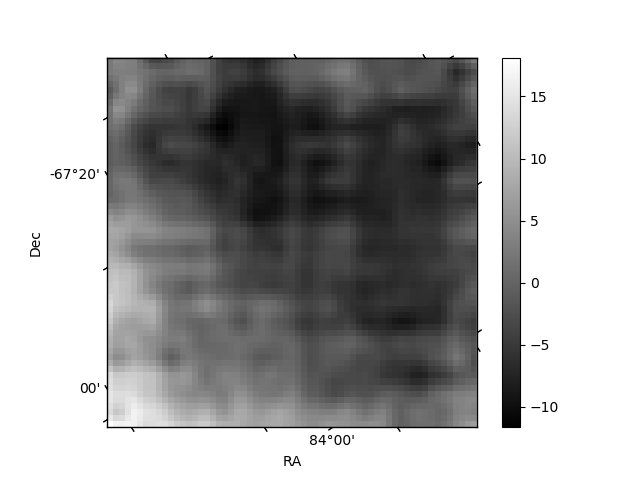
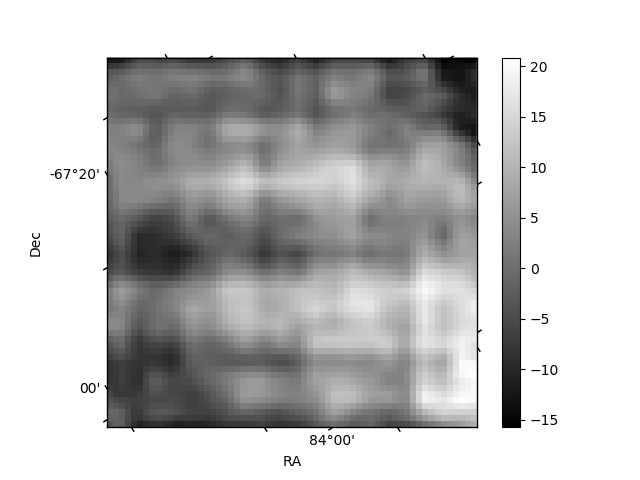
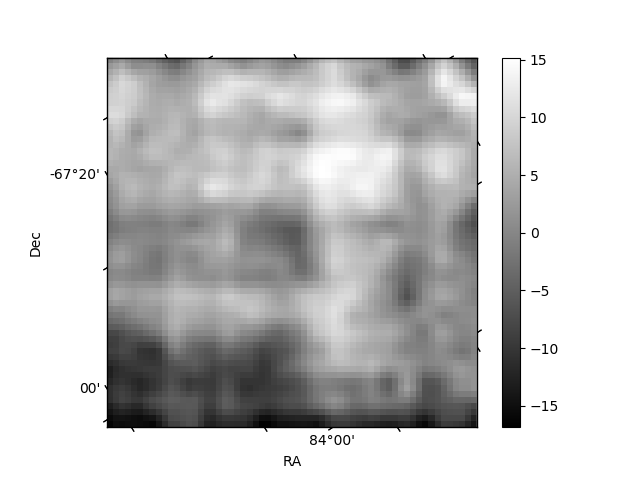
Histogram calculated using DETX and DETY for each event in the final _common_clean file
| Quadrant A | 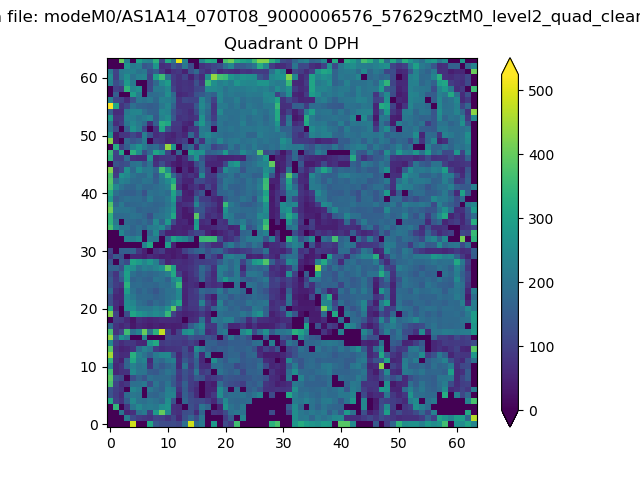 |
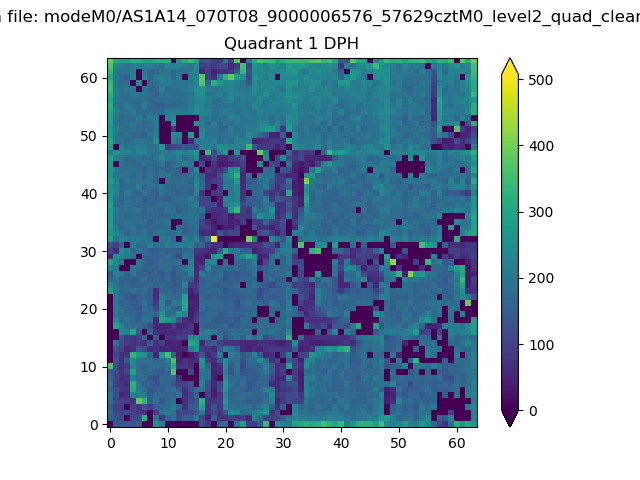 |
Quadrant B |
|---|---|---|---|
| Quadrant D | 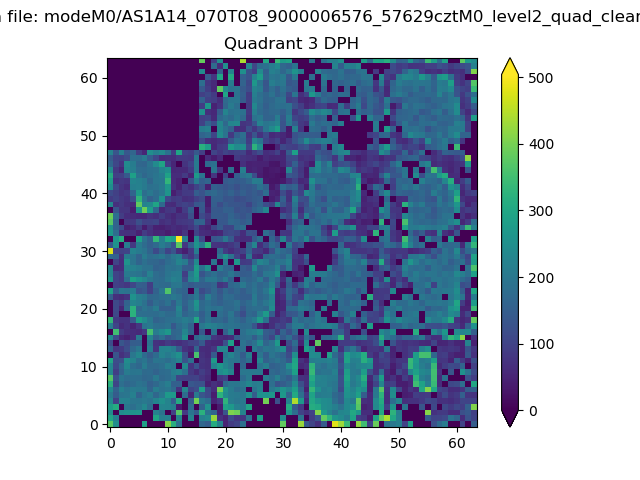 |
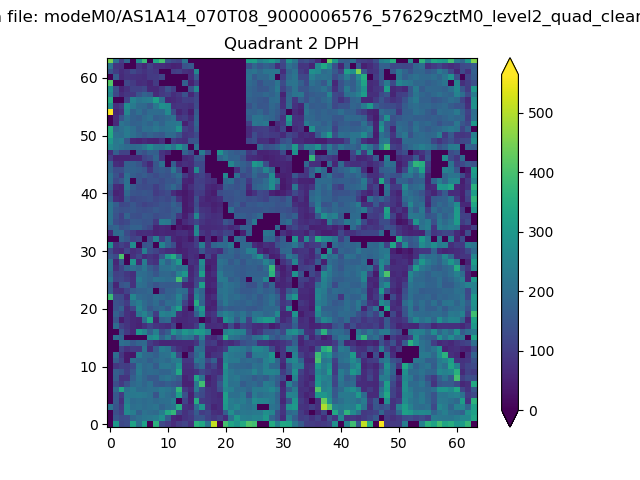 |
Quadrant C |
| Plot type | Count rate plots | Images |
|---|---|---|
| Comparison with Poisson distribution Blue bars denote a histogram of data divided into 1 sec bins. Red curve is a Poisson curve with rate = median count rate of data. |
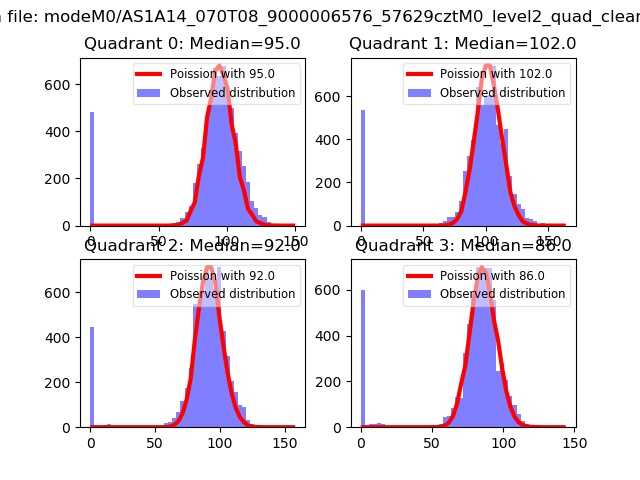 |
 |
| Quadrant-wise count rates Data is divided into 100 sec bins |
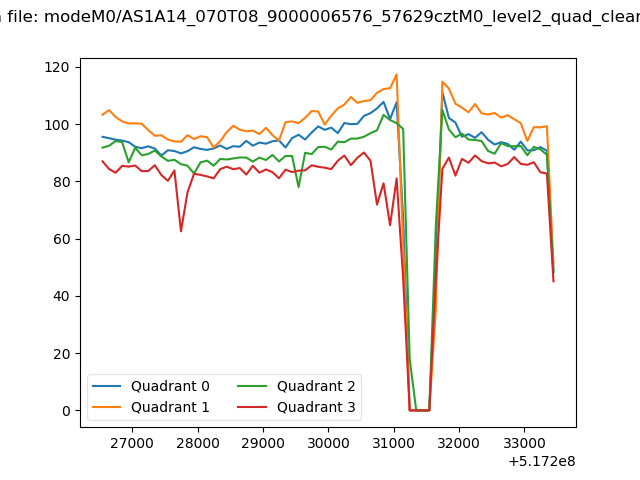 |
|
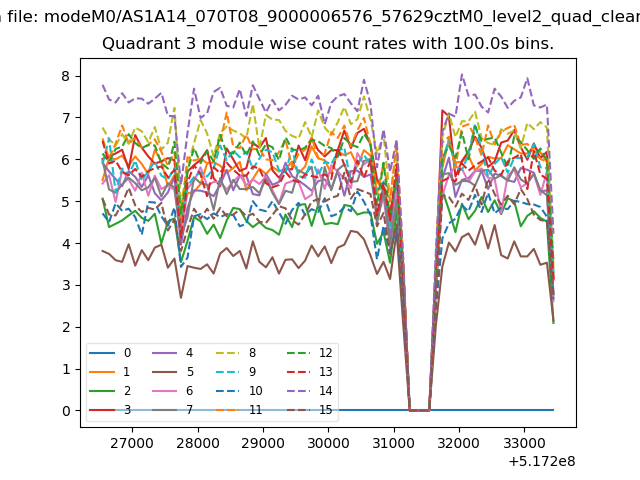
| Module-wise count rates for Quadrant A Data is divided into 100 sec bins |
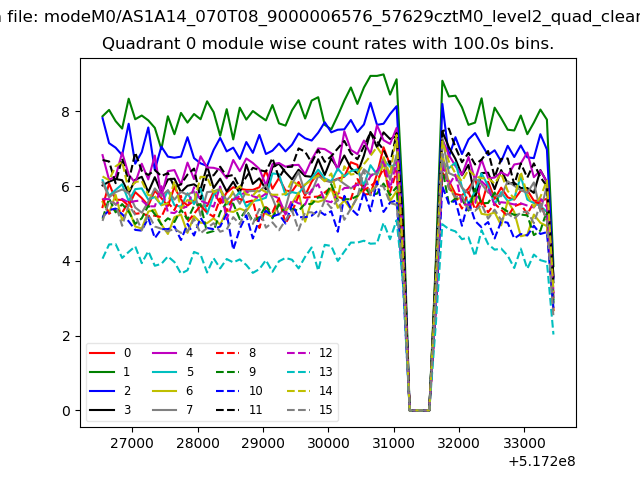 |
 |
| Module-wise count rates for Quadrant B Data is divided into 100 sec bins |
 |
 |
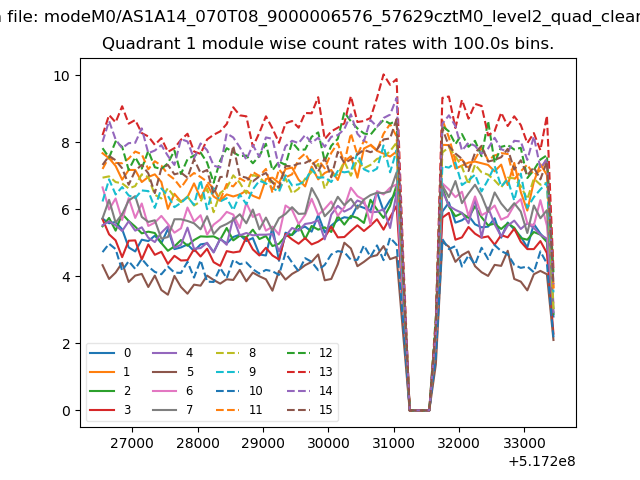
| Module-wise count rates for Quadrant C Data is divided into 100 sec bins |
 |
 |
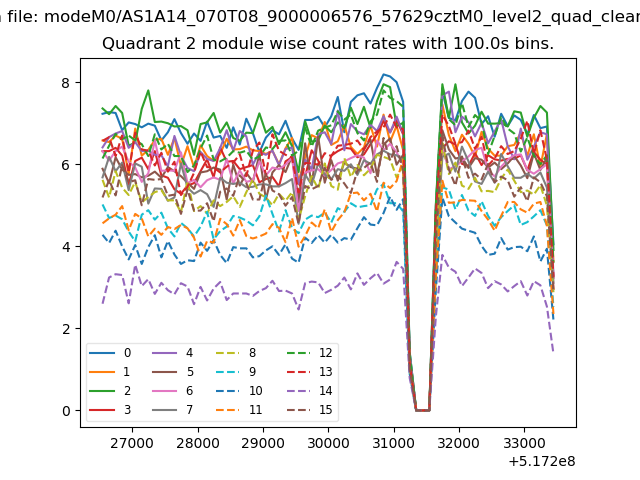
| Module-wise count rates for Quadrant D Data is divided into 100 sec bins |
 |
 |
| Parameter | Plot |
|---|---|
| CZT HV Monitor | 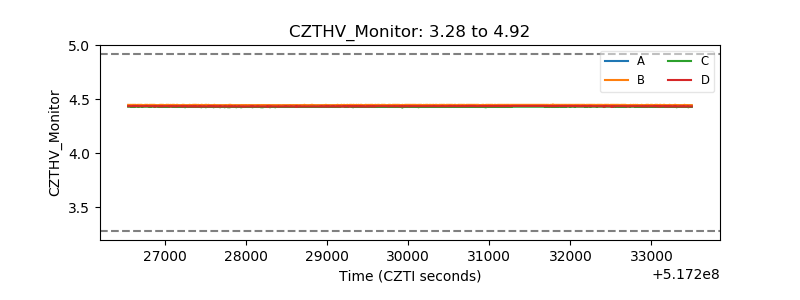 |
| D_VDD | 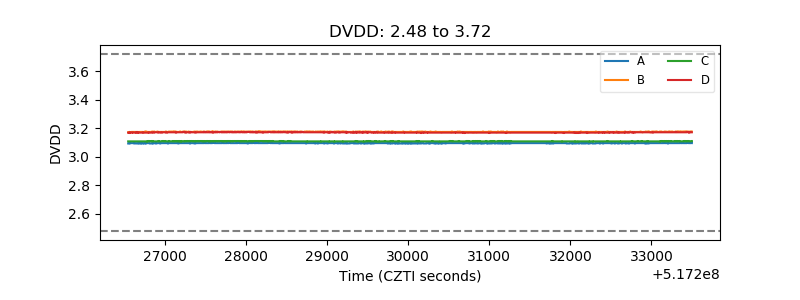 |
| Temperature 1 | 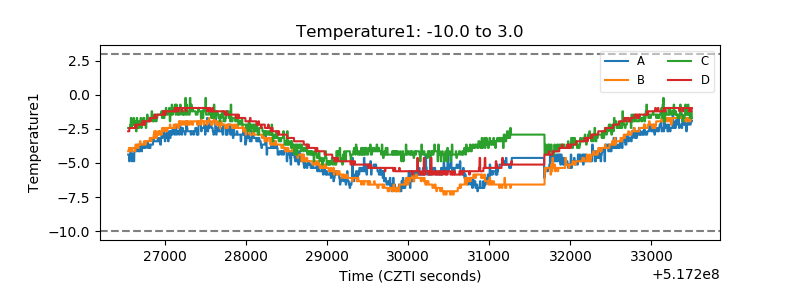 |
| Veto HV Monitor | 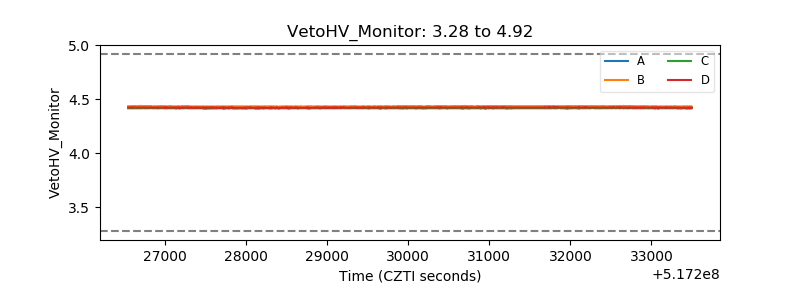 |
| Veto LLD | 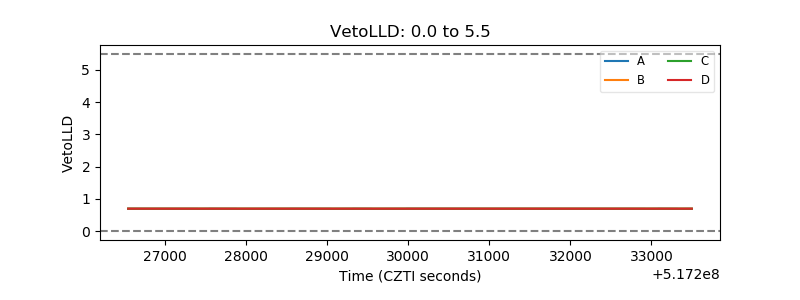 |
| Alpha Counter | 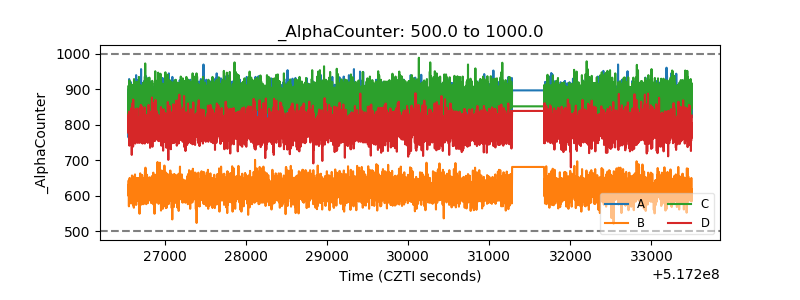 |
| _CPM_Rate | 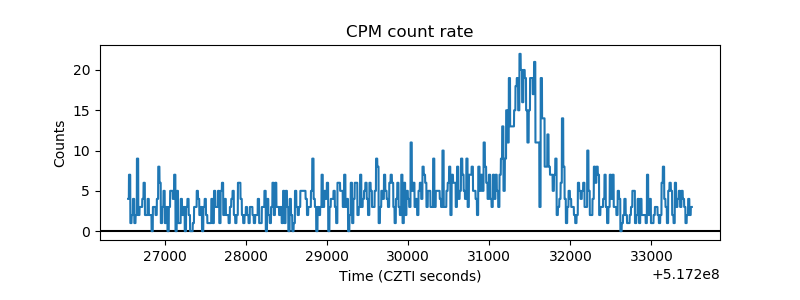 |
| CZT Counter | 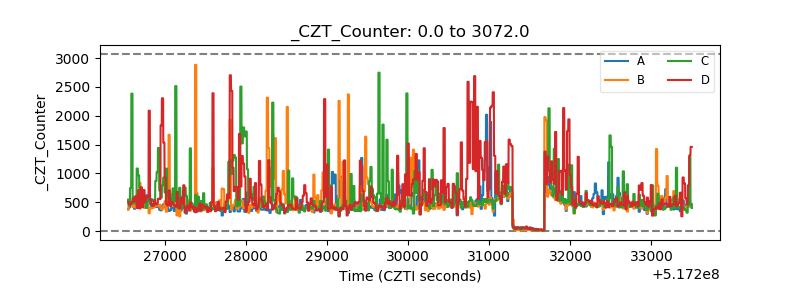 |
| +2.5 Volts monitor | 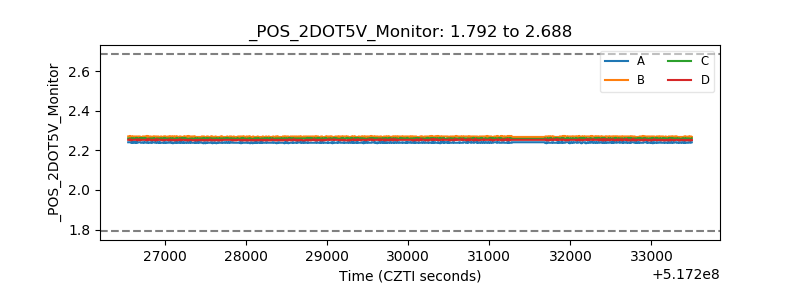 |
| +5 Volts monitor |  |
| _ROLL_ROT | 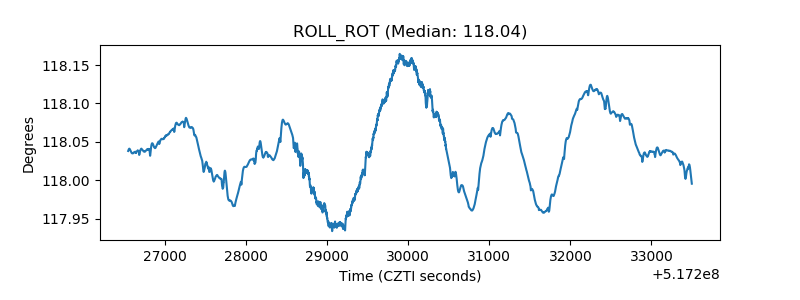 |
| _Roll_DEC | 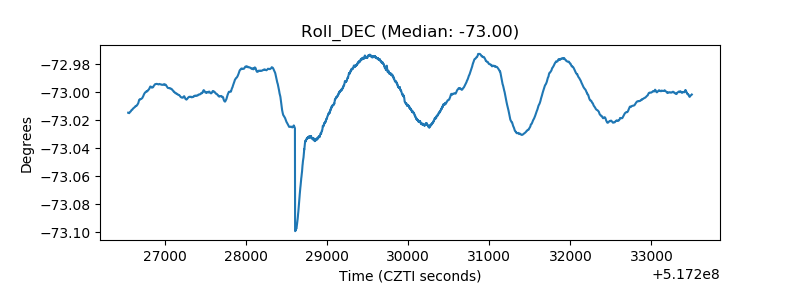 |
| _Roll_RA | 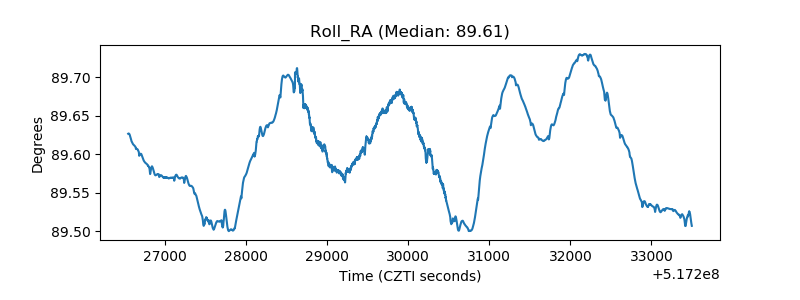 |
| Veto Counter | 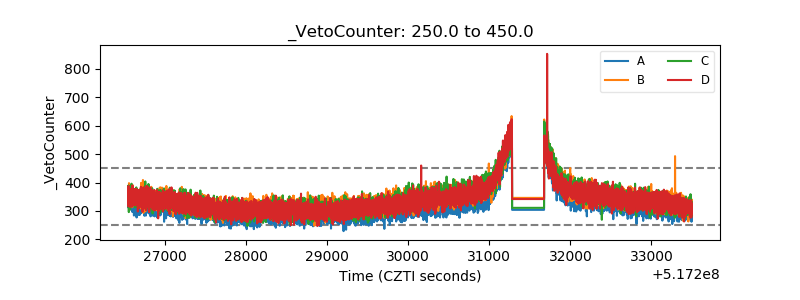 |