| Param | Original file | Final file |
|---|---|---|
| Filename | modeM0/AS1A14_070T08_9000006576_57630cztM0_level2.fits | modeM0/AS1A14_070T08_9000006576_57630cztM0_level2_quad_clean.evt |
| Size (bytes) | 421,770,240 | 103,006,080 |
| Size | 402.2 MB | 98.2 MB |
| Events in quadrant A | 3,355,604 | 671,404 |
| Events in quadrant B | 3,555,044 | 715,290 |
| Events in quadrant C | 3,475,241 | 645,296 |
| Events in quadrant D | 4,677,987 | 595,805 |
| Mode M0 | |||
|---|---|---|---|
| Quadrant | BADHDUFLAG | Total packets | Discarded packets |
| A | 0 | 14991 | 0 |
| B | 0 | 15491 | 0 |
| C | 0 | 15562 | 0 |
| D | 0 | 18764 | 3 |
| Mode SS | |||
|---|---|---|---|
| Quadrant | BADHDUFLAG | Total packets | Discarded packets |
| A | 0 | 140 | 0 |
| B | 0 | 140 | 0 |
| C | 0 | 140 | 0 |
| D | 0 | 140 | 0 |
| Quadrant | Total seconds | Saturated seconds | Saturation percentage |
|---|---|---|---|
| A | 7055 | 22 | 0.311836% |
| B | 7056 | 95 | 1.346372% |
| C | 7056 | 52 | 0.736961% |
| D | 7055 | 188 | 2.664777% |
Noise dominated data is calculated using 1-second bins in cleaned event files. If a bin has >2000 counts, and if more than 50% of those come from <1% of pixels, then it is considered to be noise-dominated and hence unusable.
| Quadrant | # 1 sec bins | Bins with >0 counts | Bins with >2000 counts | High rate bins dominated by noise | Noise dominated (total time) | Noise dominated (detector-on time) | Marked lightcurve |
|---|---|---|---|---|---|---|---|
| A | 7056 | 7056 | 9 | 9 | 0.13% | 0.13% | 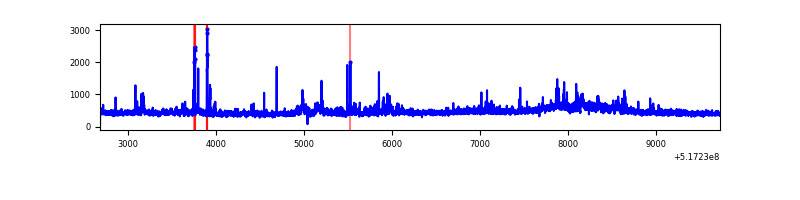 |
| B | 7057 | 7057 | 62 | 62 | 0.88% | 0.88% | 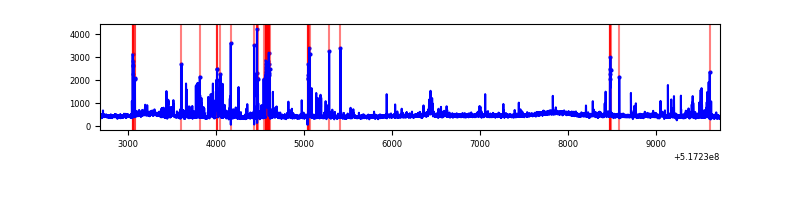 |
| C | 7057 | 7057 | 41 | 41 | 0.58% | 0.58% | 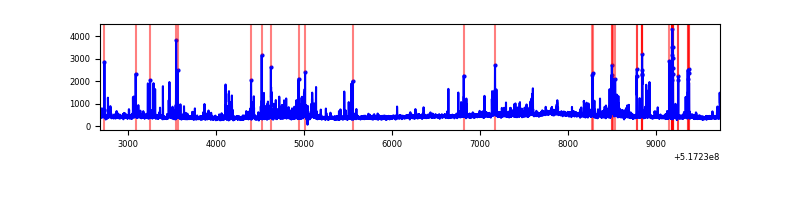 |
| D | 7056 | 7056 | 202 | 202 | 2.86% | 2.86% | 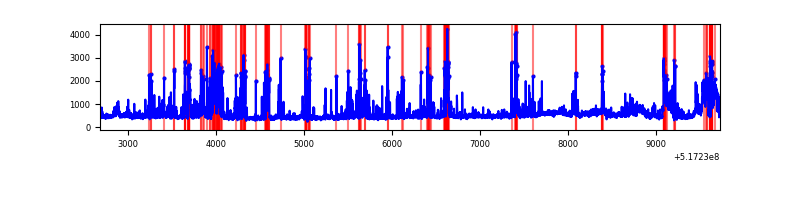 |
Top three noisy pixels from each quadrant. If the there are fewer than three noisy pixels in the level2.evt file, extra rows are filled as -1
| Pixel properties | Quadrant properties | ||||||
|---|---|---|---|---|---|---|---|
| Quadrant | DetID | PixID | Counts | Sigma | Mean | Median | Sigma |
| A | 7 | 64 | 241706 | 1297.71 | 757 | 737 | 185.7 |
| A | 8 | 9 | 63538 | 338.21 | 757 | 737 | 185.7 |
| A | 4 | 249 | 47942 | 254.22 | 757 | 737 | 185.7 |
| B | 10 | 247 | 222885 | 1398.97 | 746 | 717 | 158.8 |
| B | 0 | 245 | 97810 | 611.38 | 746 | 717 | 158.8 |
| B | 8 | 234 | 59220 | 368.39 | 746 | 717 | 158.8 |
| C | 15 | 224 | 369331 | 1854.16 | 733 | 726 | 198.8 |
| C | 14 | 254 | 86733 | 432.63 | 733 | 726 | 198.8 |
| C | 12 | 2 | 68500 | 340.92 | 733 | 726 | 198.8 |
| D | 8 | 160 | 681330 | 3304.07 | 728 | 695 | 206.0 |
| D | 2 | 249 | 276690 | 1339.79 | 728 | 695 | 206.0 |
| D | 15 | 142 | 128934 | 622.52 | 728 | 695 | 206.0 |
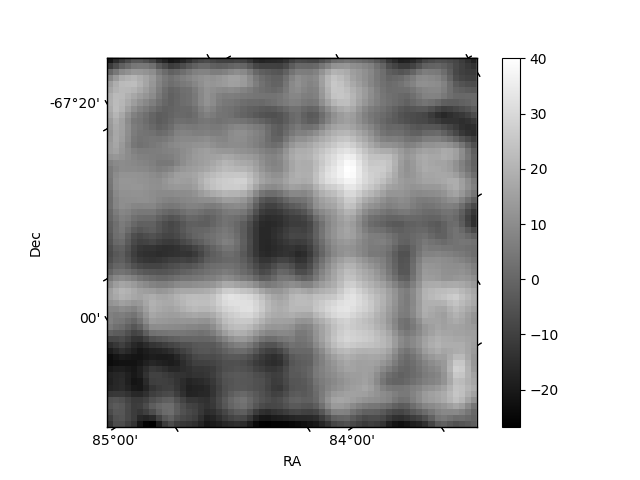
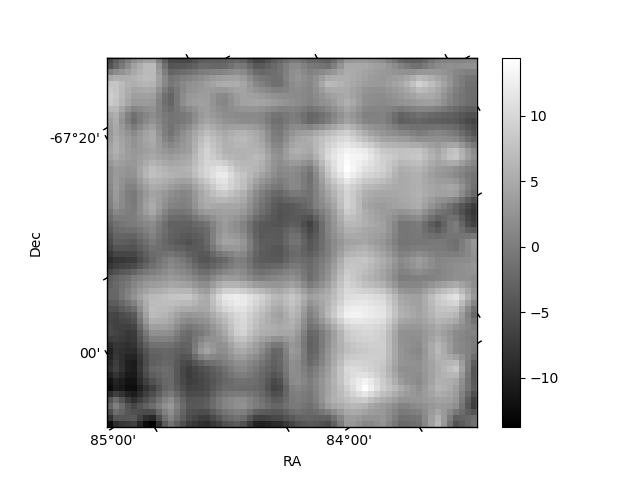
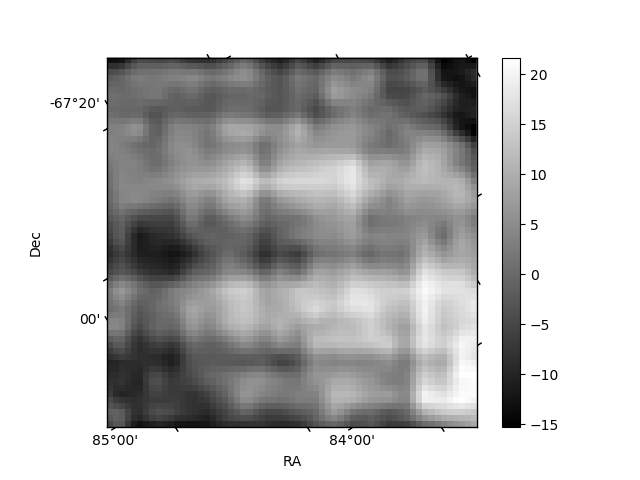
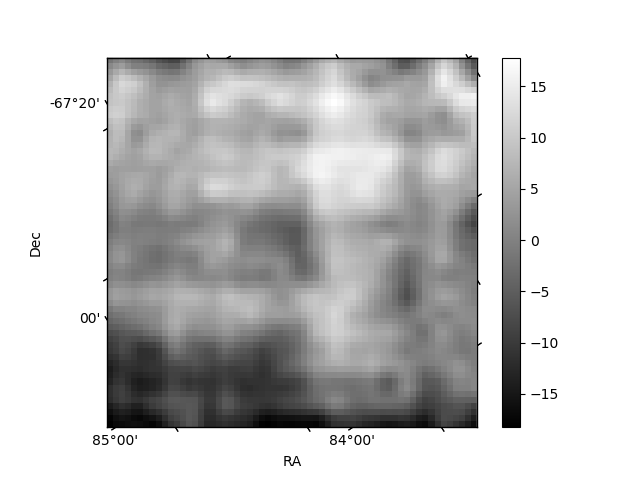
Histogram calculated using DETX and DETY for each event in the final _common_clean file
| Quadrant A | 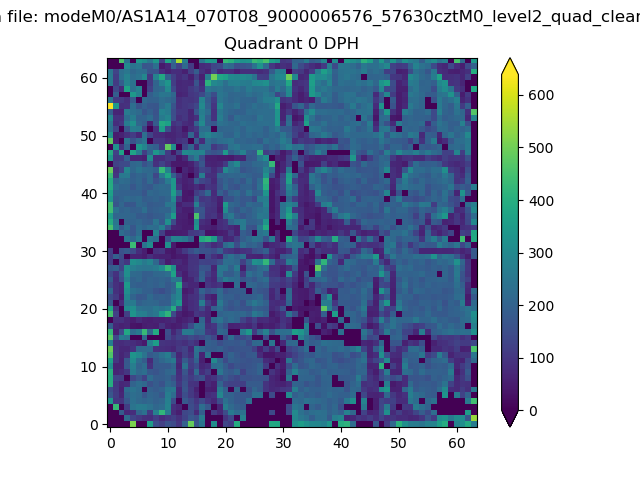 |
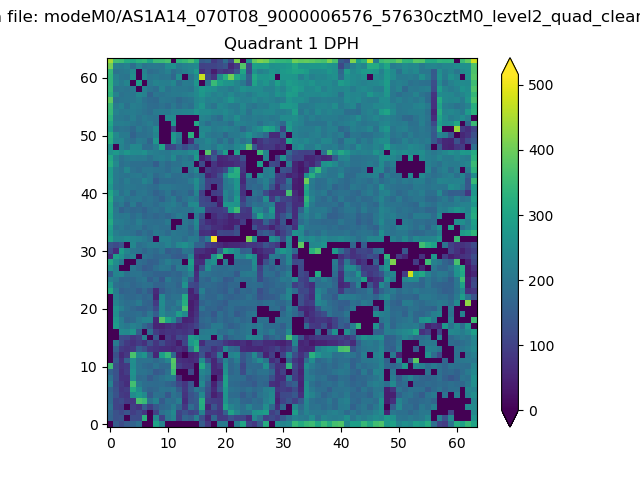 |
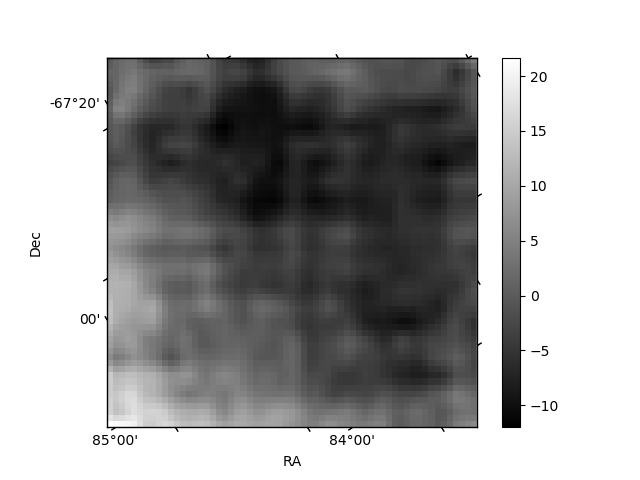
Quadrant B |
|---|---|---|---|
| Quadrant D | 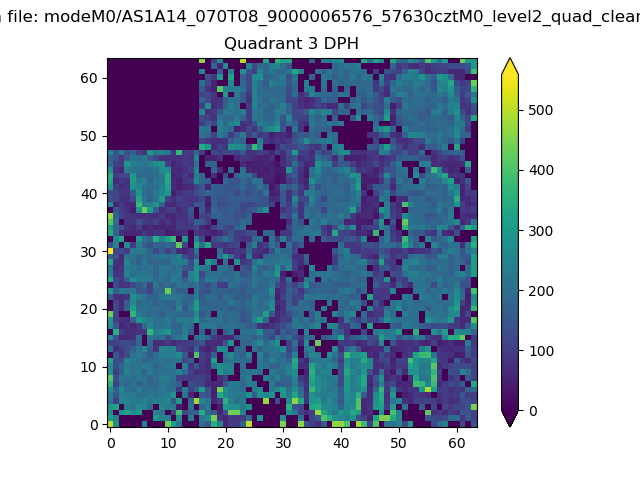 |
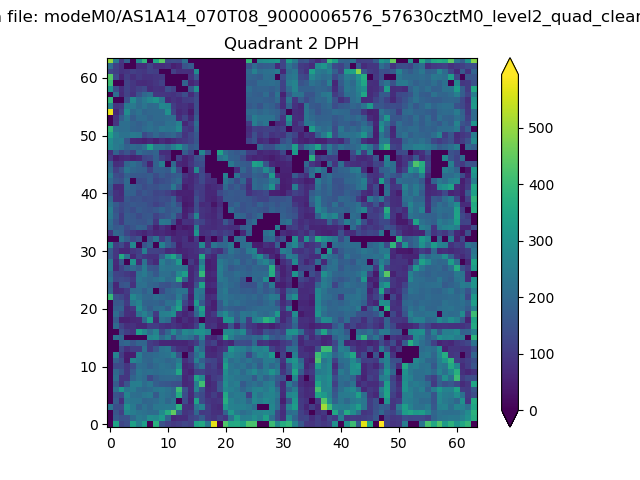 |
Quadrant C |
| Plot type | Count rate plots | Images |
|---|---|---|
| Comparison with Poisson distribution Blue bars denote a histogram of data divided into 1 sec bins. Red curve is a Poisson curve with rate = median count rate of data. |
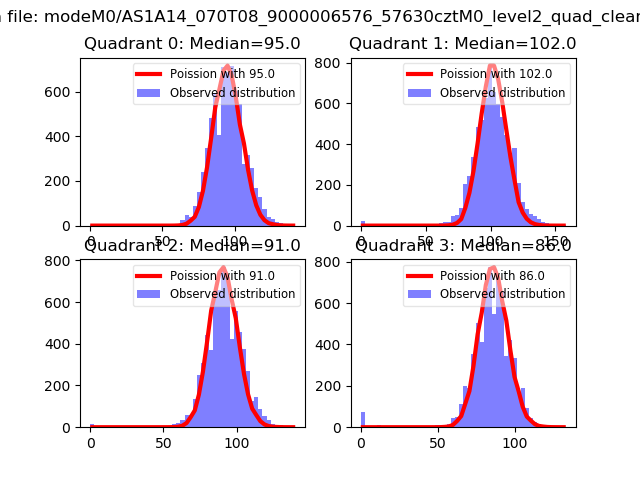 |
 |
| Quadrant-wise count rates Data is divided into 100 sec bins |
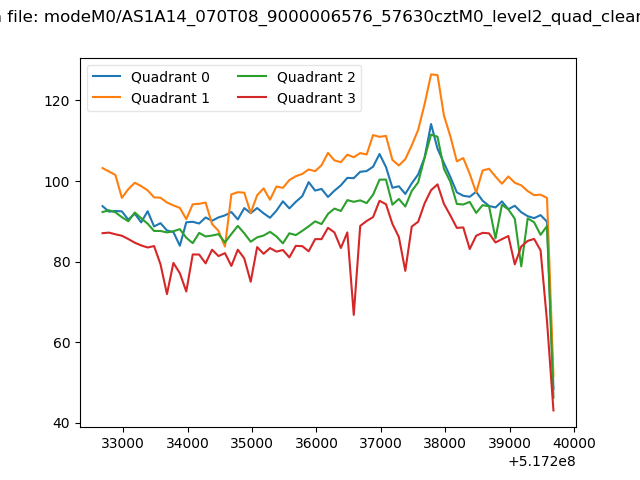 |
|
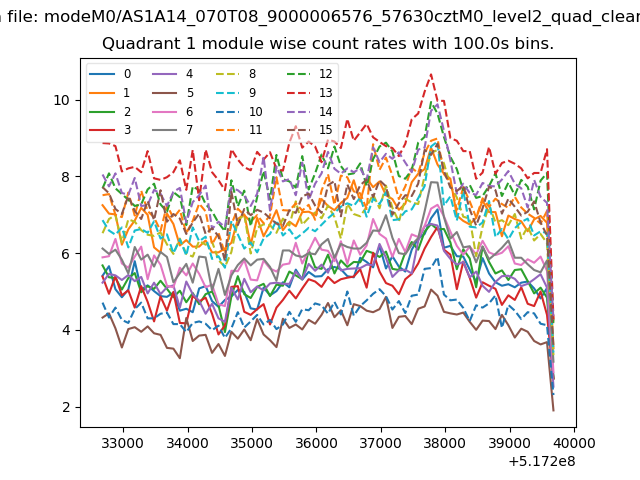
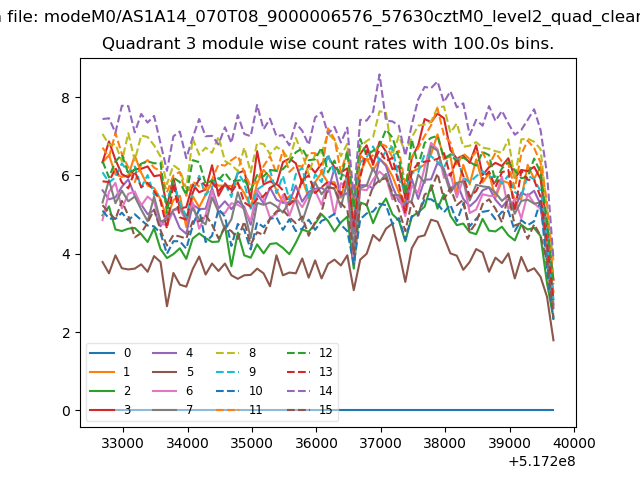
| Module-wise count rates for Quadrant A Data is divided into 100 sec bins |
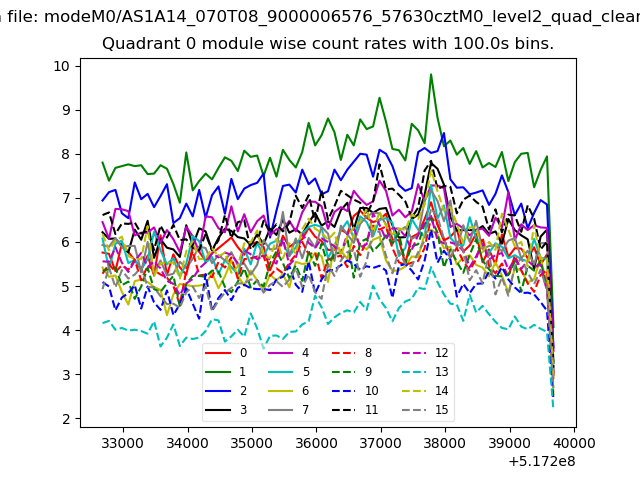 |
 |
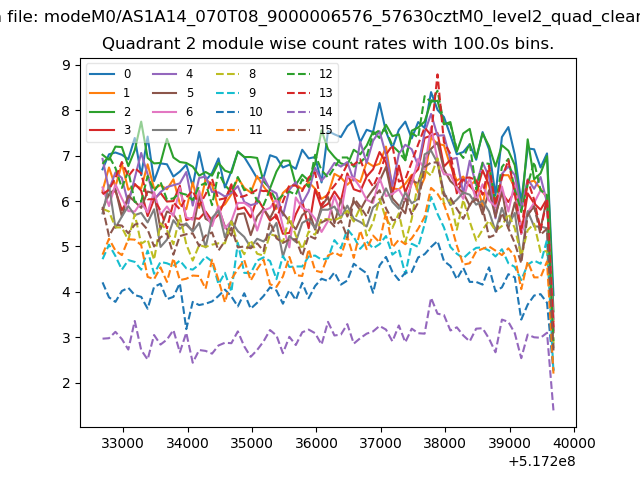
| Module-wise count rates for Quadrant B Data is divided into 100 sec bins |
 |
 |
| Module-wise count rates for Quadrant C Data is divided into 100 sec bins |
 |
 |
| Module-wise count rates for Quadrant D Data is divided into 100 sec bins |
 |
 |
| Parameter | Plot |
|---|---|
| CZT HV Monitor |  |
| D_VDD | 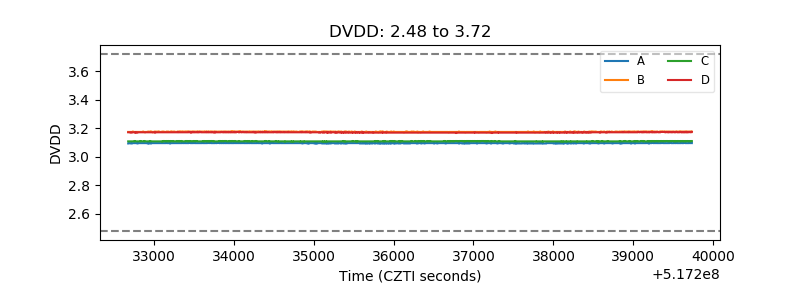 |
| Temperature 1 | 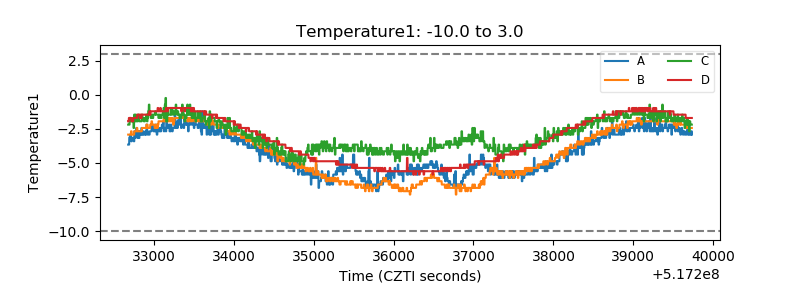 |
| Veto HV Monitor | 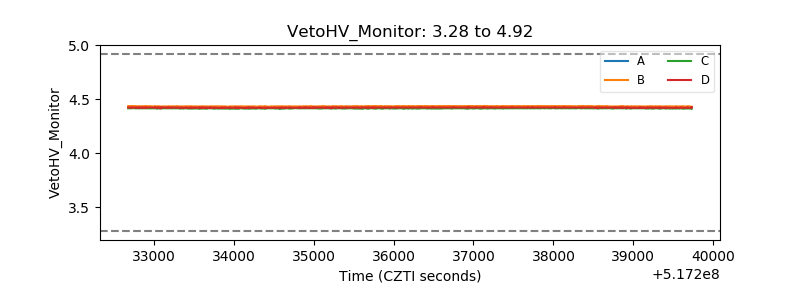 |
| Veto LLD | 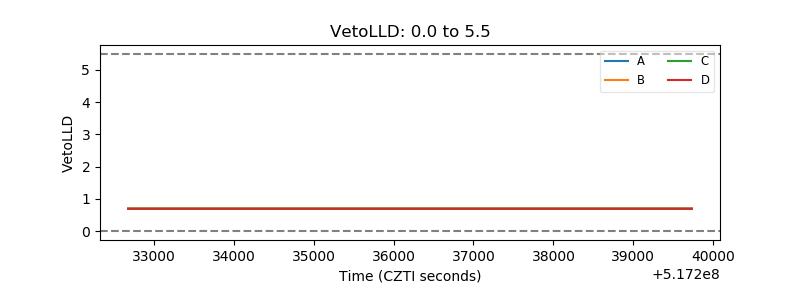 |
| Alpha Counter | 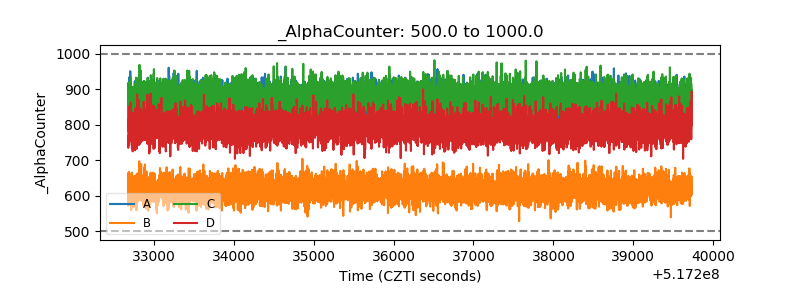 |
| _CPM_Rate | 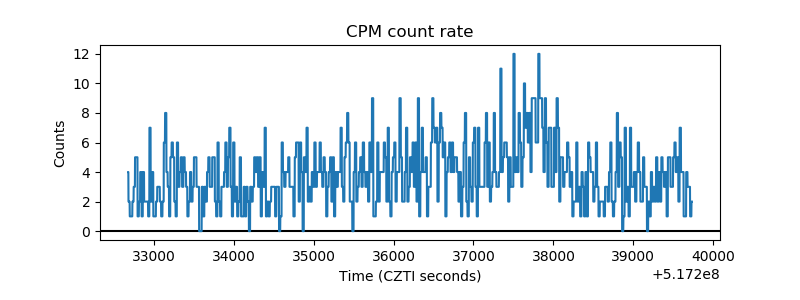 |
| CZT Counter | 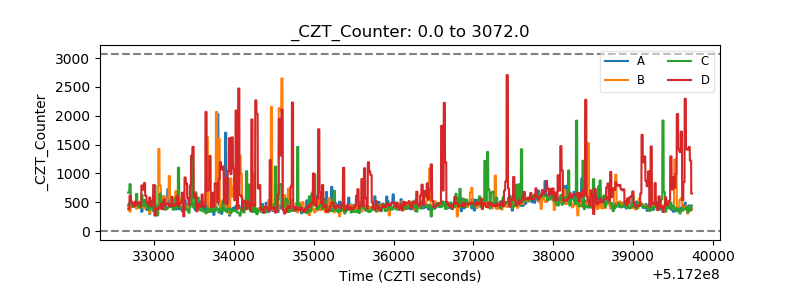 |
| +2.5 Volts monitor |  |
| +5 Volts monitor |  |
| _ROLL_ROT | 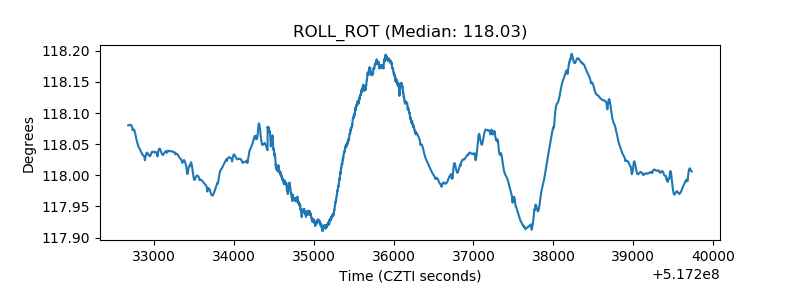 |
| _Roll_DEC | 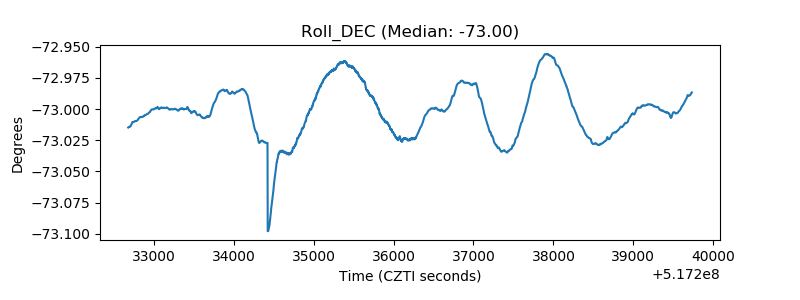 |
| _Roll_RA | 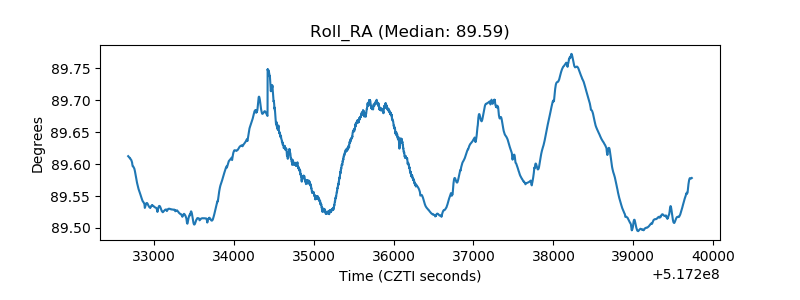 |
| Veto Counter | 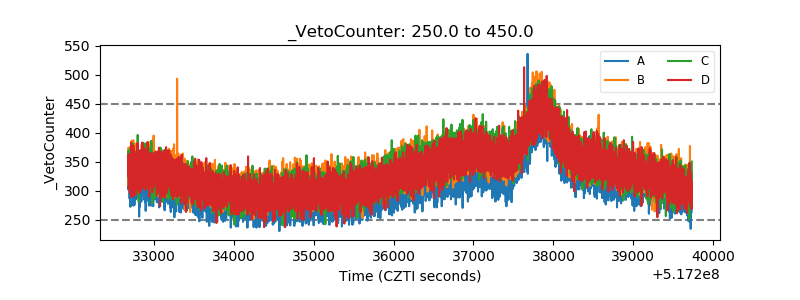 |