| Param | Original file | Final file |
|---|---|---|
| Filename | modeM0/AS1A14_070T08_9000006576_57631cztM0_level2.fits | modeM0/AS1A14_070T08_9000006576_57631cztM0_level2_quad_clean.evt |
| Size (bytes) | 418,207,680 | 101,977,920 |
| Size | 398.8 MB | 97.3 MB |
| Events in quadrant A | 3,115,324 | 665,764 |
| Events in quadrant B | 3,283,446 | 713,423 |
| Events in quadrant C | 3,724,515 | 629,541 |
| Events in quadrant D | 4,811,020 | 589,687 |
| Mode M0 | |||
|---|---|---|---|
| Quadrant | BADHDUFLAG | Total packets | Discarded packets |
| A | 0 | 14473 | 0 |
| B | 0 | 14855 | 0 |
| C | 0 | 16207 | 0 |
| D | 0 | 18966 | 0 |
| Mode SS | |||
|---|---|---|---|
| Quadrant | BADHDUFLAG | Total packets | Discarded packets |
| A | 0 | 142 | 0 |
| B | 0 | 142 | 0 |
| C | 0 | 142 | 0 |
| D | 0 | 142 | 0 |
| Quadrant | Total seconds | Saturated seconds | Saturation percentage |
|---|---|---|---|
| A | 7021 | 20 | 0.284860% |
| B | 7022 | 51 | 0.726289% |
| C | 7022 | 145 | 2.064939% |
| D | 7022 | 246 | 3.503275% |
Noise dominated data is calculated using 1-second bins in cleaned event files. If a bin has >2000 counts, and if more than 50% of those come from <1% of pixels, then it is considered to be noise-dominated and hence unusable.
| Quadrant | # 1 sec bins | Bins with >0 counts | Bins with >2000 counts | High rate bins dominated by noise | Noise dominated (total time) | Noise dominated (detector-on time) | Marked lightcurve |
|---|---|---|---|---|---|---|---|
| A | 7021 | 7021 | 8 | 8 | 0.11% | 0.11% | 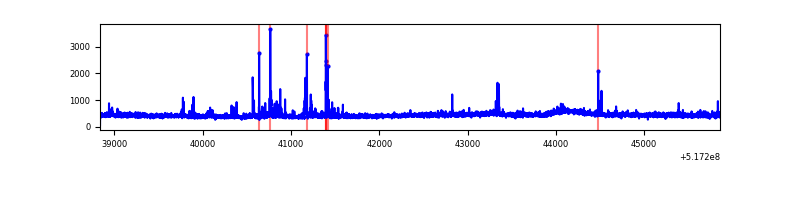 |
| B | 7022 | 7022 | 20 | 20 | 0.28% | 0.28% | 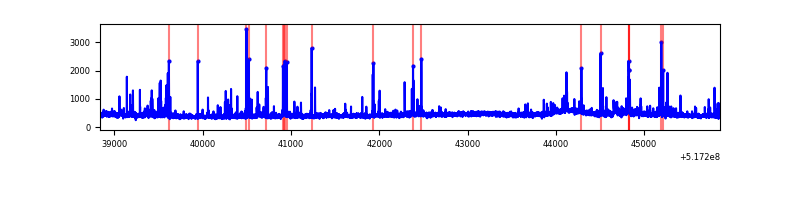 |
| C | 7022 | 7022 | 119 | 119 | 1.69% | 1.69% | 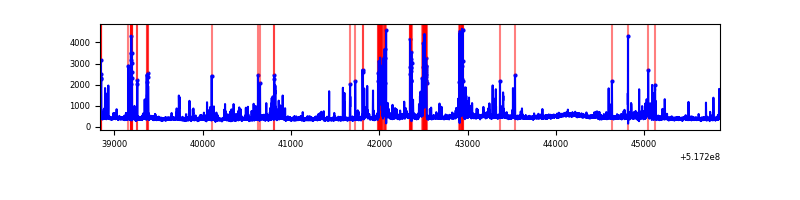 |
| D | 7022 | 7022 | 252 | 252 | 3.59% | 3.59% | 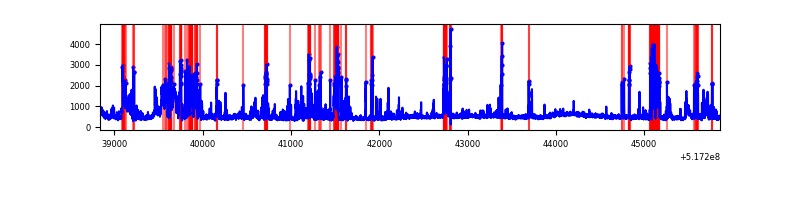 |
Top three noisy pixels from each quadrant. If the there are fewer than three noisy pixels in the level2.evt file, extra rows are filled as -1
| Pixel properties | Quadrant properties | ||||||
|---|---|---|---|---|---|---|---|
| Quadrant | DetID | PixID | Counts | Sigma | Mean | Median | Sigma |
| A | 10 | 251 | 69214 | 367.62 | 753 | 735 | 186.3 |
| A | 3 | 245 | 60938 | 323.19 | 753 | 735 | 186.3 |
| A | 4 | 249 | 29801 | 156.04 | 753 | 735 | 186.3 |
| B | 0 | 245 | 76783 | 473.48 | 743 | 714 | 160.7 |
| B | 7 | 252 | 58253 | 358.14 | 743 | 714 | 160.7 |
| B | 5 | 185 | 57017 | 350.45 | 743 | 714 | 160.7 |
| C | 12 | 2 | 392756 | 2001.24 | 721 | 713 | 195.9 |
| C | 15 | 224 | 278119 | 1416.06 | 721 | 713 | 195.9 |
| C | 14 | 254 | 121899 | 618.61 | 721 | 713 | 195.9 |
| D | 8 | 160 | 766552 | 3766.65 | 719 | 687 | 203.3 |
| D | 3 | 12 | 367679 | 1804.93 | 719 | 687 | 203.3 |
| D | 8 | 240 | 224345 | 1099.99 | 719 | 687 | 203.3 |
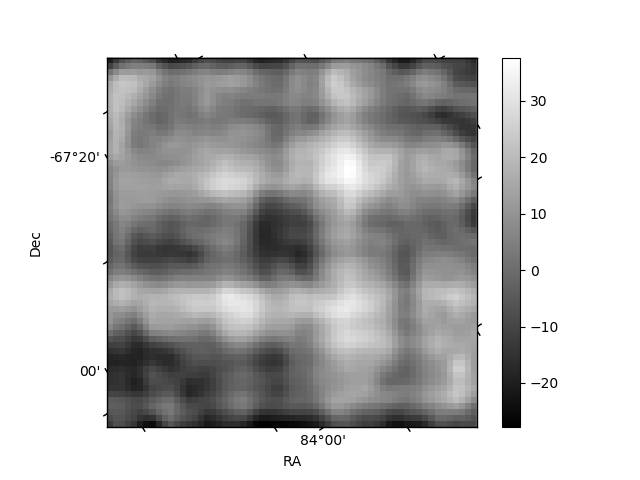
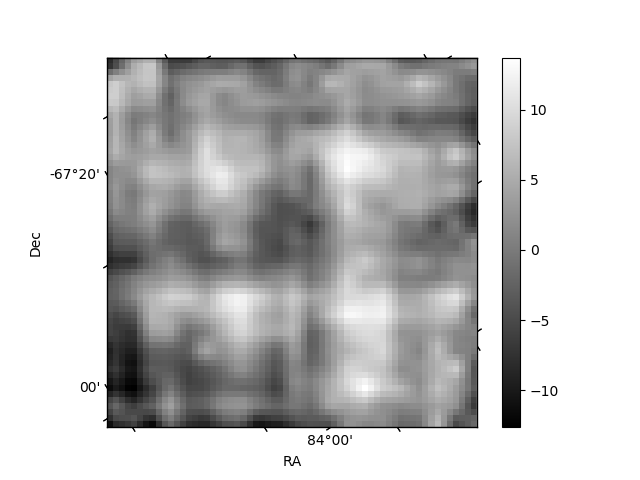
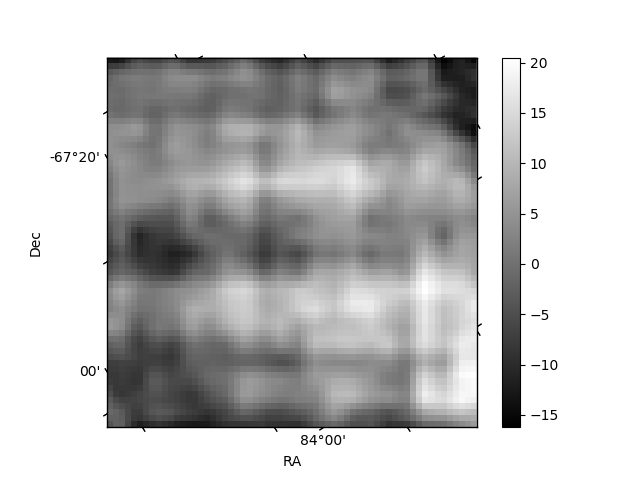
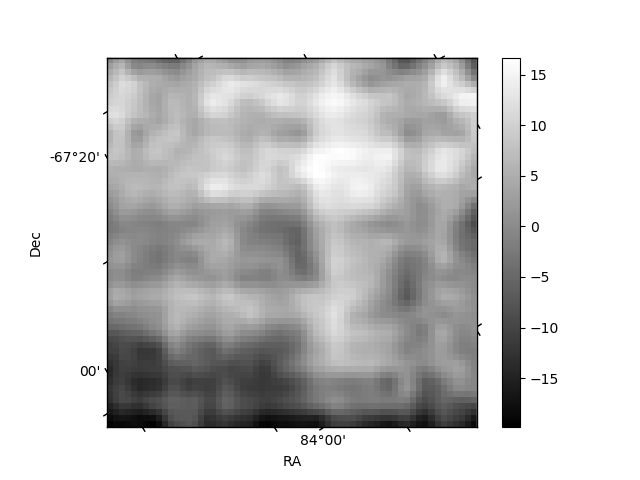
Histogram calculated using DETX and DETY for each event in the final _common_clean file
| Quadrant A | 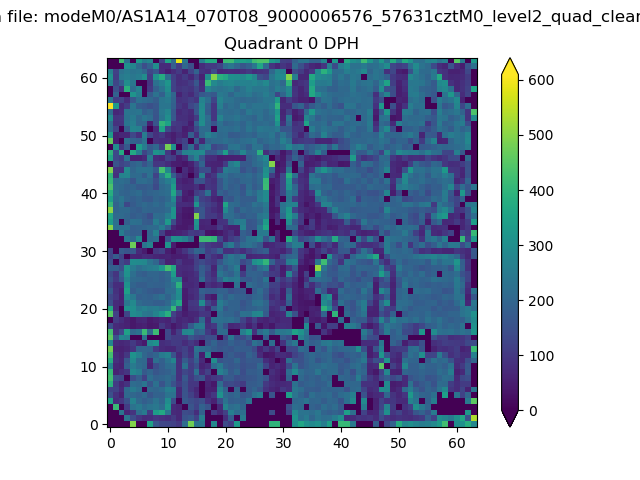 |
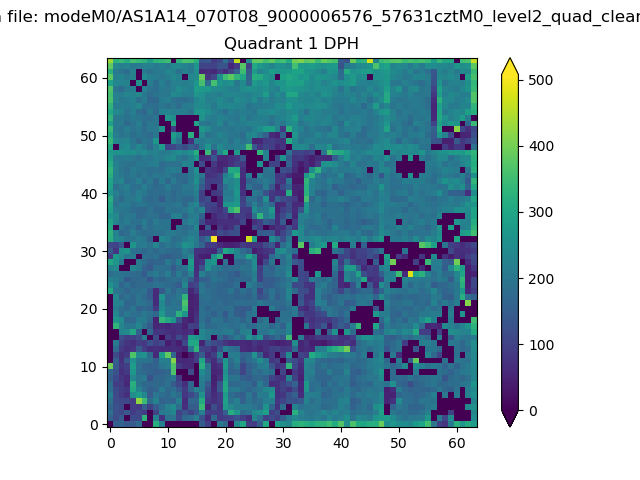 |
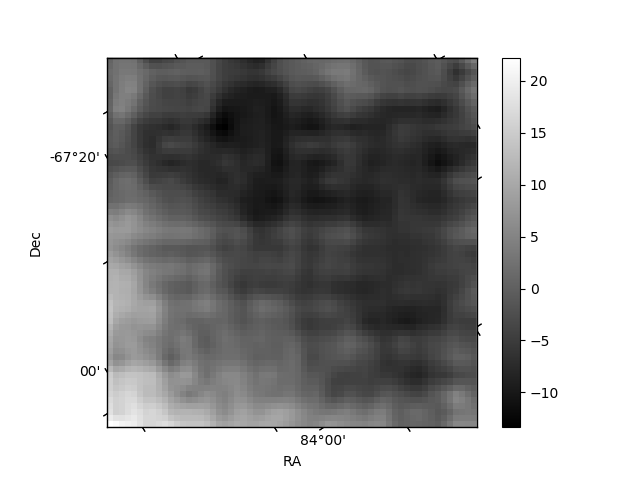
Quadrant B |
|---|---|---|---|
| Quadrant D | 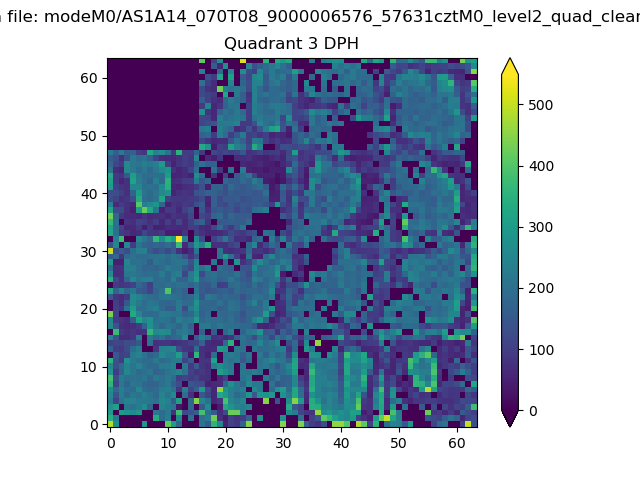 |
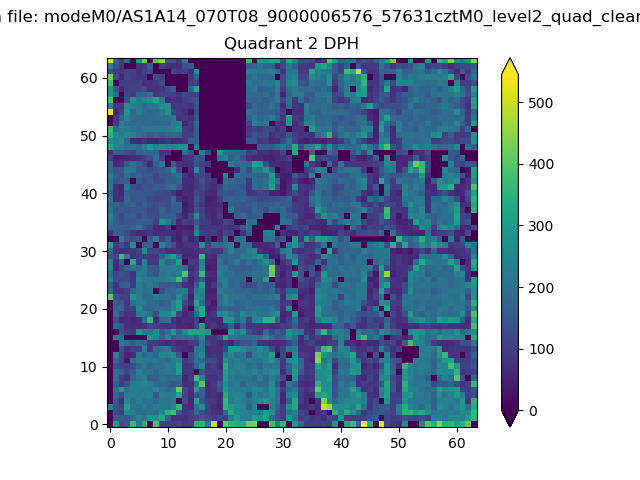 |
Quadrant C |
| Plot type | Count rate plots | Images |
|---|---|---|
| Comparison with Poisson distribution Blue bars denote a histogram of data divided into 1 sec bins. Red curve is a Poisson curve with rate = median count rate of data. |
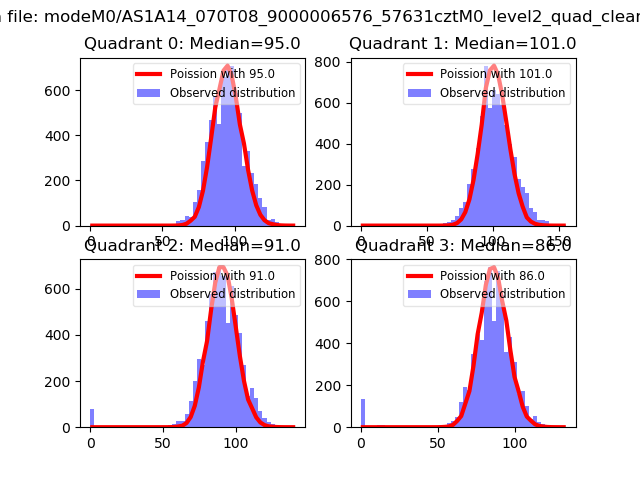 |
 |
| Quadrant-wise count rates Data is divided into 100 sec bins |
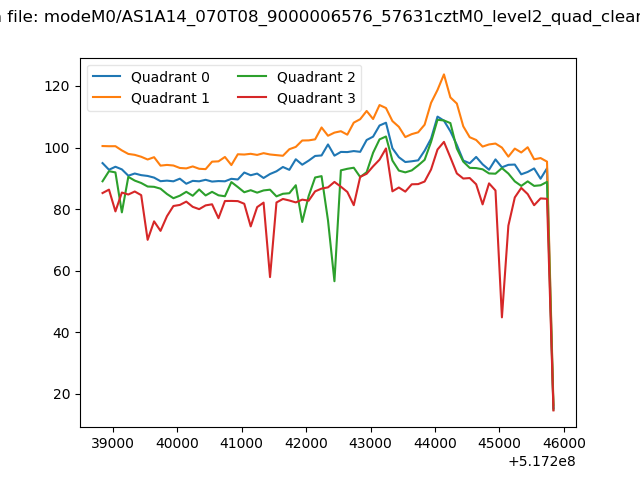 |
|
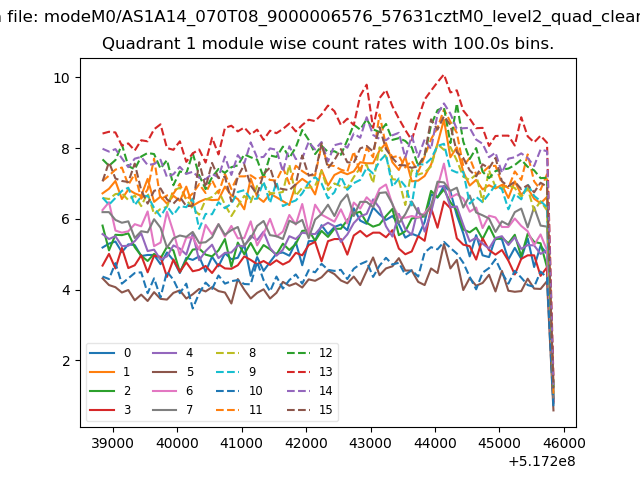
| Module-wise count rates for Quadrant A Data is divided into 100 sec bins |
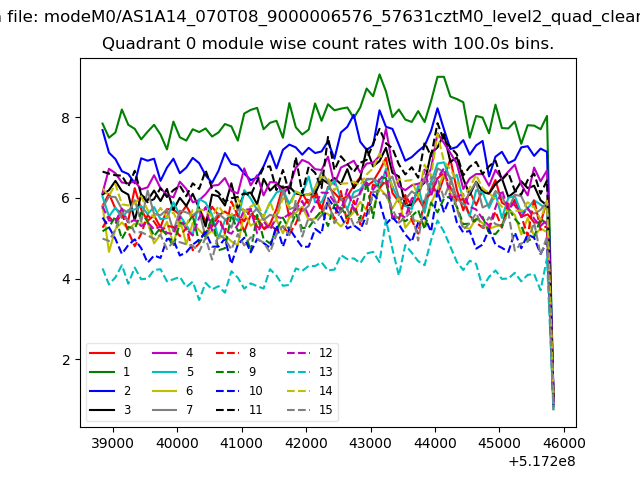 |
 |
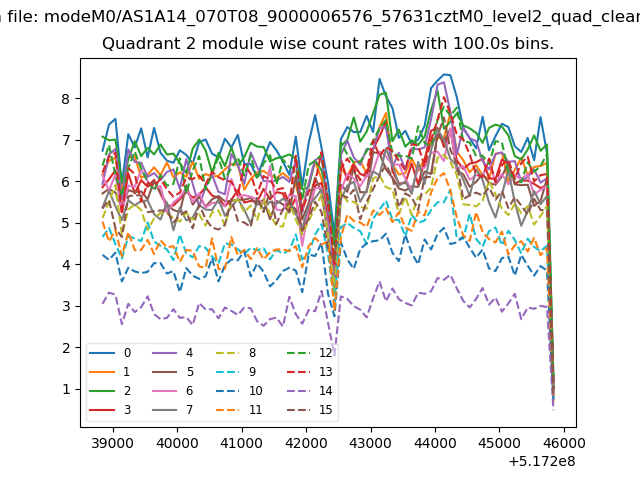
| Module-wise count rates for Quadrant B Data is divided into 100 sec bins |
 |
 |
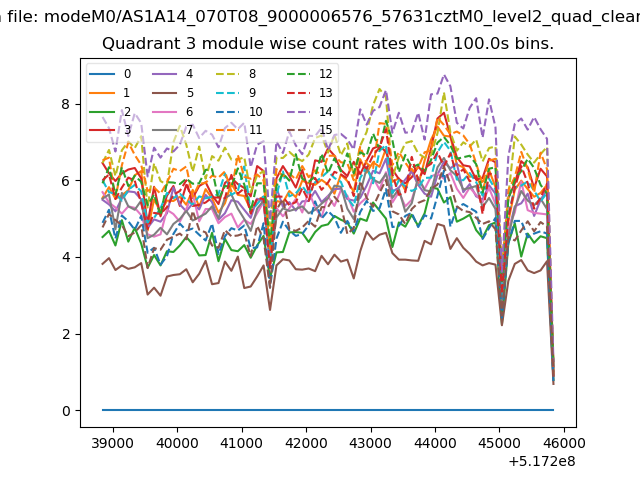
| Module-wise count rates for Quadrant C Data is divided into 100 sec bins |
 |
 |
| Module-wise count rates for Quadrant D Data is divided into 100 sec bins |
 |
 |
| Parameter | Plot |
|---|---|
| CZT HV Monitor | 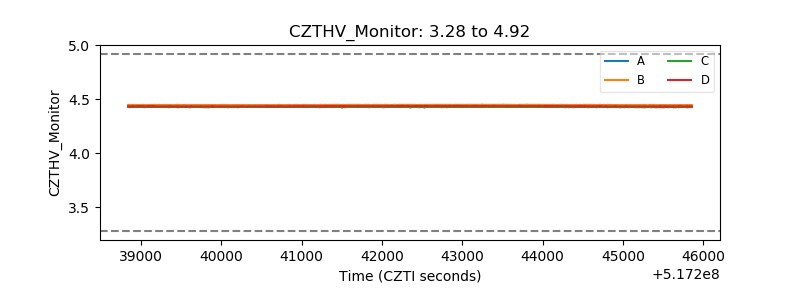 |
| D_VDD | 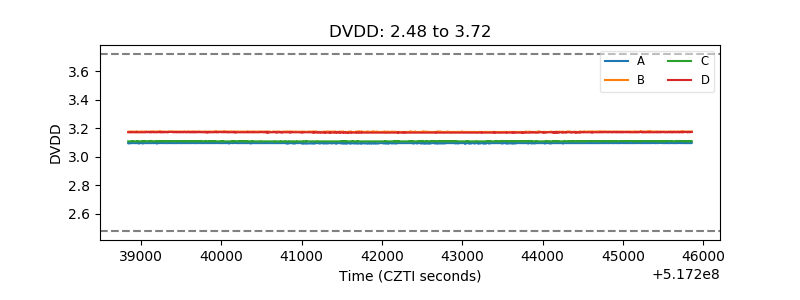 |
| Temperature 1 | 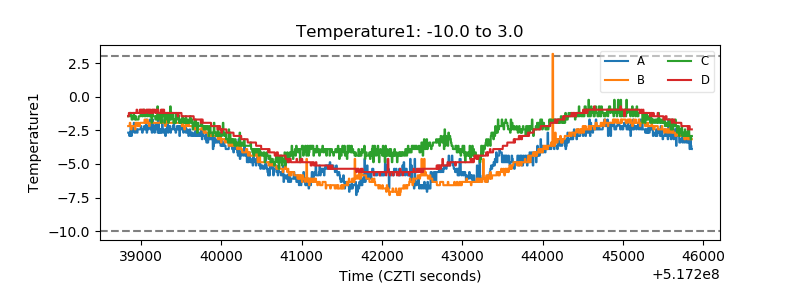 |
| Veto HV Monitor |  |
| Veto LLD | 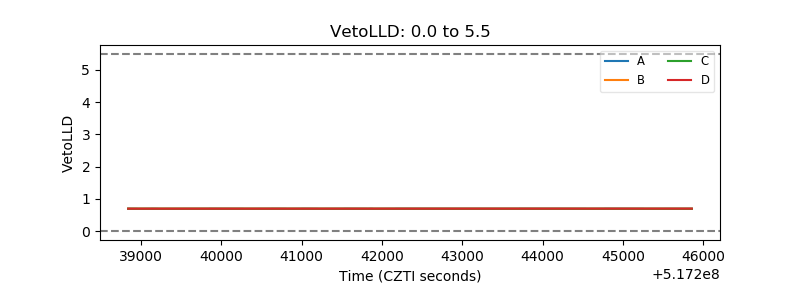 |
| Alpha Counter | 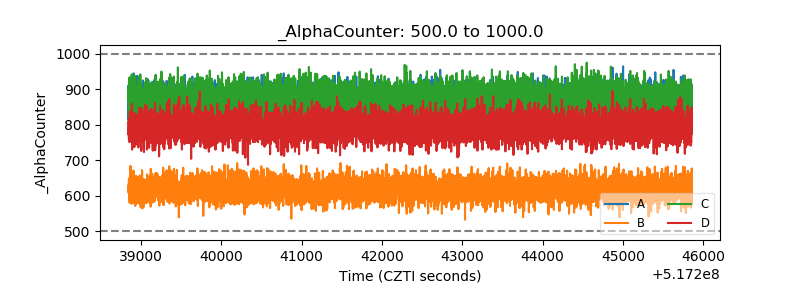 |
| _CPM_Rate | 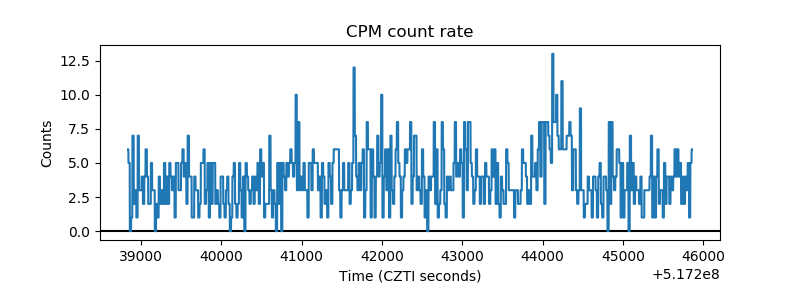 |
| CZT Counter | 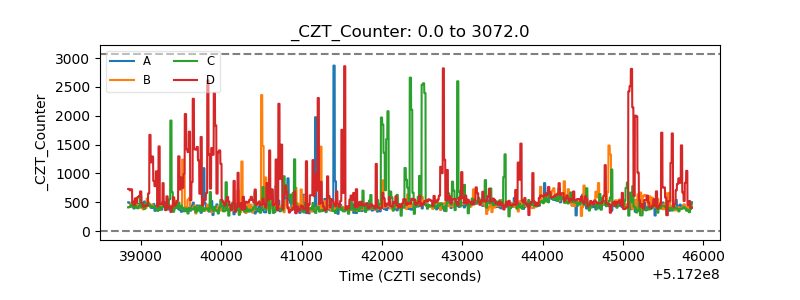 |
| +2.5 Volts monitor | 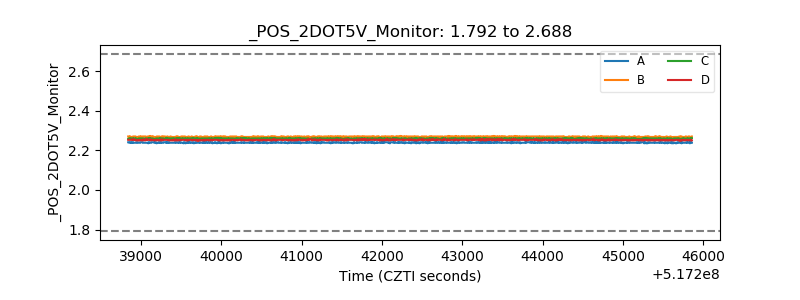 |
| +5 Volts monitor | 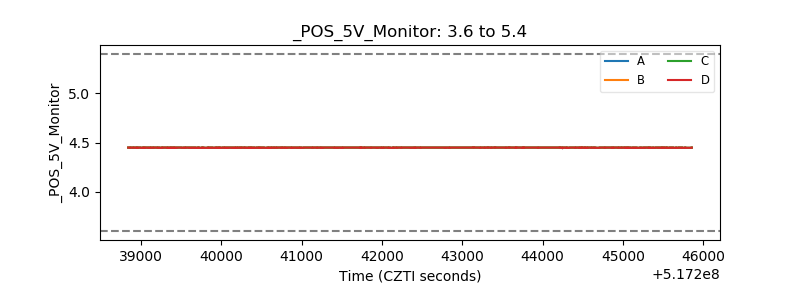 |
| _ROLL_ROT | 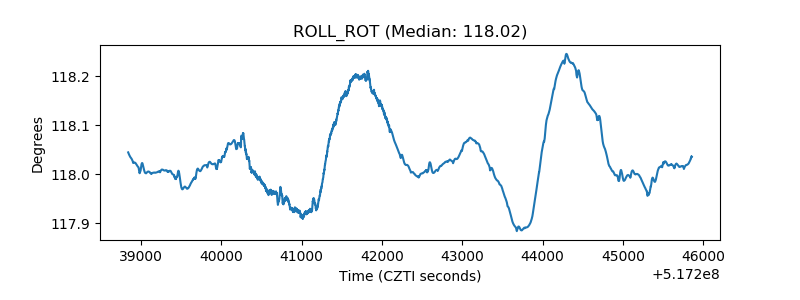 |
| _Roll_DEC | 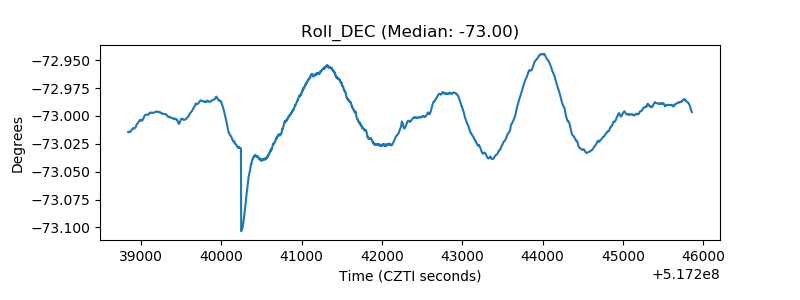 |
| _Roll_RA | 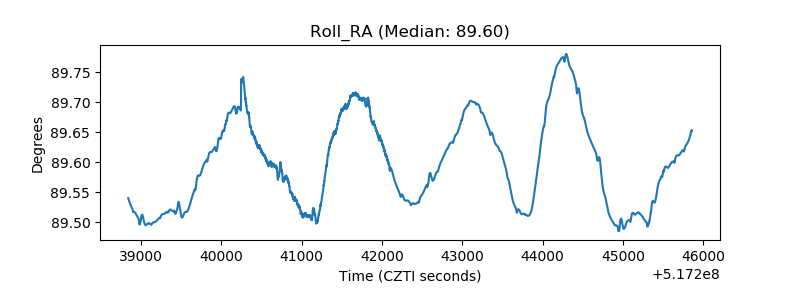 |
| Veto Counter | 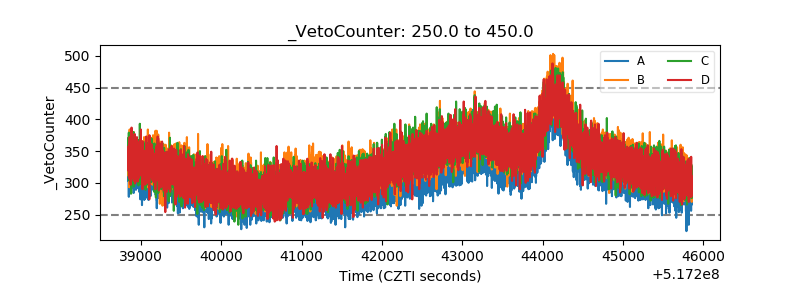 |