| Param | Original file | Final file |
|---|---|---|
| Filename | modeM0/AS1A14_070T08_9000006576_57634cztM0_level2.fits | modeM0/AS1A14_070T08_9000006576_57634cztM0_level2_quad_clean.evt |
| Size (bytes) | 895,772,160 | 159,701,760 |
| Size | 854.3 MB | 152.3 MB |
| Events in quadrant A | 6,449,892 | 1,039,678 |
| Events in quadrant B | 6,516,028 | 1,030,756 |
| Events in quadrant C | 8,730,119 | 1,018,929 |
| Events in quadrant D | 10,424,583 | 820,152 |
| Mode M0 | |||
|---|---|---|---|
| Quadrant | BADHDUFLAG | Total packets | Discarded packets |
| A | 0 | 29023 | 1 |
| B | 0 | 29199 | 1 |
| C | 0 | 35626 | 1 |
| D | 0 | 40259 | 1 |
| Mode M9 | |||
|---|---|---|---|
| Quadrant | BADHDUFLAG | Total packets | Discarded packets |
| A | 0 | 4 | 0 |
| B | 0 | 4 | 0 |
| C | 0 | 4 | 0 |
| D | 0 | 4 | 0 |
| Mode SS | |||
|---|---|---|---|
| Quadrant | BADHDUFLAG | Total packets | Discarded packets |
| A | 0 | 270 | 0 |
| B | 0 | 270 | 0 |
| C | 0 | 270 | 0 |
| D | 0 | 270 | 0 |
| Quadrant | Total seconds | Saturated seconds | Saturation percentage |
|---|---|---|---|
| A | 13389 | 178 | 1.329450% |
| B | 13389 | 313 | 2.337740% |
| C | 13388 | 505 | 3.772035% |
| D | 13389 | 1512 | 11.292852% |
Noise dominated data is calculated using 1-second bins in cleaned event files. If a bin has >2000 counts, and if more than 50% of those come from <1% of pixels, then it is considered to be noise-dominated and hence unusable.
| Quadrant | # 1 sec bins | Bins with >0 counts | Bins with >2000 counts | High rate bins dominated by noise | Noise dominated (total time) | Noise dominated (detector-on time) | Marked lightcurve |
|---|---|---|---|---|---|---|---|
| A | 14094 | 13680 | 55 | 55 | 0.39% | 0.40% | 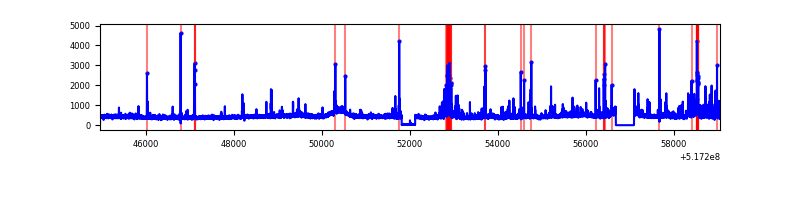 |
| B | 14094 | 13680 | 62 | 62 | 0.44% | 0.45% | 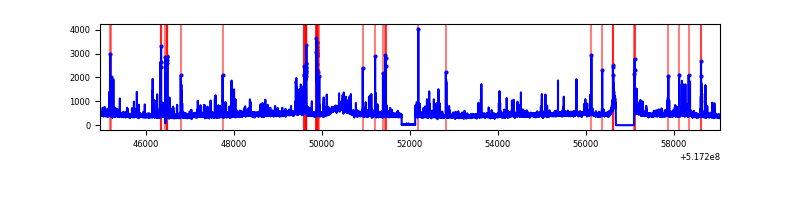 |
| C | 14093 | 13679 | 333 | 333 | 2.36% | 2.43% | 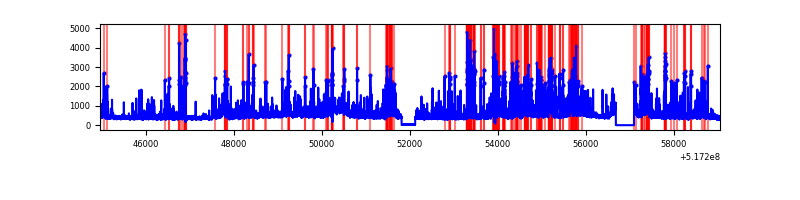 |
| D | 14094 | 13680 | 1202 | 1202 | 8.53% | 8.79% | 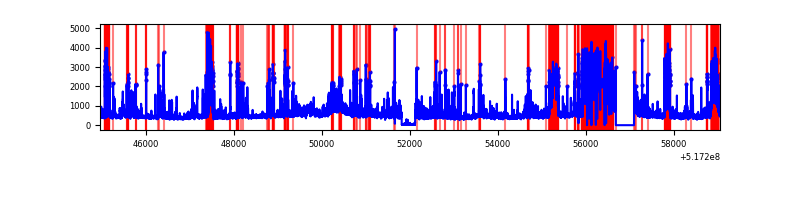 |
Top three noisy pixels from each quadrant. If the there are fewer than three noisy pixels in the level2.evt file, extra rows are filled as -1
| Pixel properties | Quadrant properties | ||||||
|---|---|---|---|---|---|---|---|
| Quadrant | DetID | PixID | Counts | Sigma | Mean | Median | Sigma |
| A | 7 | 64 | 422865 | 1190.74 | 1446 | 1412 | 353.9 |
| A | 4 | 249 | 191263 | 536.39 | 1446 | 1412 | 353.9 |
| A | 10 | 251 | 66488 | 183.86 | 1446 | 1412 | 353.9 |
| B | 0 | 213 | 255513 | 836.34 | 1423 | 1369 | 303.9 |
| B | 10 | 247 | 144452 | 470.86 | 1423 | 1369 | 303.9 |
| B | 7 | 252 | 114592 | 372.59 | 1423 | 1369 | 303.9 |
| C | 15 | 224 | 2564583 | 6799.06 | 1384 | 1367 | 377.0 |
| C | 12 | 2 | 217855 | 574.24 | 1384 | 1367 | 377.0 |
| C | 10 | 22 | 166765 | 438.73 | 1384 | 1367 | 377.0 |
| D | 2 | 249 | 2049162 | 5536.21 | 1306 | 1248 | 369.9 |
| D | 15 | 142 | 1063704 | 2872.18 | 1306 | 1248 | 369.9 |
| D | 3 | 12 | 493224 | 1329.98 | 1306 | 1248 | 369.9 |
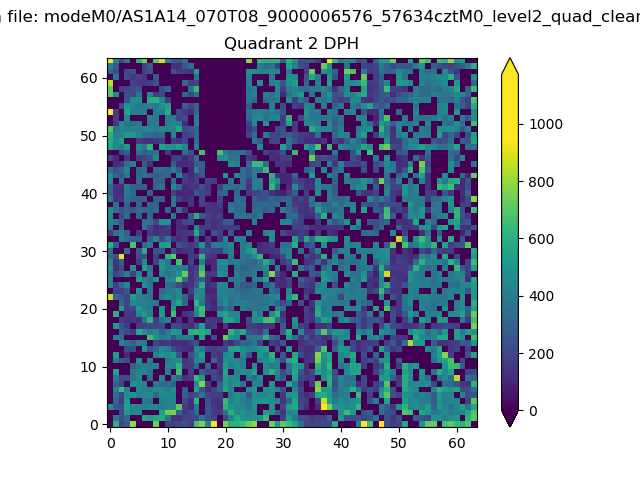
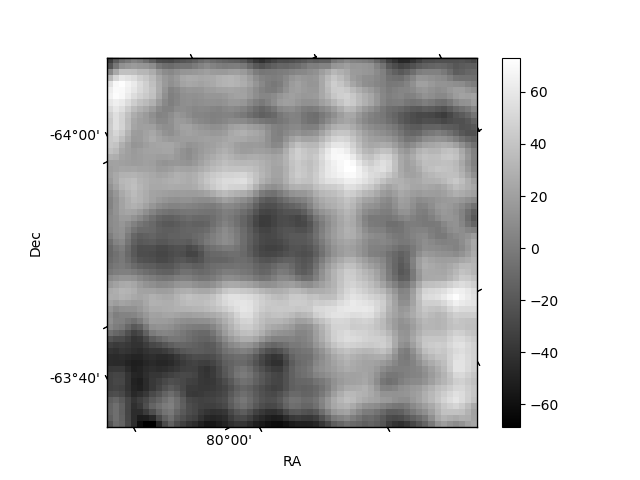
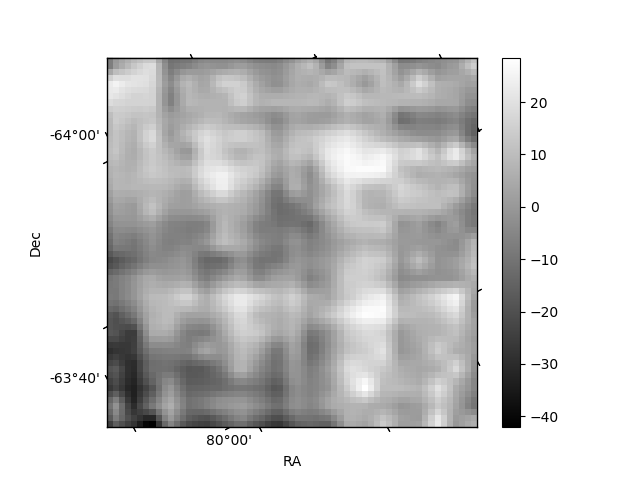
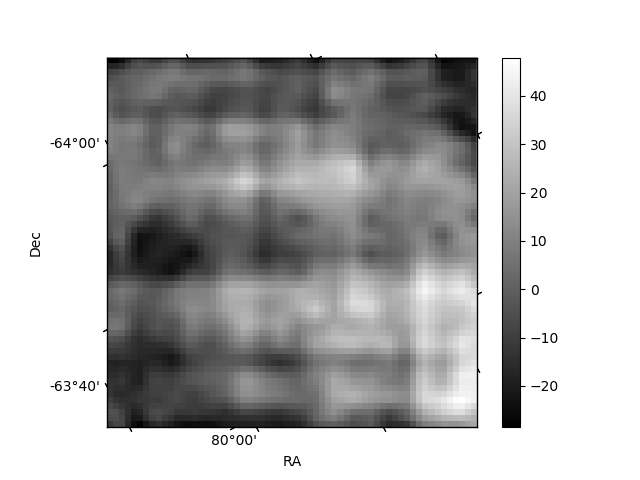
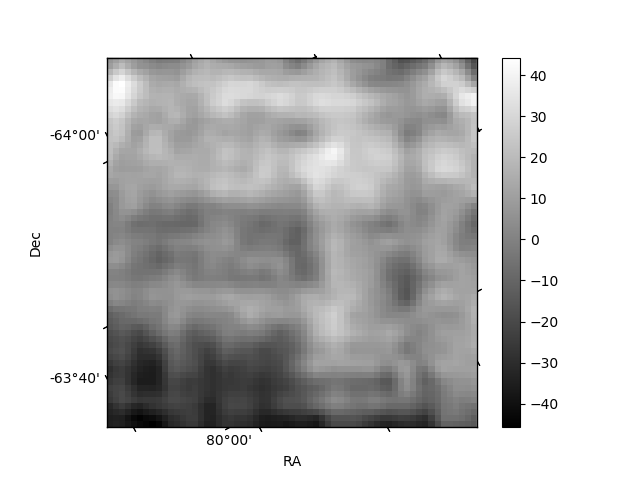
Histogram calculated using DETX and DETY for each event in the final _common_clean file
| Quadrant A | 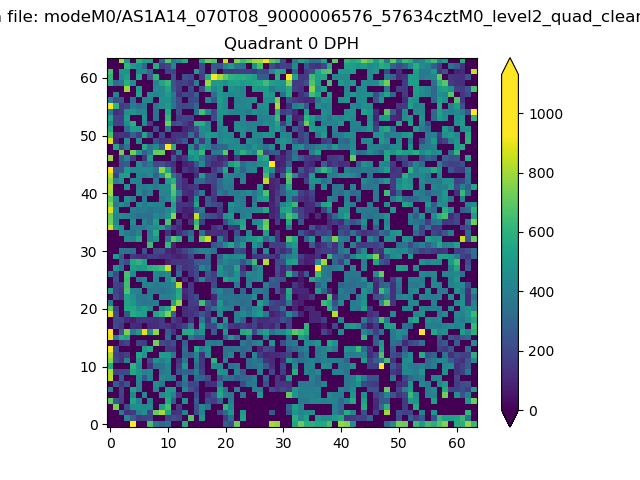 |
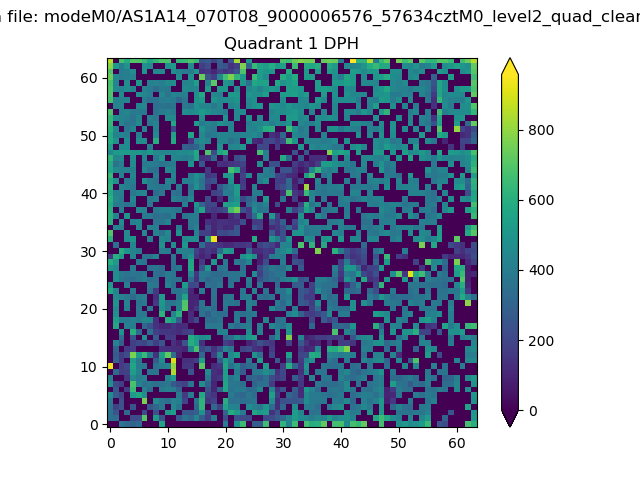 |
Quadrant B |
|---|---|---|---|
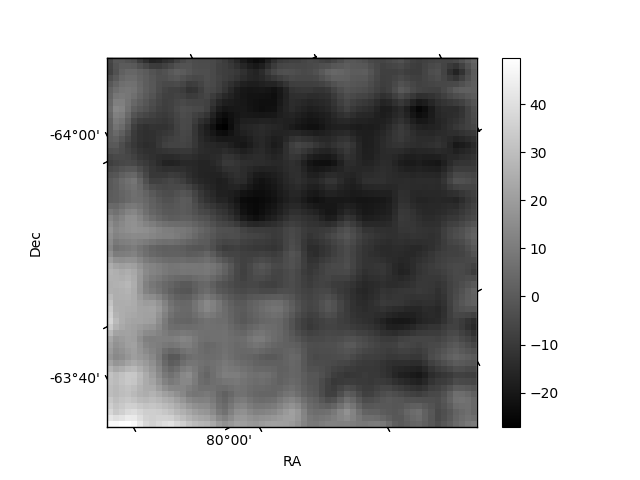
| Quadrant D | 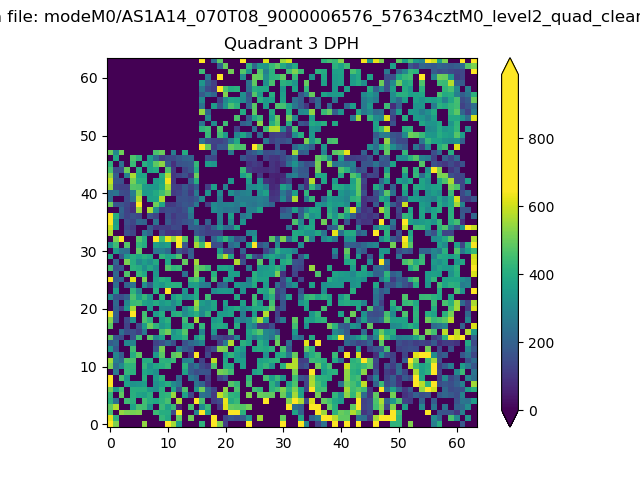 |
 |
Quadrant C |
| Plot type | Count rate plots | Images |
|---|---|---|
| Comparison with Poisson distribution Blue bars denote a histogram of data divided into 1 sec bins. Red curve is a Poisson curve with rate = median count rate of data. |
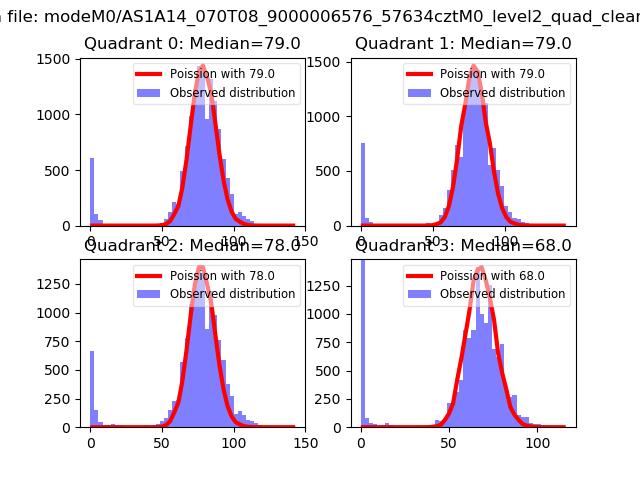 |
 |
| Quadrant-wise count rates Data is divided into 100 sec bins |
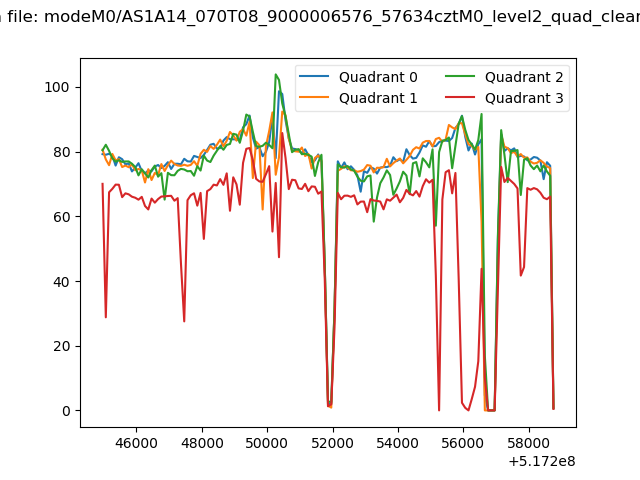 |
|
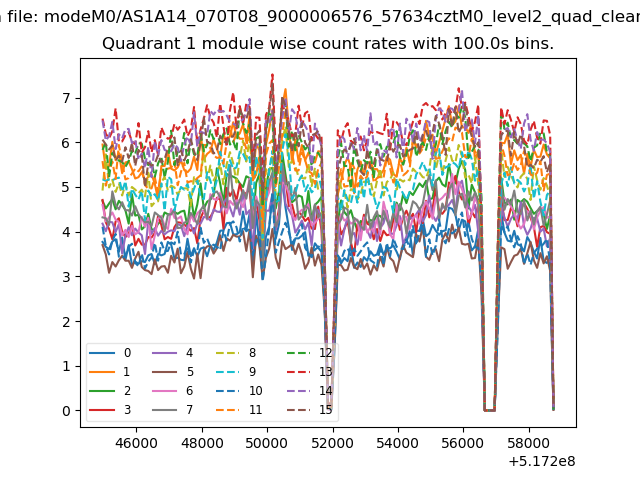
| Module-wise count rates for Quadrant A Data is divided into 100 sec bins |
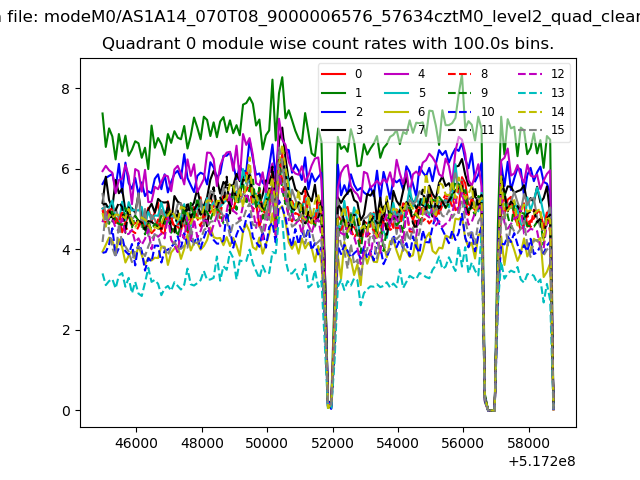 |
 |
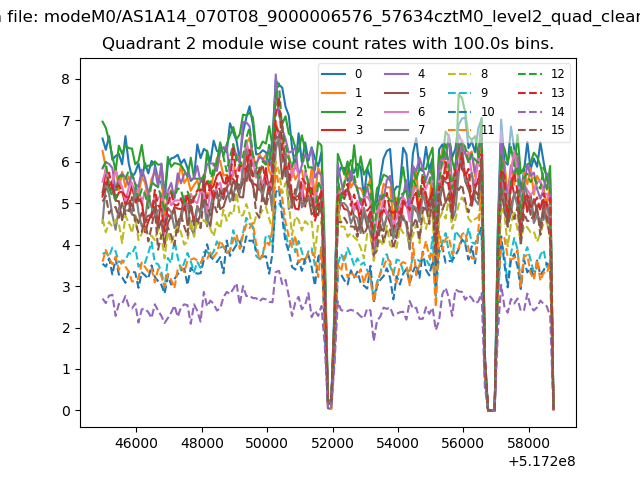
| Module-wise count rates for Quadrant B Data is divided into 100 sec bins |
 |
 |
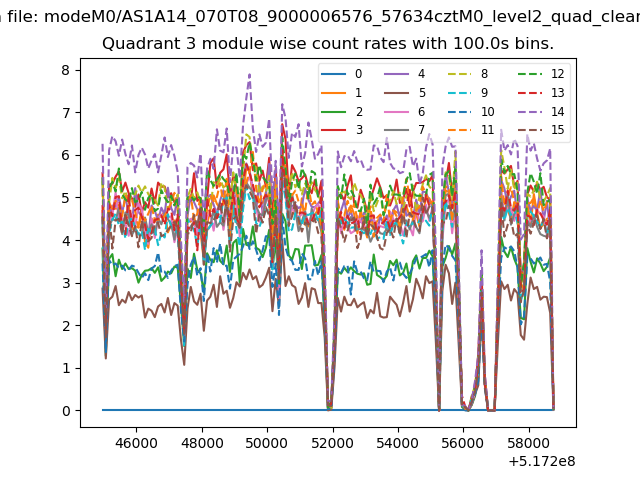
| Module-wise count rates for Quadrant C Data is divided into 100 sec bins |
 |
 |
| Module-wise count rates for Quadrant D Data is divided into 100 sec bins |
 |
 |
| Parameter | Plot |
|---|---|
| CZT HV Monitor | 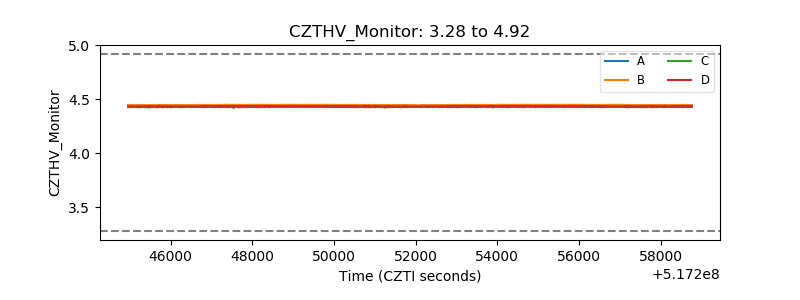 |
| D_VDD | 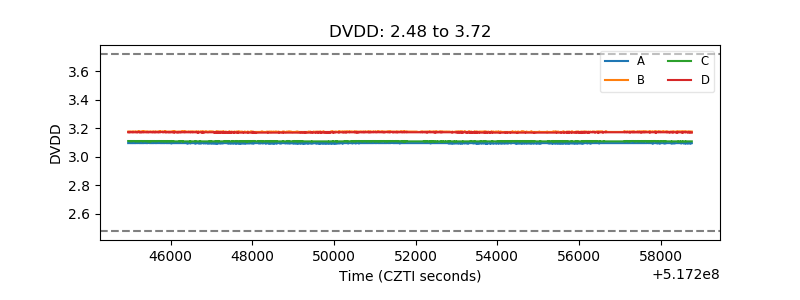 |
| Temperature 1 | 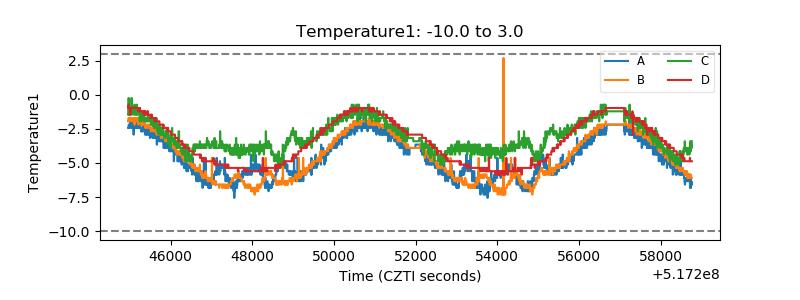 |
| Veto HV Monitor |  |
| Veto LLD | 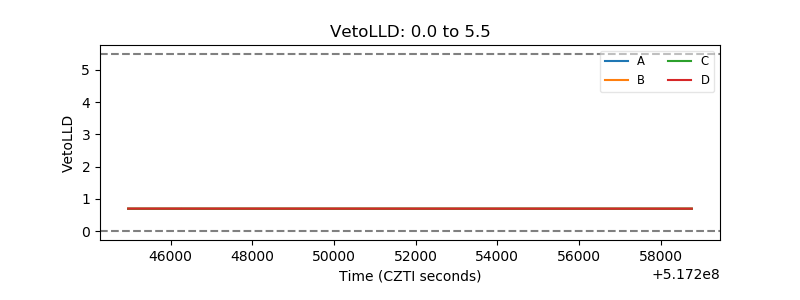 |
| Alpha Counter | 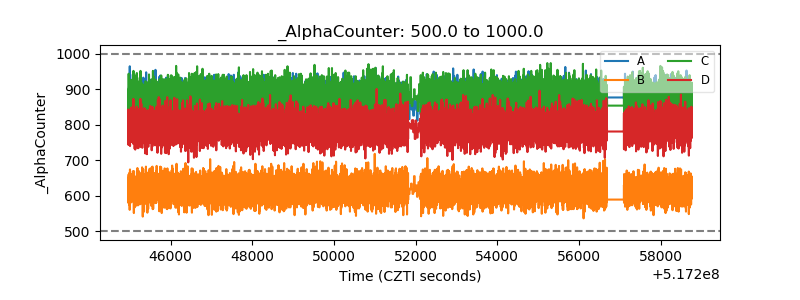 |
| _CPM_Rate | 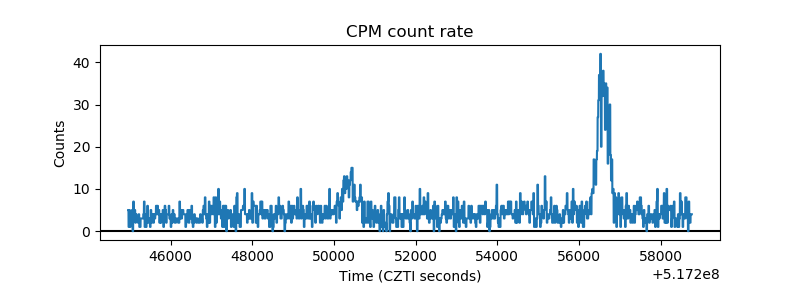 |
| CZT Counter | 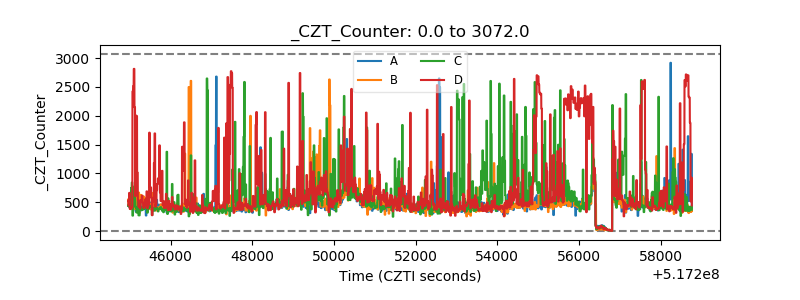 |
| +2.5 Volts monitor | 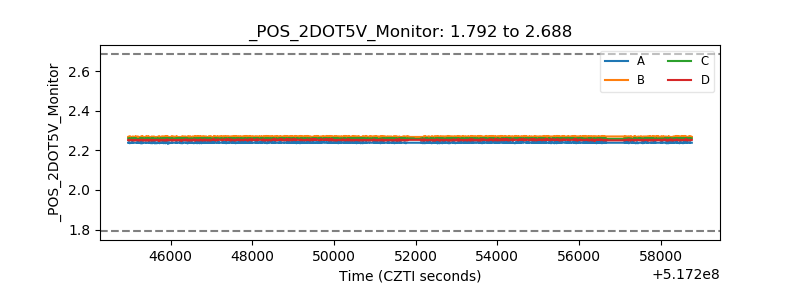 |
| +5 Volts monitor | 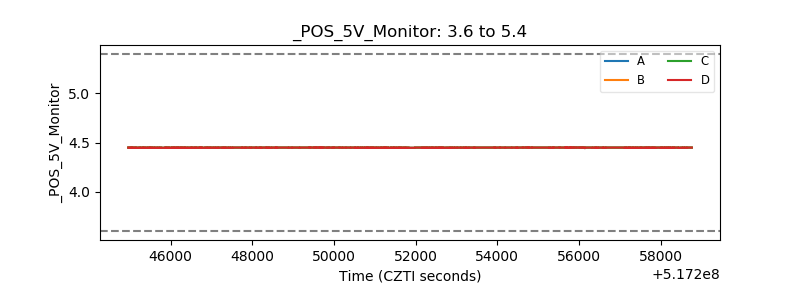 |
| _ROLL_ROT | 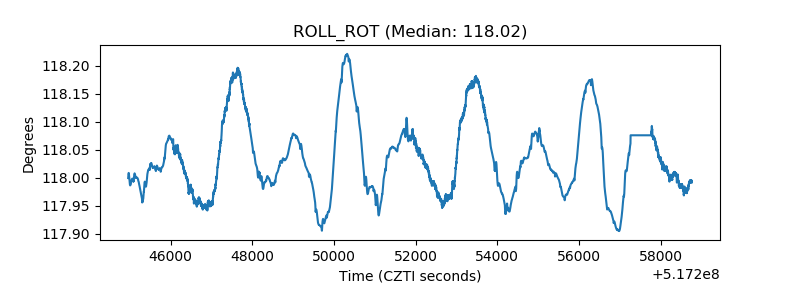 |
| _Roll_DEC | 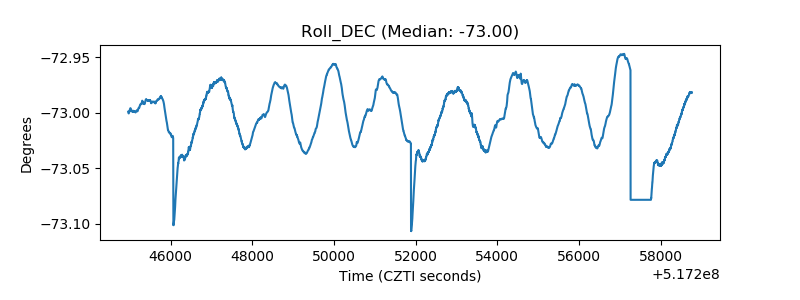 |
| _Roll_RA | 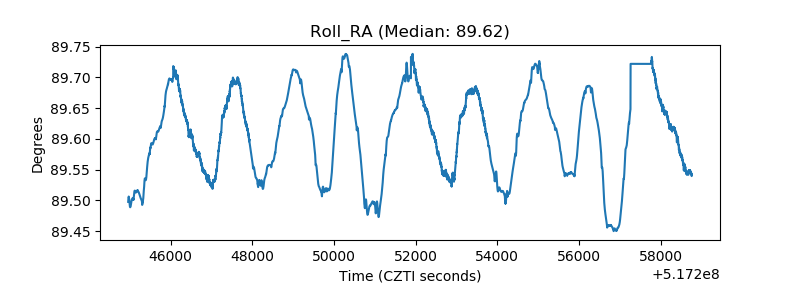 |
| Veto Counter | 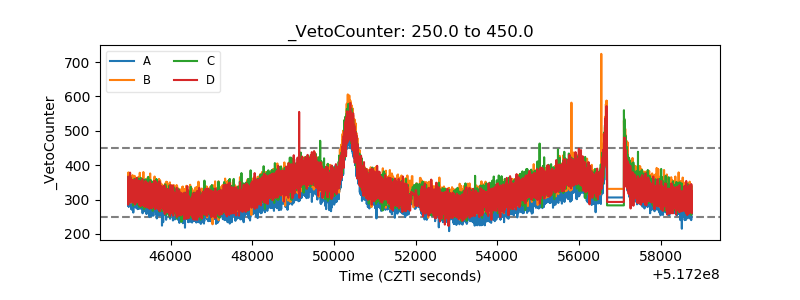 |