| Param | Original file | Final file |
|---|---|---|
| Filename | modeM0/AS1A14_070T08_9000006576_57635cztM0_level2.fits | modeM0/AS1A14_070T08_9000006576_57635cztM0_level2_quad_clean.evt |
| Size (bytes) | 912,096,000 | 129,890,880 |
| Size | 869.8 MB | 123.9 MB |
| Events in quadrant A | 8,521,490 | 840,214 |
| Events in quadrant B | 5,273,245 | 916,466 |
| Events in quadrant C | 7,398,864 | 763,542 |
| Events in quadrant D | 11,724,297 | 655,724 |
| Mode M0 | |||
|---|---|---|---|
| Quadrant | BADHDUFLAG | Total packets | Discarded packets |
| A | 0 | 32938 | 2 |
| B | 0 | 23616 | 2 |
| C | 0 | 29747 | 2 |
| D | 0 | 42271 | 2 |
| Mode M9 | |||
|---|---|---|---|
| Quadrant | BADHDUFLAG | Total packets | Discarded packets |
| A | 0 | 14 | 0 |
| B | 0 | 14 | 0 |
| C | 0 | 14 | 0 |
| D | 0 | 14 | 0 |
| Mode SS | |||
|---|---|---|---|
| Quadrant | BADHDUFLAG | Total packets | Discarded packets |
| A | 0 | 224 | 0 |
| B | 0 | 224 | 0 |
| C | 0 | 224 | 0 |
| D | 0 | 224 | 0 |
| Quadrant | Total seconds | Saturated seconds | Saturation percentage |
|---|---|---|---|
| A | 10919 | 528 | 4.835608% |
| B | 10919 | 123 | 1.126477% |
| C | 10918 | 509 | 4.662026% |
| D | 10918 | 2198 | 20.131892% |
Noise dominated data is calculated using 1-second bins in cleaned event files. If a bin has >2000 counts, and if more than 50% of those come from <1% of pixels, then it is considered to be noise-dominated and hence unusable.
| Quadrant | # 1 sec bins | Bins with >0 counts | Bins with >2000 counts | High rate bins dominated by noise | Noise dominated (total time) | Noise dominated (detector-on time) | Marked lightcurve |
|---|---|---|---|---|---|---|---|
| A | 12688 | 11205 | 427 | 427 | 3.37% | 3.81% | 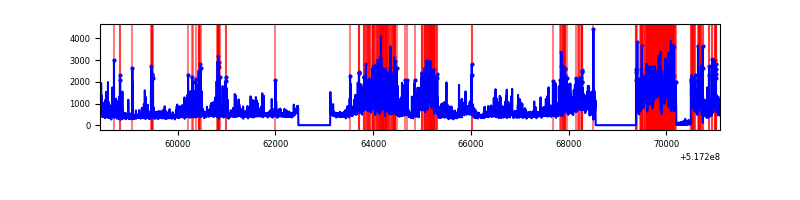 |
| B | 12688 | 11205 | 39 | 39 | 0.31% | 0.35% | 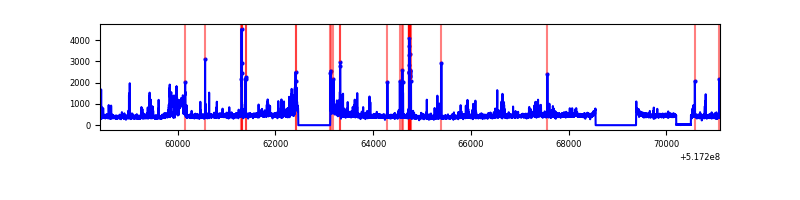 |
| C | 12687 | 11203 | 389 | 389 | 3.07% | 3.47% | 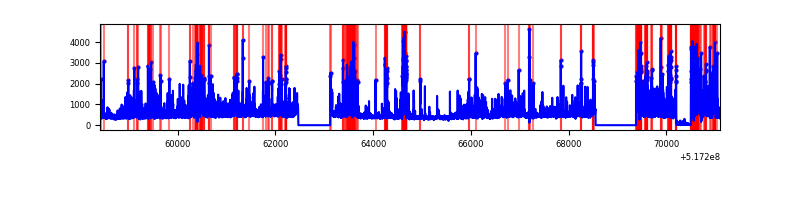 |
| D | 12687 | 11204 | 2112 | 2112 | 16.65% | 18.85% | 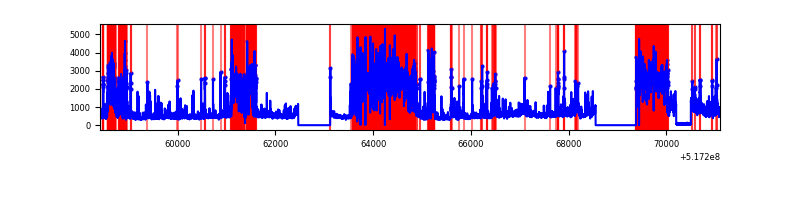 |
Top three noisy pixels from each quadrant. If the there are fewer than three noisy pixels in the level2.evt file, extra rows are filled as -1
| Pixel properties | Quadrant properties | ||||||
|---|---|---|---|---|---|---|---|
| Quadrant | DetID | PixID | Counts | Sigma | Mean | Median | Sigma |
| A | 7 | 64 | 2301559 | 8081.14 | 1149 | 1116 | 284.7 |
| A | 4 | 249 | 1284393 | 4507.98 | 1149 | 1116 | 284.7 |
| A | 3 | 14 | 210571 | 735.79 | 1149 | 1116 | 284.7 |
| B | 0 | 213 | 225230 | 909.98 | 1152 | 1109 | 246.3 |
| B | 5 | 172 | 171926 | 693.55 | 1152 | 1109 | 246.3 |
| B | 10 | 247 | 88116 | 353.27 | 1152 | 1109 | 246.3 |
| C | 15 | 224 | 2445826 | 8122.77 | 1109 | 1101 | 301.0 |
| C | 10 | 22 | 307524 | 1018.11 | 1109 | 1101 | 301.0 |
| C | 14 | 254 | 123308 | 406.04 | 1109 | 1101 | 301.0 |
| D | 15 | 142 | 4092761 | 14473.48 | 1001 | 956 | 282.7 |
| D | 8 | 240 | 1634014 | 5776.43 | 1001 | 956 | 282.7 |
| D | 8 | 160 | 914861 | 3232.65 | 1001 | 956 | 282.7 |
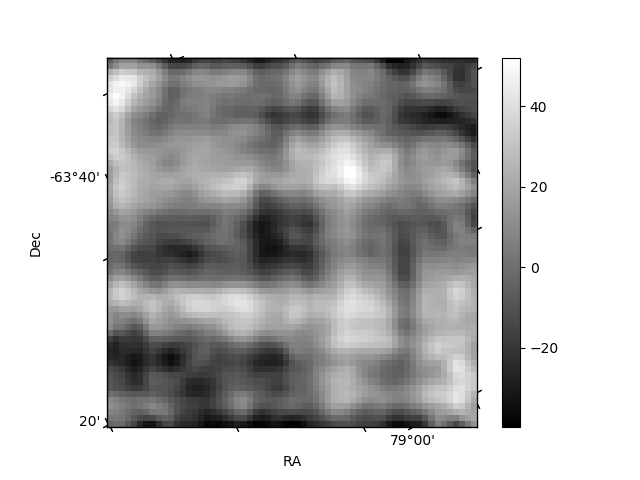
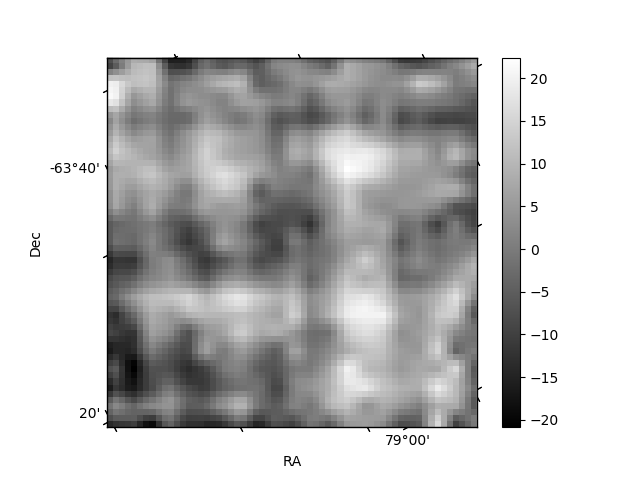
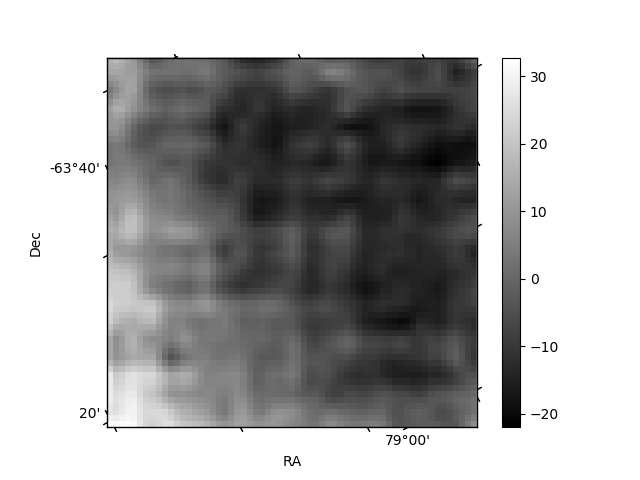
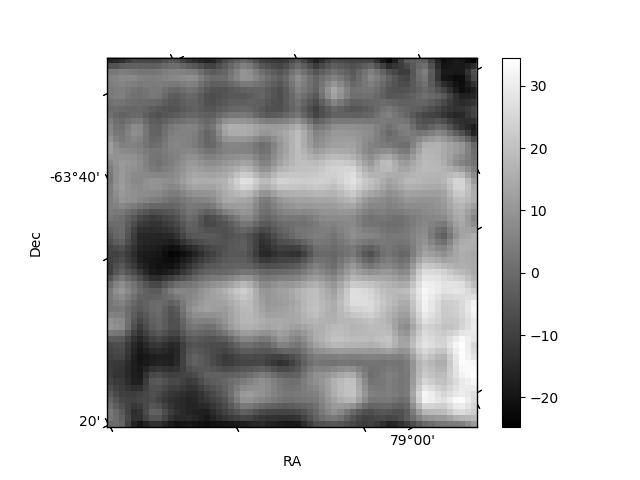
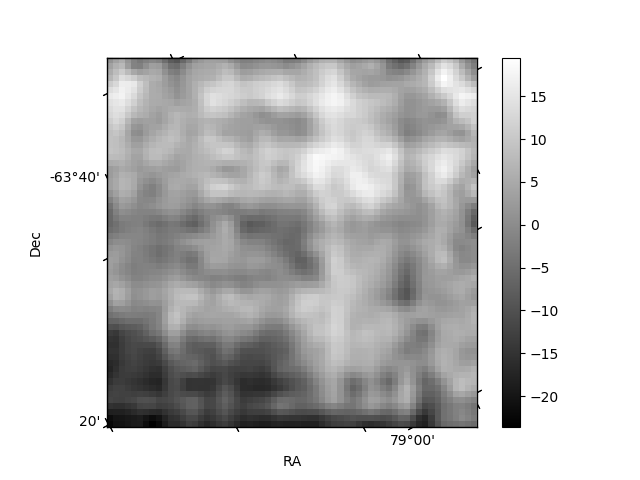
Histogram calculated using DETX and DETY for each event in the final _common_clean file
| Quadrant A | 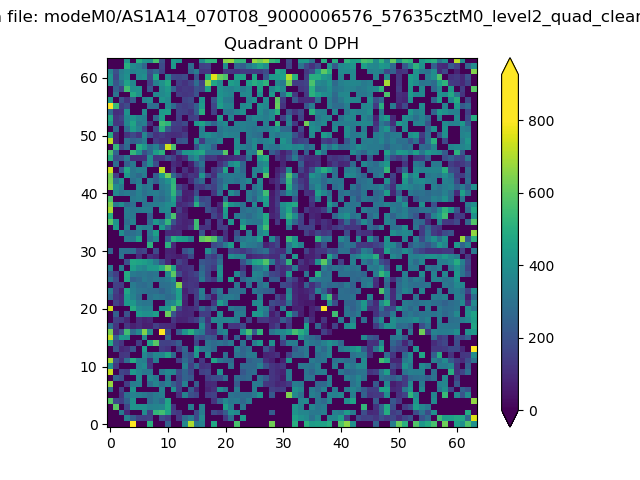 |
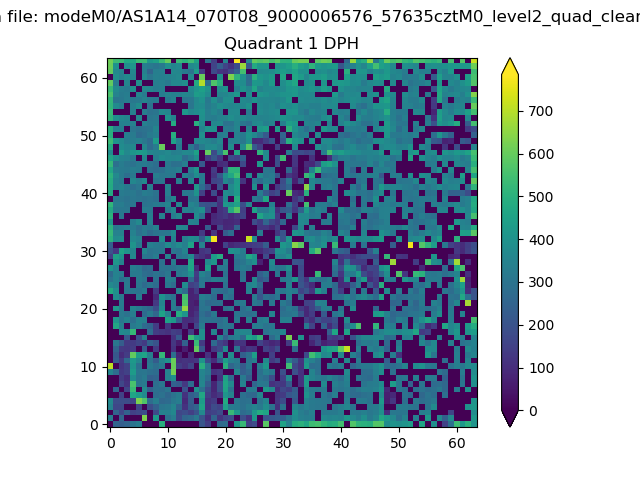 |
Quadrant B |
|---|---|---|---|
| Quadrant D | 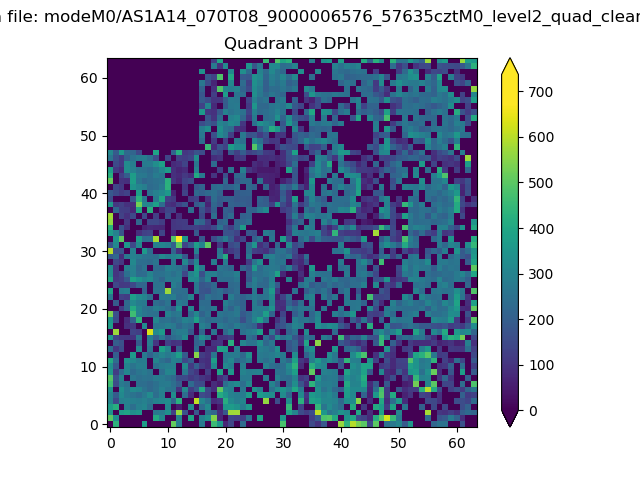 |
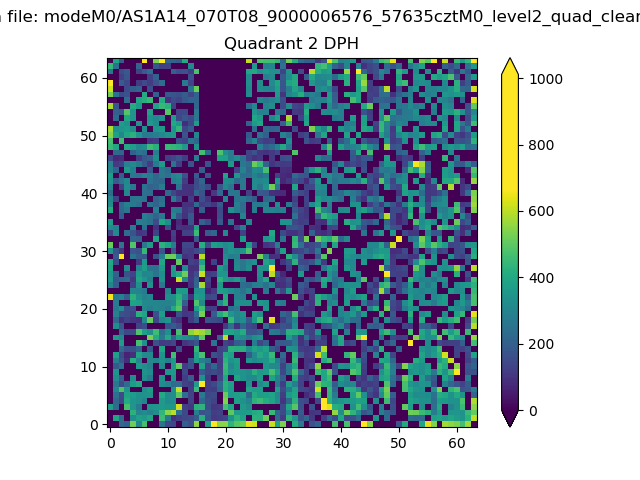 |
Quadrant C |
| Plot type | Count rate plots | Images |
|---|---|---|
| Comparison with Poisson distribution Blue bars denote a histogram of data divided into 1 sec bins. Red curve is a Poisson curve with rate = median count rate of data. |
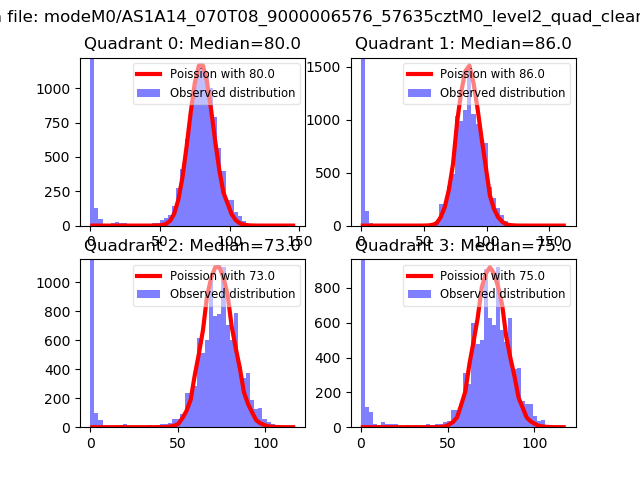 |
 |
| Quadrant-wise count rates Data is divided into 100 sec bins |
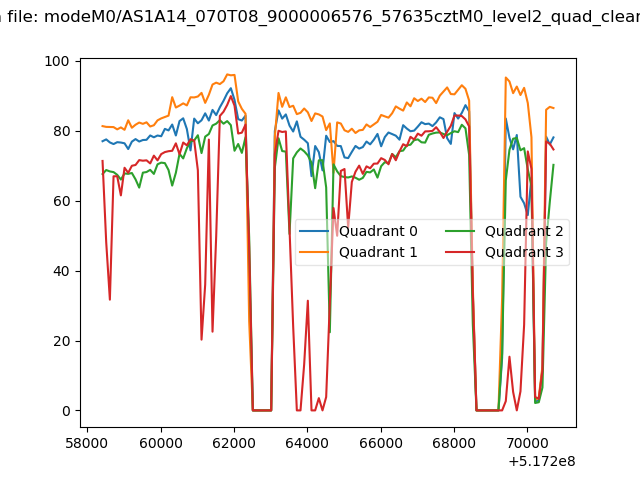 |
|
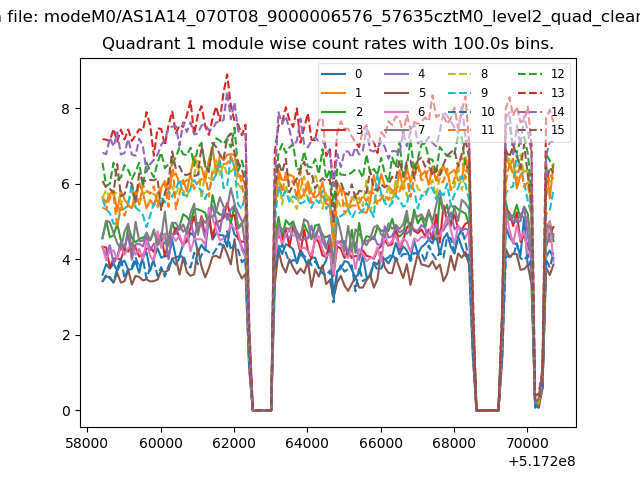
| Module-wise count rates for Quadrant A Data is divided into 100 sec bins |
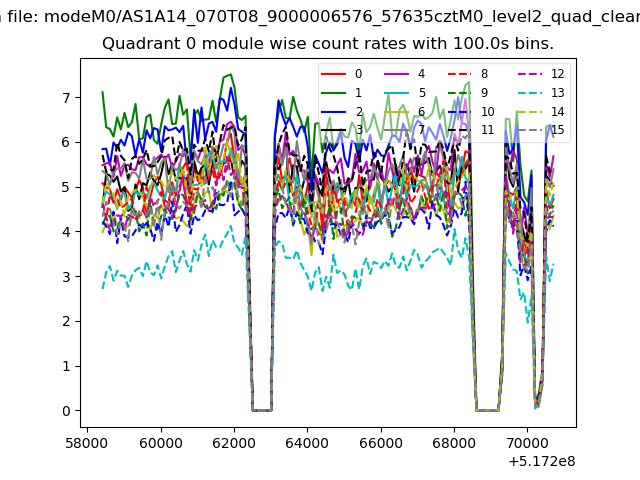 |
 |
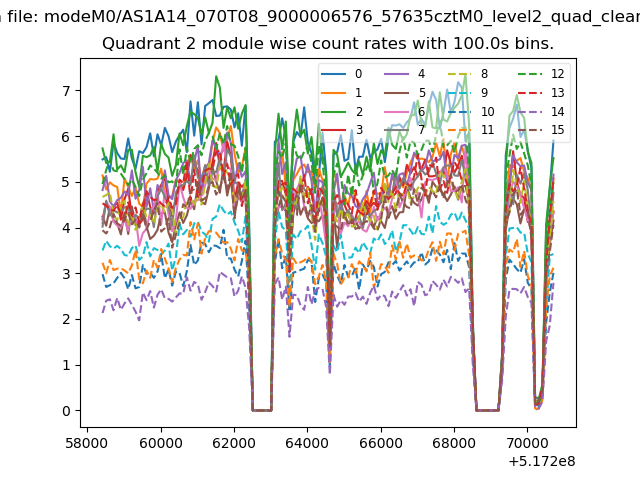
| Module-wise count rates for Quadrant B Data is divided into 100 sec bins |
 |
 |
| Module-wise count rates for Quadrant C Data is divided into 100 sec bins |
 |
 |
| Module-wise count rates for Quadrant D Data is divided into 100 sec bins |
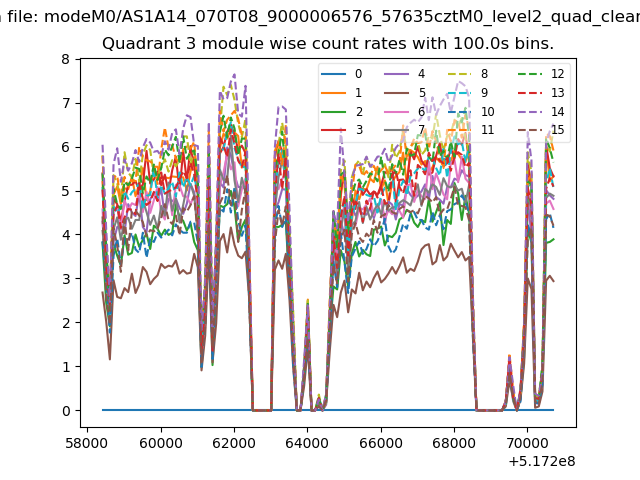 |
 |
| Parameter | Plot |
|---|---|
| CZT HV Monitor | 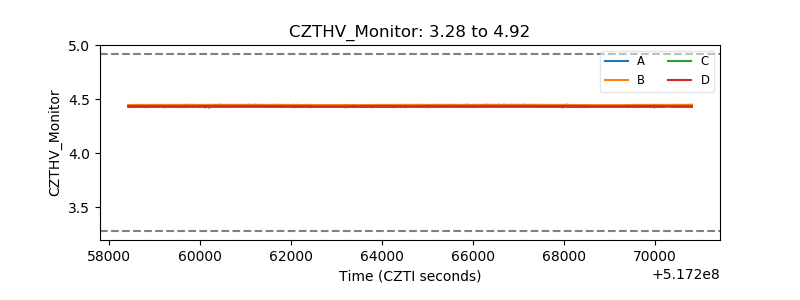 |
| D_VDD | 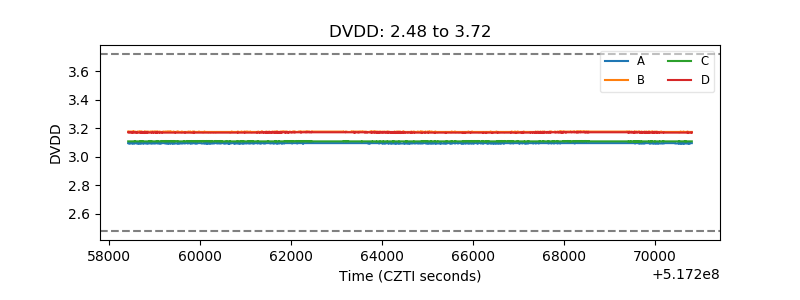 |
| Temperature 1 | 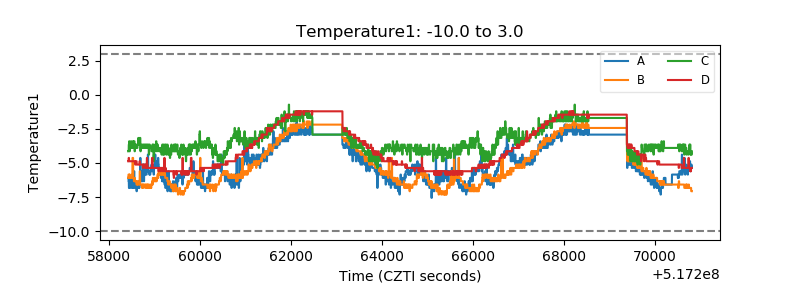 |
| Veto HV Monitor | 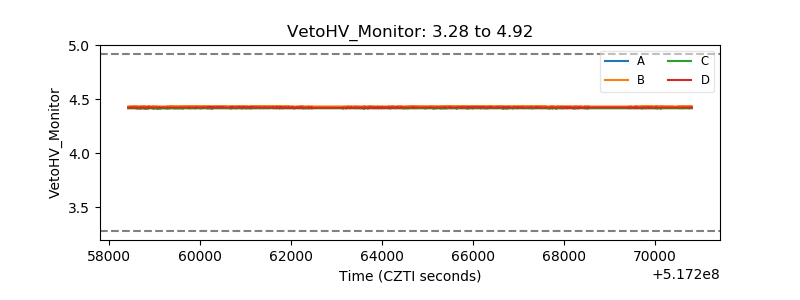 |
| Veto LLD | 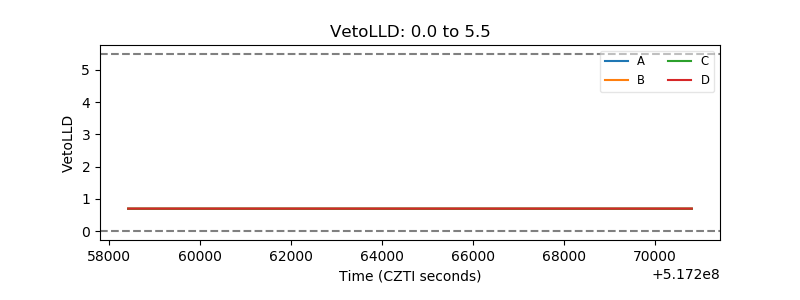 |
| Alpha Counter | 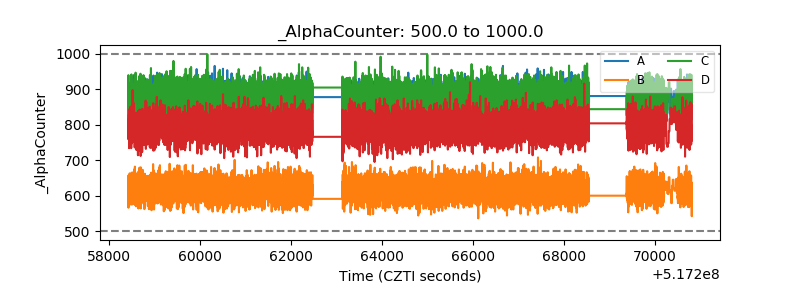 |
| _CPM_Rate | 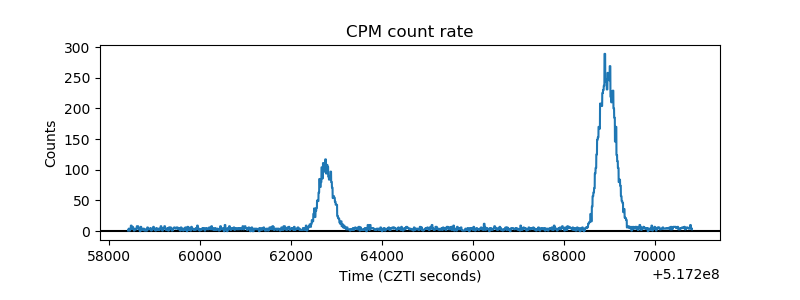 |
| CZT Counter | 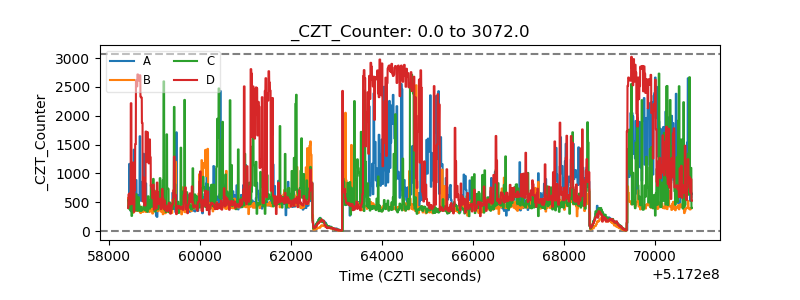 |
| +2.5 Volts monitor | 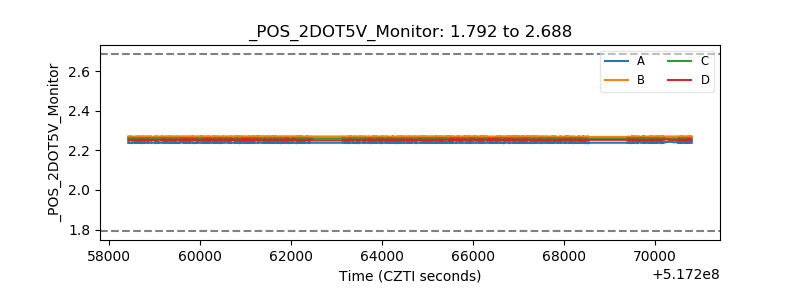 |
| +5 Volts monitor | 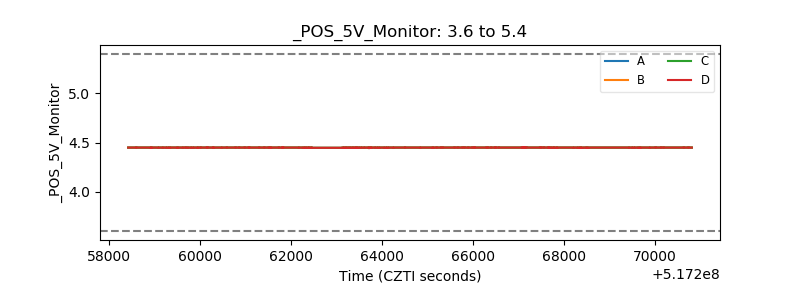 |
| _ROLL_ROT | 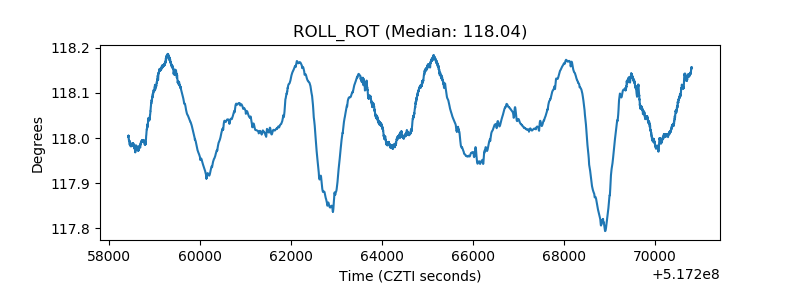 |
| _Roll_DEC | 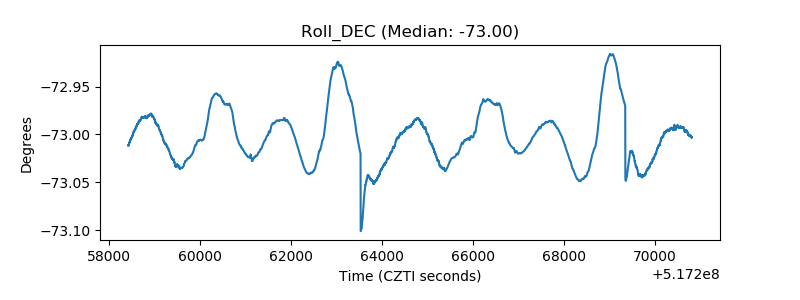 |
| _Roll_RA | 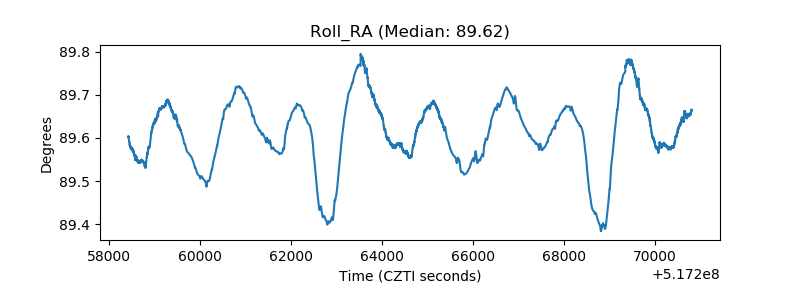 |
| Veto Counter | 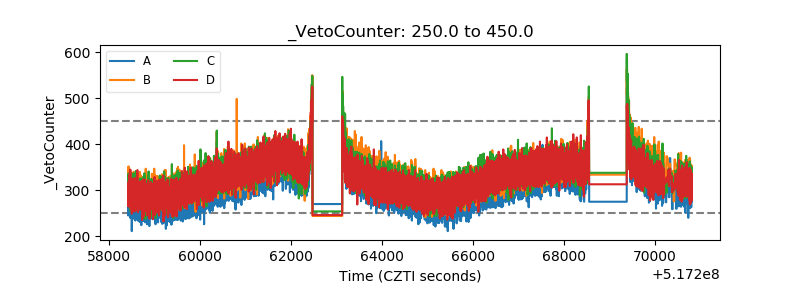 |