| Param | Original file | Final file |
|---|---|---|
| Filename | modeM0/AS1A14_070T08_9000006576_57638cztM0_level2.fits | modeM0/AS1A14_070T08_9000006576_57638cztM0_level2_quad_clean.evt |
| Size (bytes) | 1,902,804,480 | 329,123,520 |
| Size | 1.8 GB | 313.9 MB |
| Events in quadrant A | 16,474,074 | 2,160,913 |
| Events in quadrant B | 11,317,621 | 2,374,862 |
| Events in quadrant C | 15,147,418 | 2,060,735 |
| Events in quadrant D | 25,682,879 | 1,750,909 |
| Mode M0 | |||
|---|---|---|---|
| Quadrant | BADHDUFLAG | Total packets | Discarded packets |
| A | 0 | 65620 | 5 |
| B | 0 | 50568 | 5 |
| C | 0 | 61664 | 5 |
| D | 0 | 92539 | 5 |
| Mode M9 | |||
|---|---|---|---|
| Quadrant | BADHDUFLAG | Total packets | Discarded packets |
| A | 0 | 38 | 0 |
| B | 0 | 38 | 0 |
| C | 0 | 38 | 0 |
| D | 0 | 38 | 0 |
| Mode SS | |||
|---|---|---|---|
| Quadrant | BADHDUFLAG | Total packets | Discarded packets |
| A | 0 | 482 | 0 |
| B | 0 | 482 | 0 |
| C | 0 | 482 | 0 |
| D | 0 | 482 | 0 |
| Quadrant | Total seconds | Saturated seconds | Saturation percentage |
|---|---|---|---|
| A | 23496 | 1161 | 4.941267% |
| B | 23497 | 334 | 1.421458% |
| C | 23497 | 907 | 3.860067% |
| D | 23497 | 3487 | 14.840192% |
Noise dominated data is calculated using 1-second bins in cleaned event files. If a bin has >2000 counts, and if more than 50% of those come from <1% of pixels, then it is considered to be noise-dominated and hence unusable.
| Quadrant | # 1 sec bins | Bins with >0 counts | Bins with >2000 counts | High rate bins dominated by noise | Noise dominated (total time) | Noise dominated (detector-on time) | Marked lightcurve |
|---|---|---|---|---|---|---|---|
| A | 27720 | 23785 | 796 | 796 | 2.87% | 3.35% | 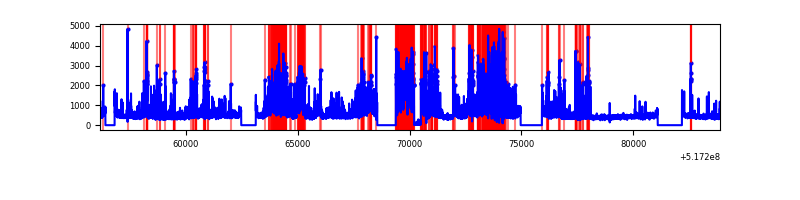 |
| B | 27721 | 23786 | 68 | 68 | 0.25% | 0.29% | 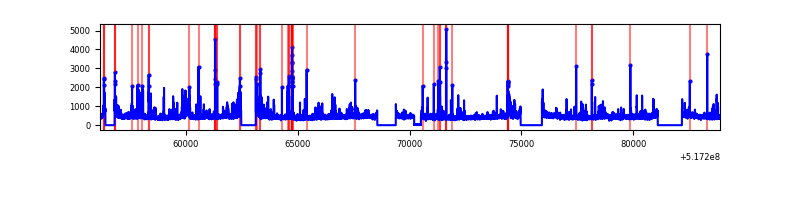 |
| C | 27721 | 23785 | 643 | 643 | 2.32% | 2.70% | 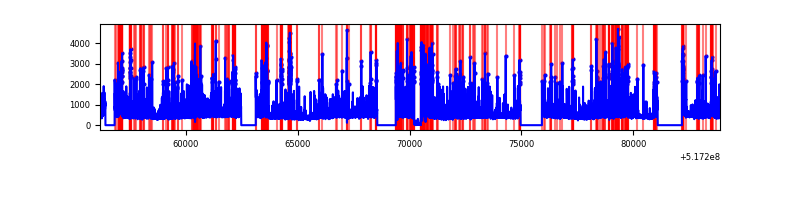 |
| D | 27721 | 23786 | 3231 | 3231 | 11.66% | 13.58% | 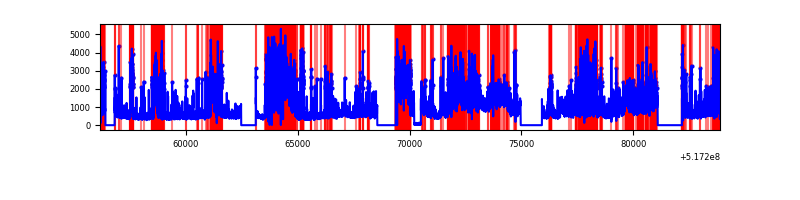 |
Top three noisy pixels from each quadrant. If the there are fewer than three noisy pixels in the level2.evt file, extra rows are filled as -1
| Pixel properties | Quadrant properties | ||||||
|---|---|---|---|---|---|---|---|
| Quadrant | DetID | PixID | Counts | Sigma | Mean | Median | Sigma |
| A | 4 | 249 | 3193213 | 5227.7 | 2492 | 2430 | 610.4 |
| A | 7 | 64 | 2946299 | 4823.16 | 2492 | 2430 | 610.4 |
| A | 3 | 14 | 310703 | 505.07 | 2492 | 2430 | 610.4 |
| B | 0 | 213 | 290568 | 541.38 | 2502 | 2406 | 532.3 |
| B | 5 | 172 | 233058 | 433.34 | 2502 | 2406 | 532.3 |
| B | 5 | 185 | 221543 | 411.7 | 2502 | 2406 | 532.3 |
| C | 15 | 224 | 4571709 | 6963.12 | 2424 | 2402 | 656.2 |
| C | 10 | 22 | 526226 | 798.25 | 2424 | 2402 | 656.2 |
| C | 14 | 254 | 229506 | 346.08 | 2424 | 2402 | 656.2 |
| D | 8 | 160 | 6602295 | 10256.71 | 2274 | 2164 | 643.5 |
| D | 15 | 142 | 5274259 | 8192.92 | 2274 | 2164 | 643.5 |
| D | 8 | 240 | 2224330 | 3453.28 | 2274 | 2164 | 643.5 |
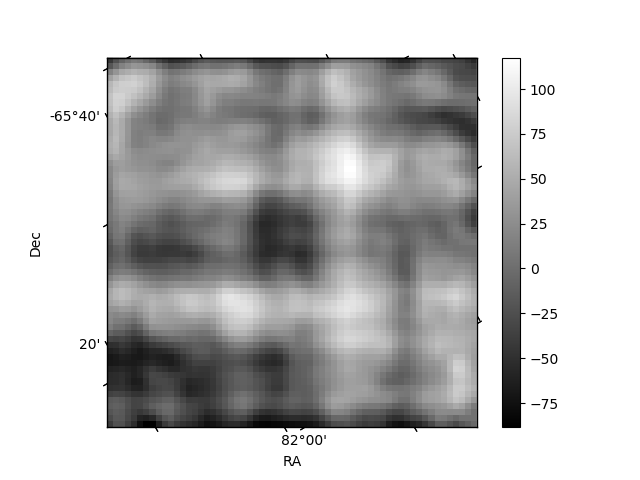
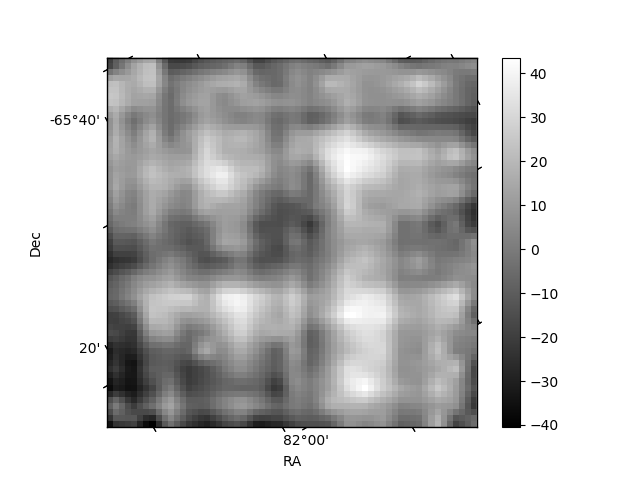
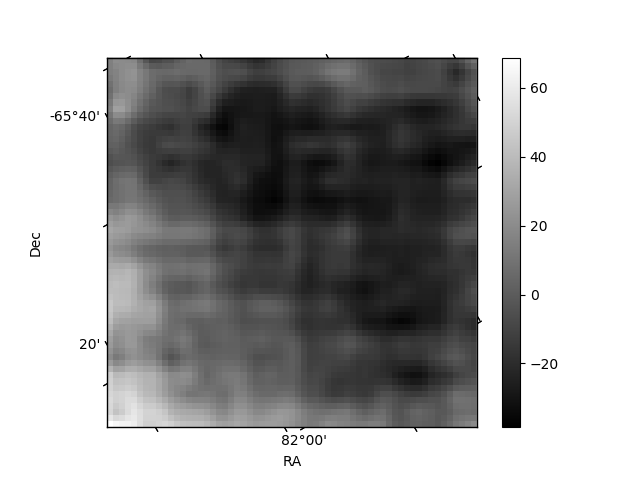
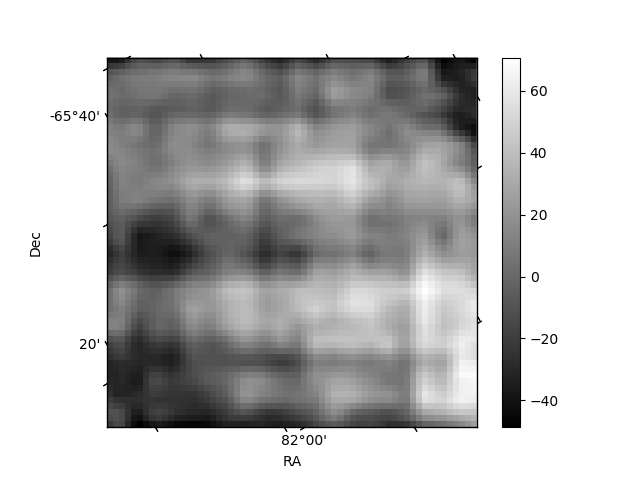
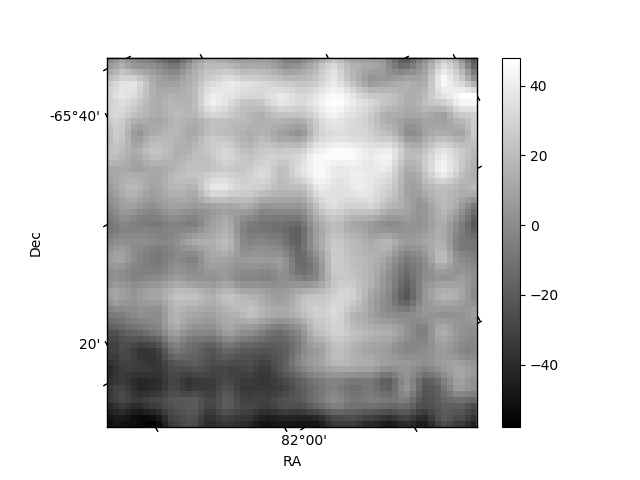
Histogram calculated using DETX and DETY for each event in the final _common_clean file
| Quadrant A | 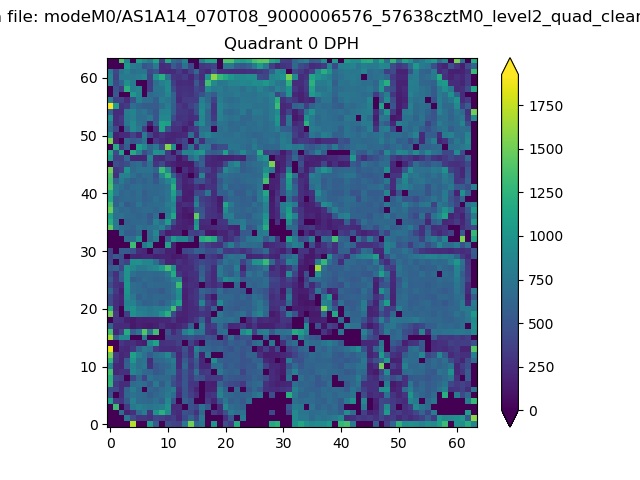 |
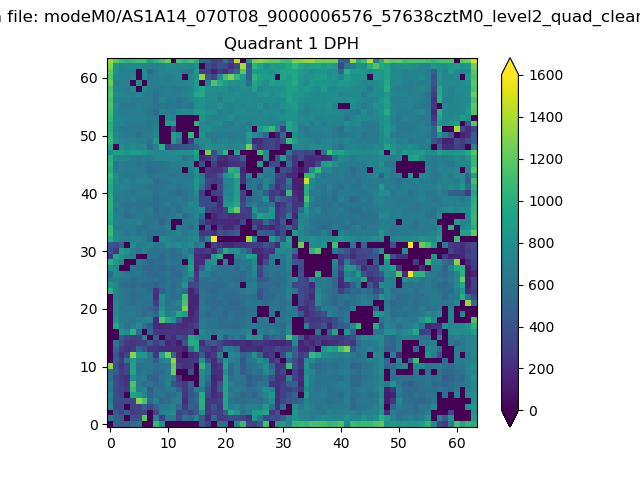 |
Quadrant B |
|---|---|---|---|
| Quadrant D | 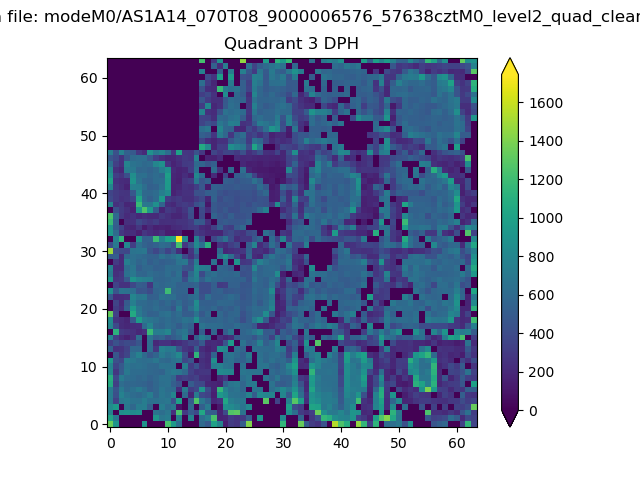 |
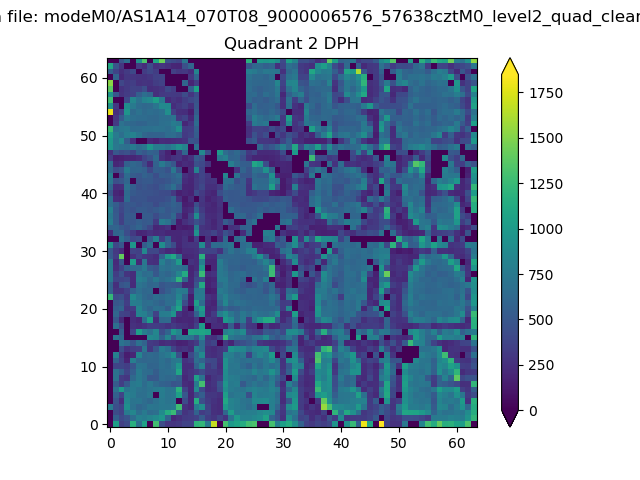 |
Quadrant C |
| Plot type | Count rate plots | Images |
|---|---|---|
| Comparison with Poisson distribution Blue bars denote a histogram of data divided into 1 sec bins. Red curve is a Poisson curve with rate = median count rate of data. |
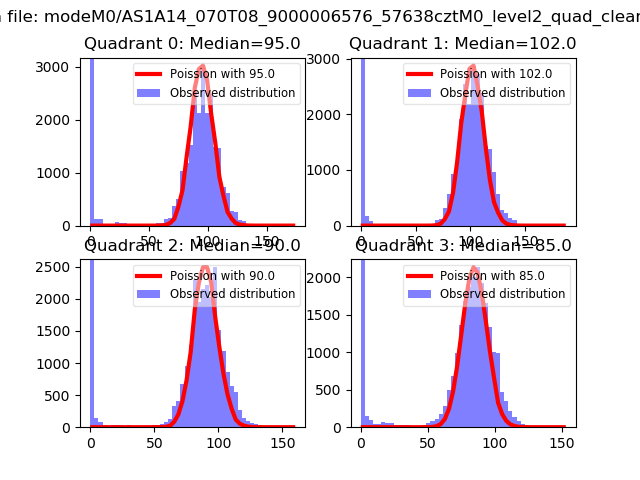 |
 |
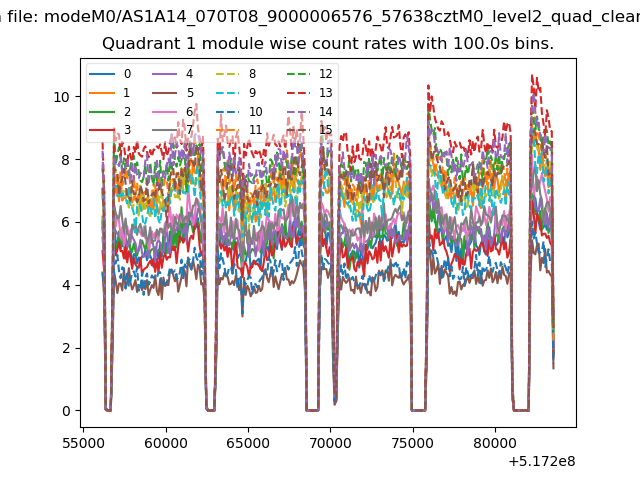
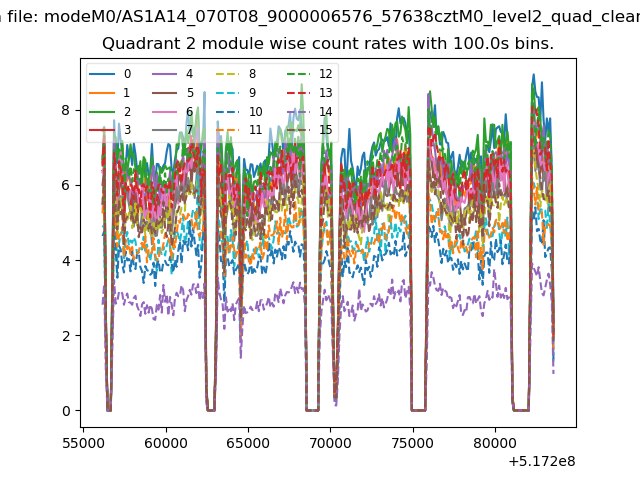
| Quadrant-wise count rates Data is divided into 100 sec bins |
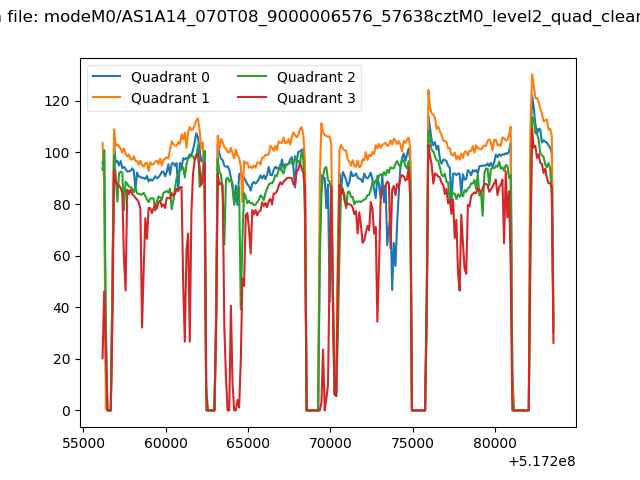 |
|
| Module-wise count rates for Quadrant A Data is divided into 100 sec bins |
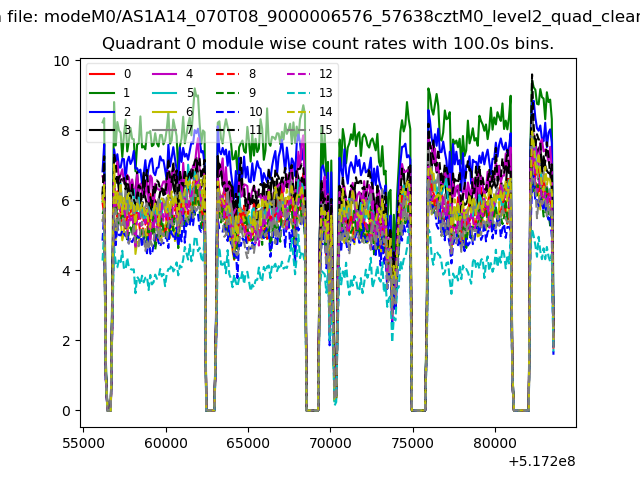 |
 |
| Module-wise count rates for Quadrant B Data is divided into 100 sec bins |
 |
 |
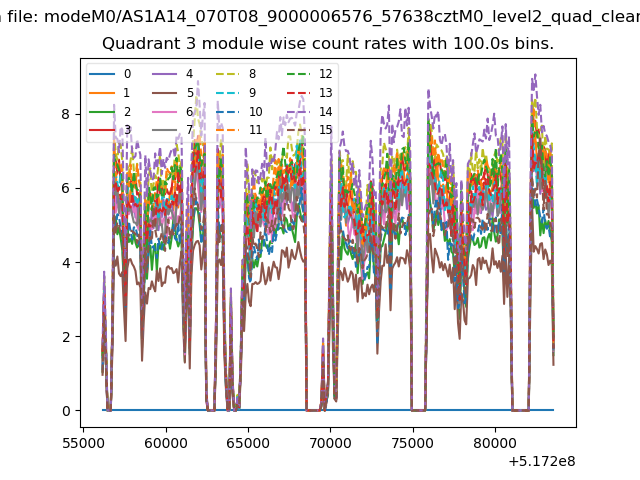
| Module-wise count rates for Quadrant C Data is divided into 100 sec bins |
 |
 |
| Module-wise count rates for Quadrant D Data is divided into 100 sec bins |
 |
 |
| Parameter | Plot |
|---|---|
| CZT HV Monitor | 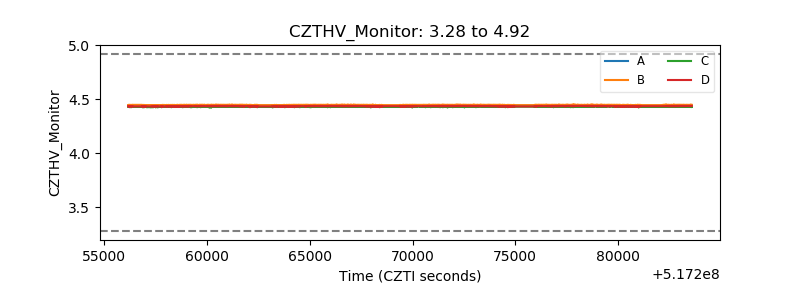 |
| D_VDD | 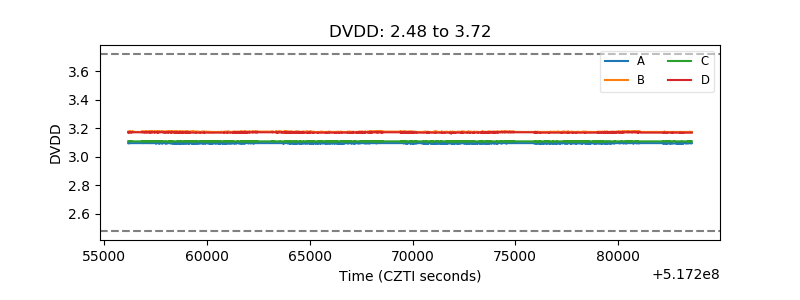 |
| Temperature 1 | 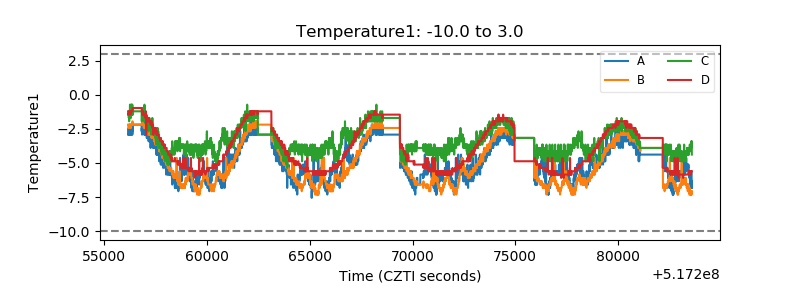 |
| Veto HV Monitor | 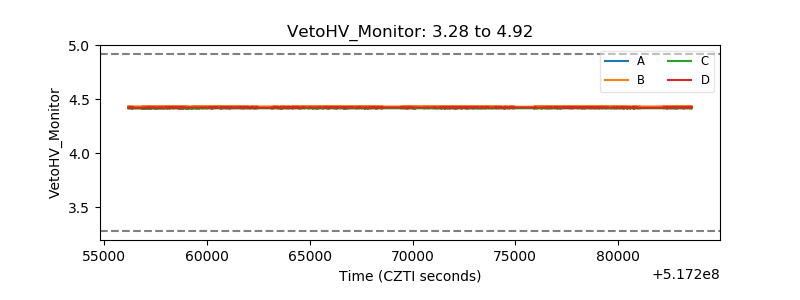 |
| Veto LLD | 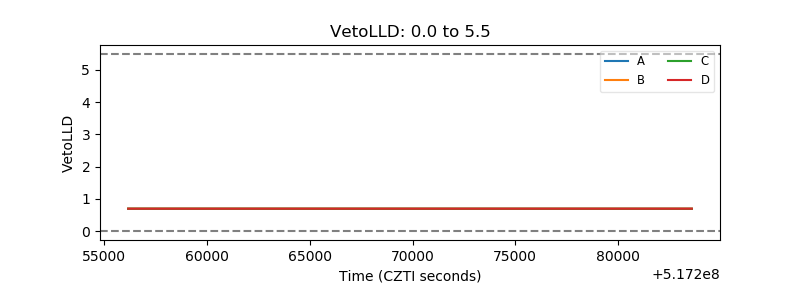 |
| Alpha Counter | 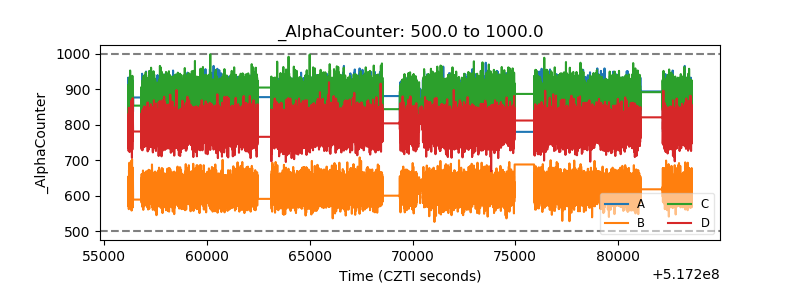 |
| _CPM_Rate | 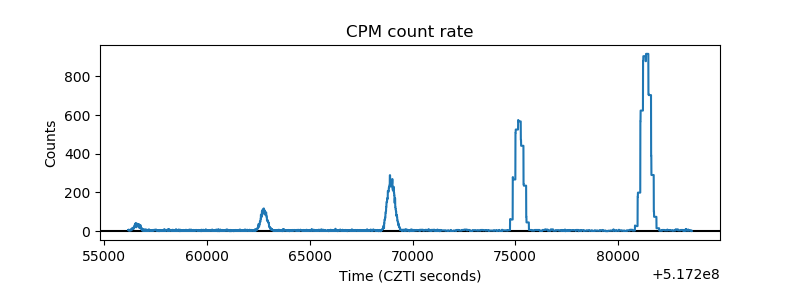 |
| CZT Counter | 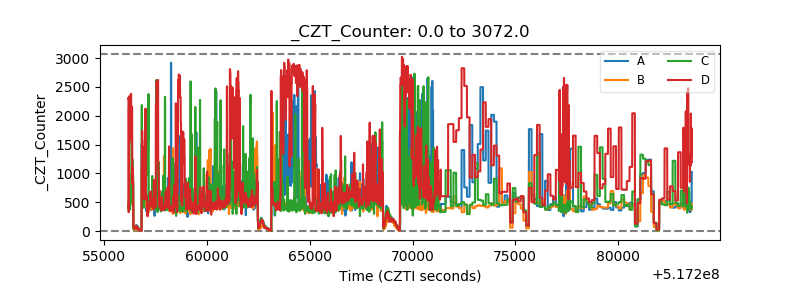 |
| +2.5 Volts monitor | 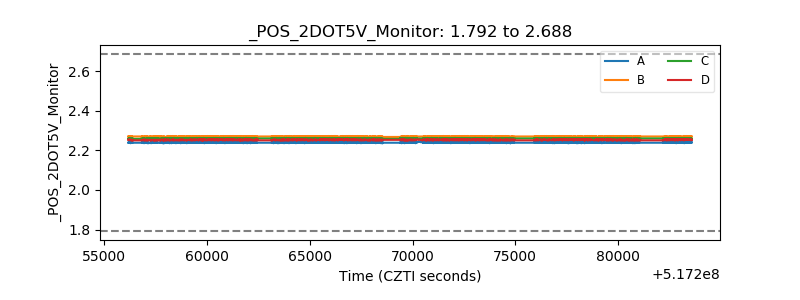 |
| +5 Volts monitor | 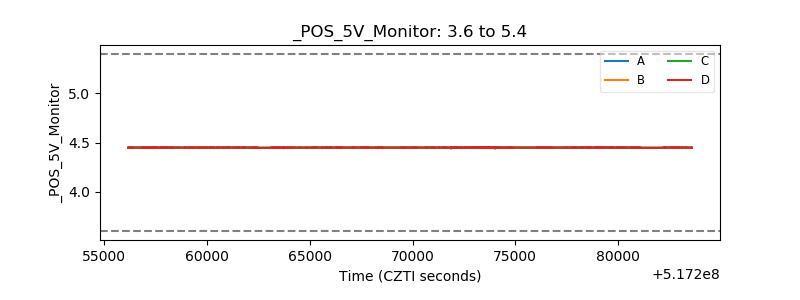 |
| _ROLL_ROT | 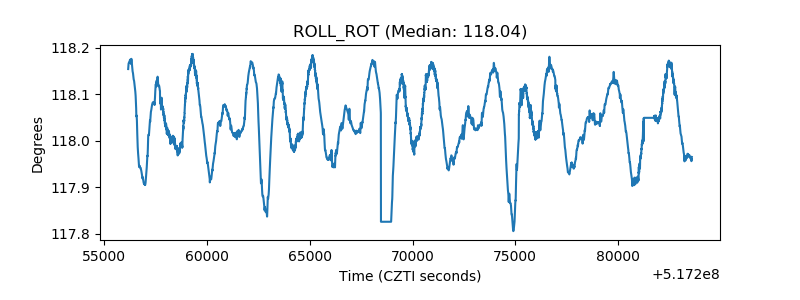 |
| _Roll_DEC | 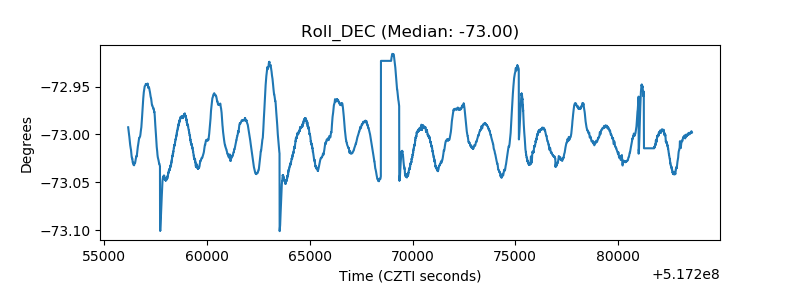 |
| _Roll_RA | 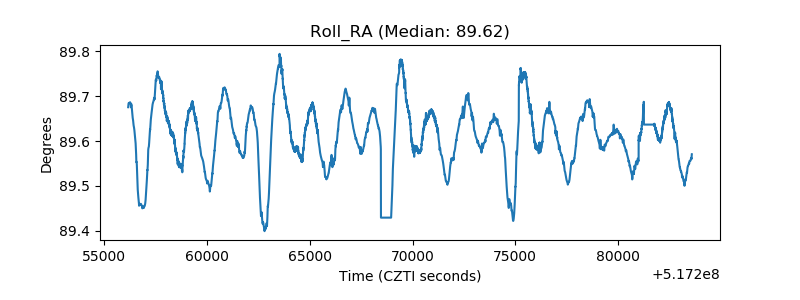 |
| Veto Counter | 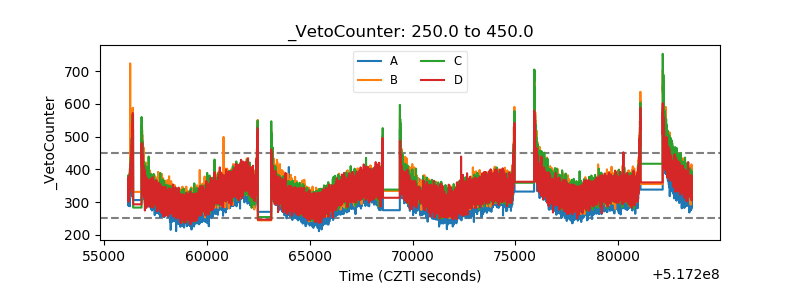 |