| Param | Original file | Final file |
|---|---|---|
| Filename | modeM0/AS1A14_070T08_9000006576_57640cztM0_level2.fits | modeM0/AS1A14_070T08_9000006576_57640cztM0_level2_quad_clean.evt |
| Size (bytes) | 652,199,040 | 86,192,640 |
| Size | 622.0 MB | 82.2 MB |
| Events in quadrant A | 3,664,710 | 629,621 |
| Events in quadrant B | 3,051,755 | 681,468 |
| Events in quadrant C | 4,612,226 | 594,048 |
| Events in quadrant D | 12,306,563 | 249,133 |
| Mode M0 | |||
|---|---|---|---|
| Quadrant | BADHDUFLAG | Total packets | Discarded packets |
| A | 0 | 15315 | 2 |
| B | 0 | 13601 | 2 |
| C | 0 | 18053 | 2 |
| D | 0 | 41048 | 2 |
| Mode M9 | |||
|---|---|---|---|
| Quadrant | BADHDUFLAG | Total packets | Discarded packets |
| A | 0 | 17 | 0 |
| B | 0 | 18 | 0 |
| C | 0 | 18 | 0 |
| D | 0 | 18 | 0 |
| Mode SS | |||
|---|---|---|---|
| Quadrant | BADHDUFLAG | Total packets | Discarded packets |
| A | 0 | 134 | 0 |
| B | 0 | 134 | 0 |
| C | 0 | 134 | 0 |
| D | 0 | 134 | 0 |
| Quadrant | Total seconds | Saturated seconds | Saturation percentage |
|---|---|---|---|
| A | 6527 | 64 | 0.980542% |
| B | 6527 | 89 | 1.363567% |
| C | 6527 | 257 | 3.937490% |
| D | 6527 | 3921 | 60.073541% |
Noise dominated data is calculated using 1-second bins in cleaned event files. If a bin has >2000 counts, and if more than 50% of those come from <1% of pixels, then it is considered to be noise-dominated and hence unusable.
| Quadrant | # 1 sec bins | Bins with >0 counts | Bins with >2000 counts | High rate bins dominated by noise | Noise dominated (total time) | Noise dominated (detector-on time) | Marked lightcurve |
|---|---|---|---|---|---|---|---|
| A | 8020 | 6811 | 7 | 7 | 0.09% | 0.10% | 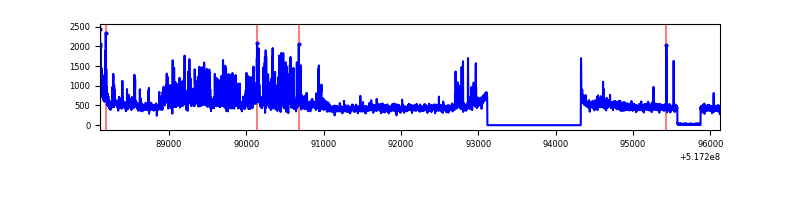 |
| B | 8020 | 6811 | 15 | 15 | 0.19% | 0.22% | 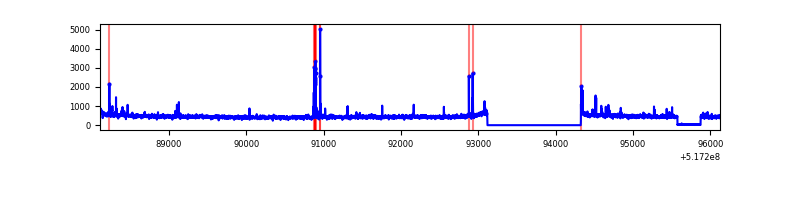 |
| C | 8020 | 6808 | 160 | 160 | 2.00% | 2.35% | 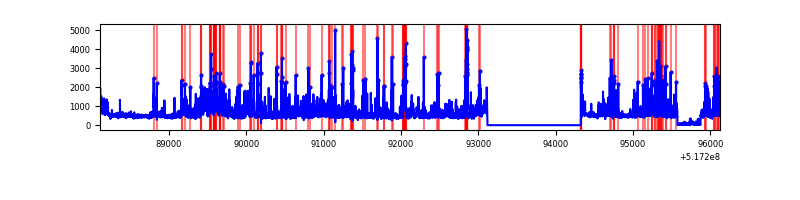 |
| D | 8020 | 6761 | 3300 | 3300 | 41.15% | 48.81% | 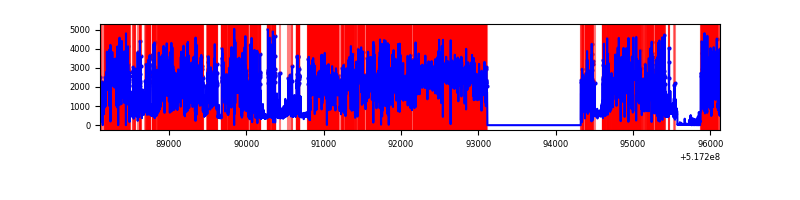 |
Top three noisy pixels from each quadrant. If the there are fewer than three noisy pixels in the level2.evt file, extra rows are filled as -1
| Pixel properties | Quadrant properties | ||||||
|---|---|---|---|---|---|---|---|
| Quadrant | DetID | PixID | Counts | Sigma | Mean | Median | Sigma |
| A | 3 | 14 | 667052 | 3679.28 | 737 | 720 | 181.1 |
| A | 7 | 64 | 83590 | 457.58 | 737 | 720 | 181.1 |
| A | 7 | 223 | 25497 | 136.81 | 737 | 720 | 181.1 |
| B | 0 | 213 | 70375 | 454.14 | 731 | 706 | 153.4 |
| B | 12 | 111 | 18478 | 115.85 | 731 | 706 | 153.4 |
| B | 11 | 111 | 17106 | 106.91 | 731 | 706 | 153.4 |
| C | 15 | 224 | 1268500 | 6570.46 | 716 | 708 | 193.0 |
| C | 6 | 13 | 314187 | 1624.64 | 716 | 708 | 193.0 |
| C | 7 | 2 | 117549 | 605.54 | 716 | 708 | 193.0 |
| D | 15 | 142 | 4601029 | 33851.9 | 475 | 453 | 135.9 |
| D | 8 | 240 | 4342310 | 31948.19 | 475 | 453 | 135.9 |
| D | 8 | 160 | 1121859 | 8251.51 | 475 | 453 | 135.9 |
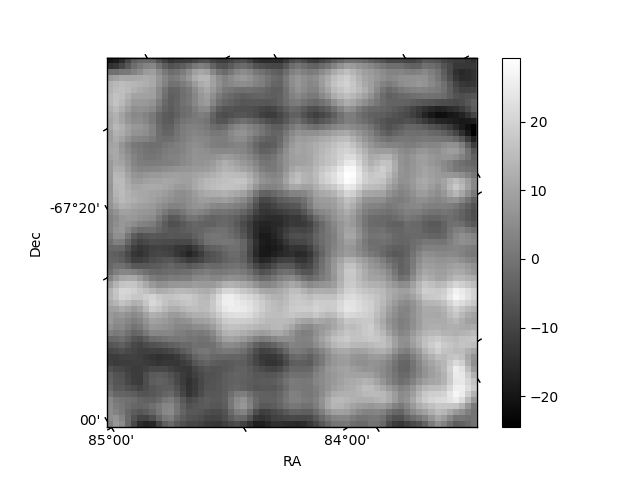
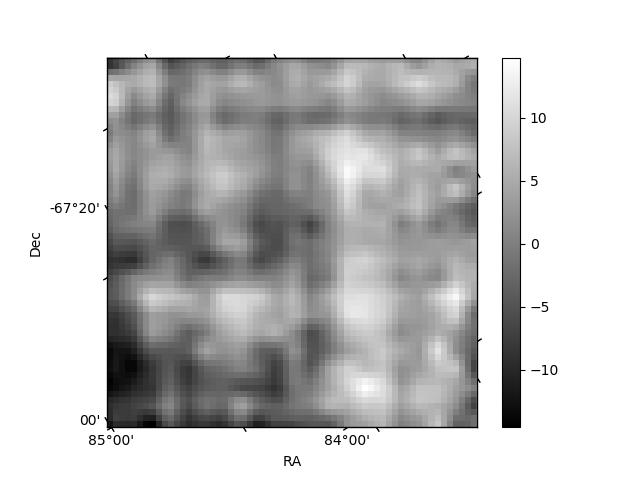
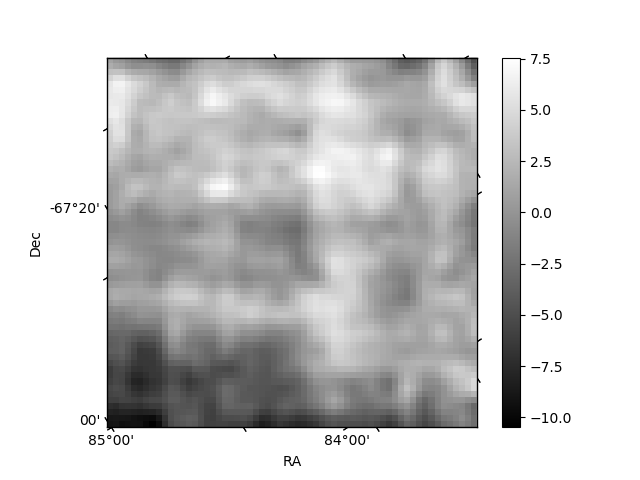
Histogram calculated using DETX and DETY for each event in the final _common_clean file
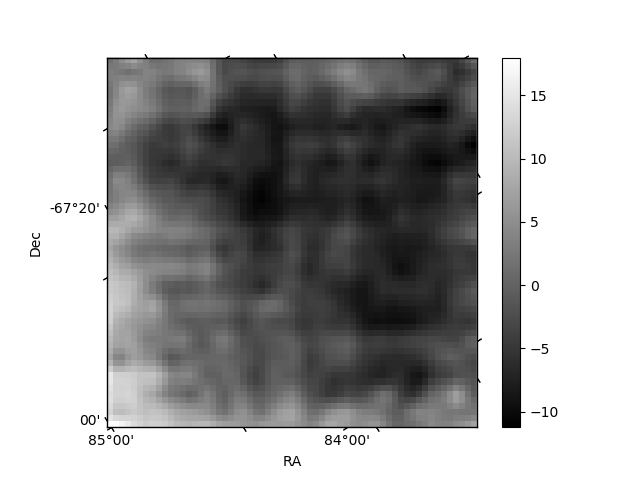
| Quadrant A | 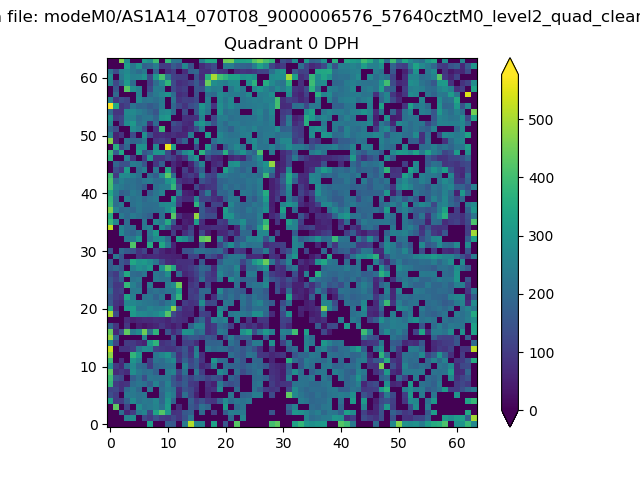 |
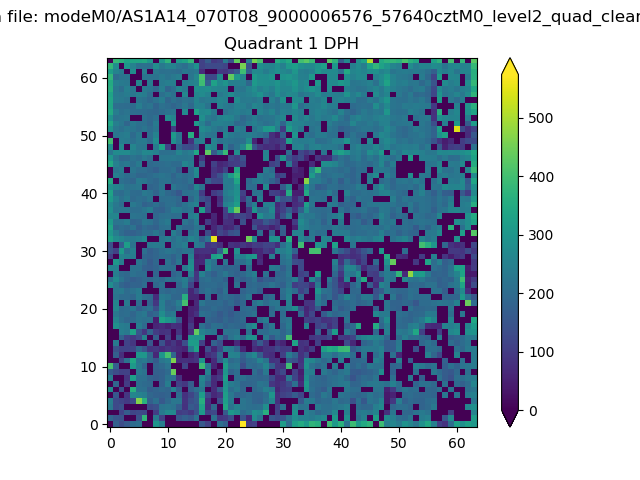 |
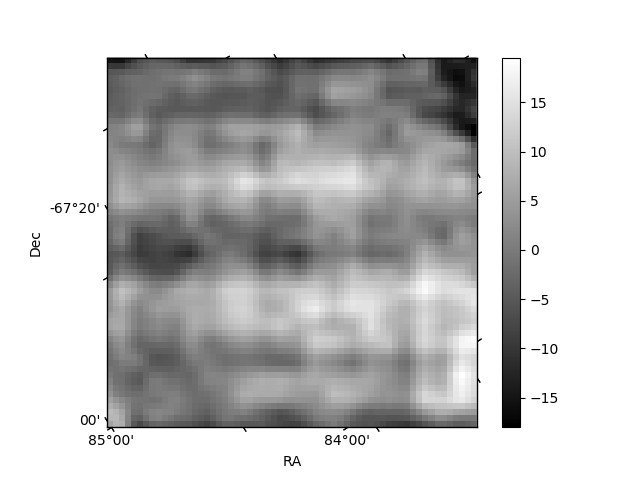
Quadrant B |
|---|---|---|---|
| Quadrant D | 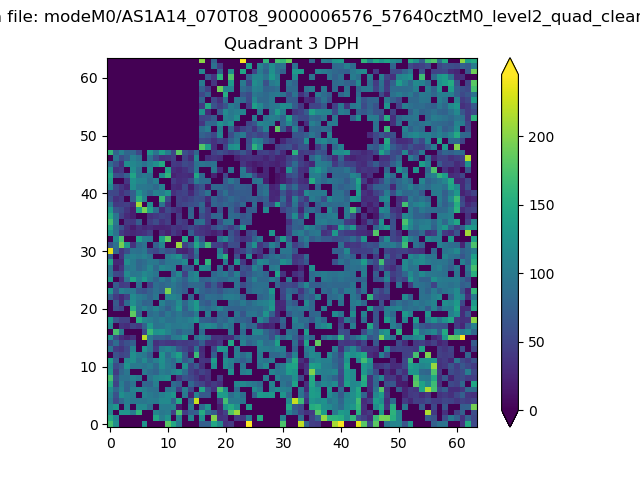 |
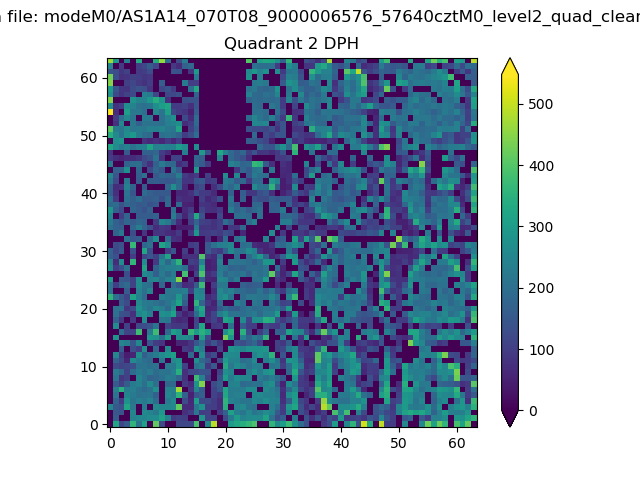 |
Quadrant C |
| Plot type | Count rate plots | Images |
|---|---|---|
| Comparison with Poisson distribution Blue bars denote a histogram of data divided into 1 sec bins. Red curve is a Poisson curve with rate = median count rate of data. |
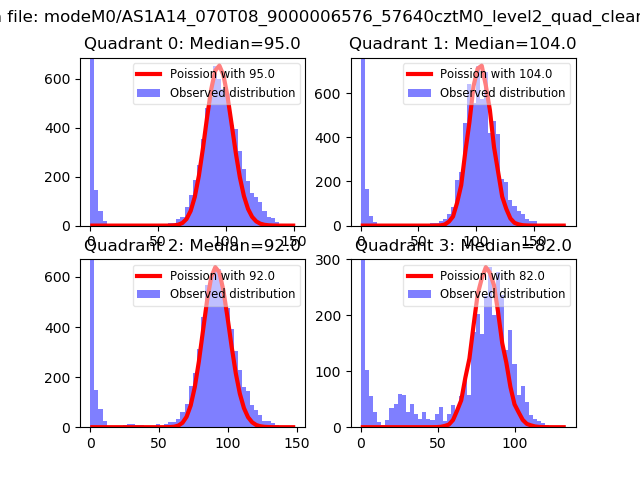 |
 |
| Quadrant-wise count rates Data is divided into 100 sec bins |
 |
|
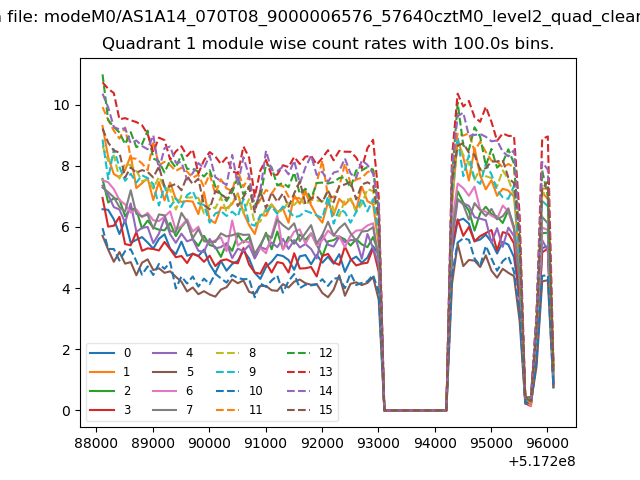
| Module-wise count rates for Quadrant A Data is divided into 100 sec bins |
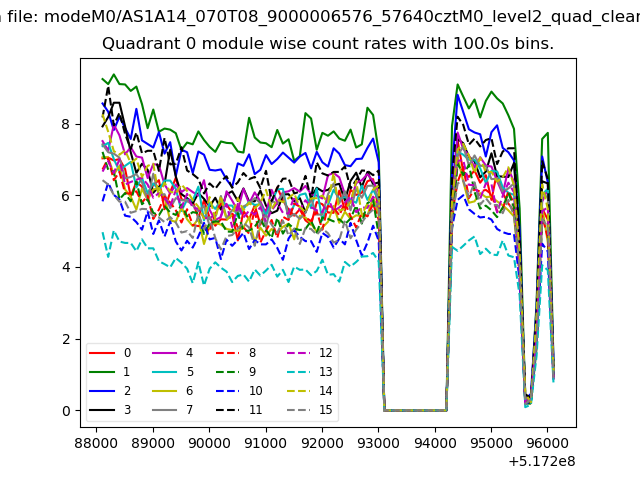 |
 |
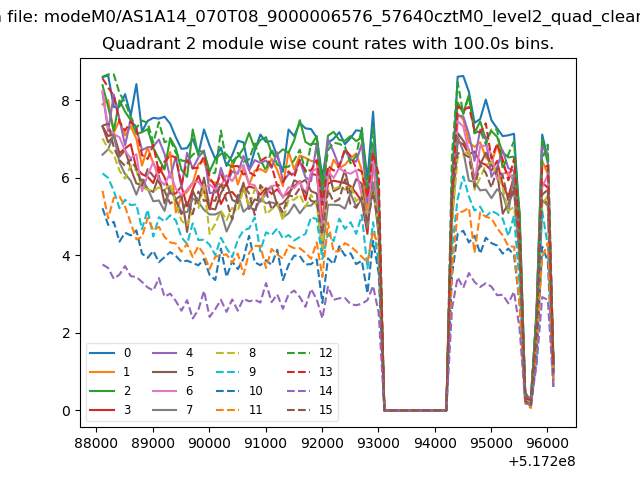
| Module-wise count rates for Quadrant B Data is divided into 100 sec bins |
 |
 |
| Module-wise count rates for Quadrant C Data is divided into 100 sec bins |
 |
 |
| Module-wise count rates for Quadrant D Data is divided into 100 sec bins |
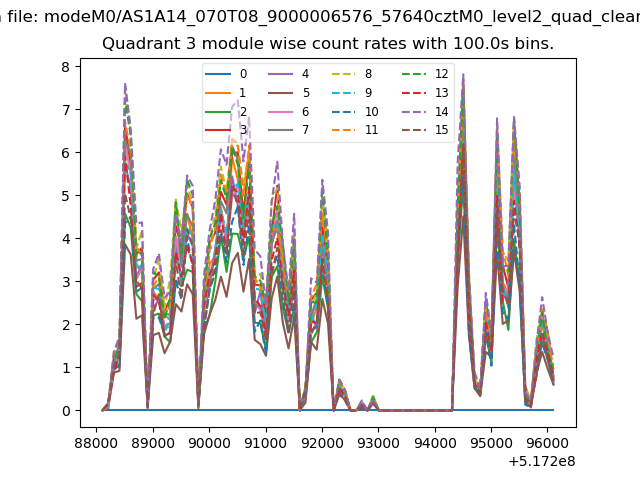 |
 |
| Parameter | Plot |
|---|---|
| CZT HV Monitor | 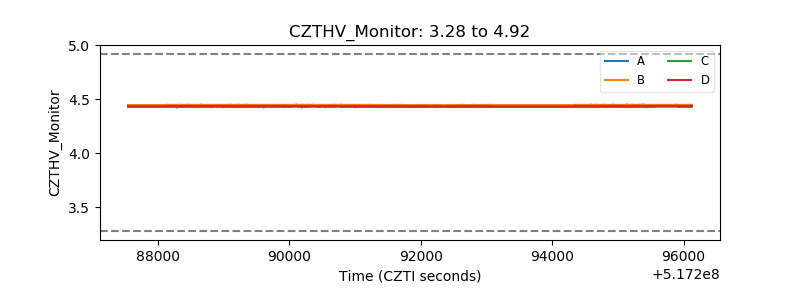 |
| D_VDD | 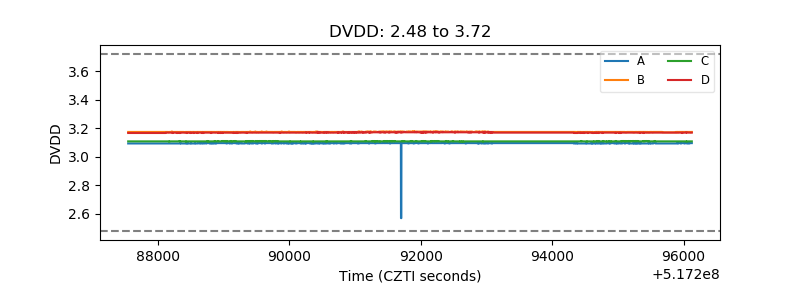 |
| Temperature 1 | 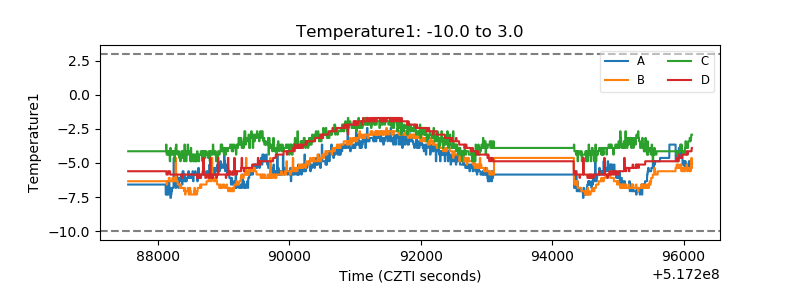 |
| Veto HV Monitor | 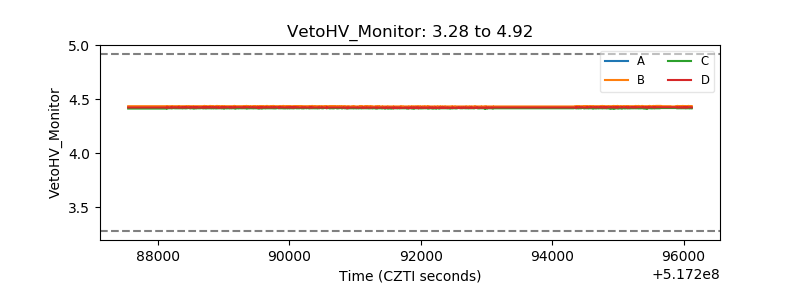 |
| Veto LLD | 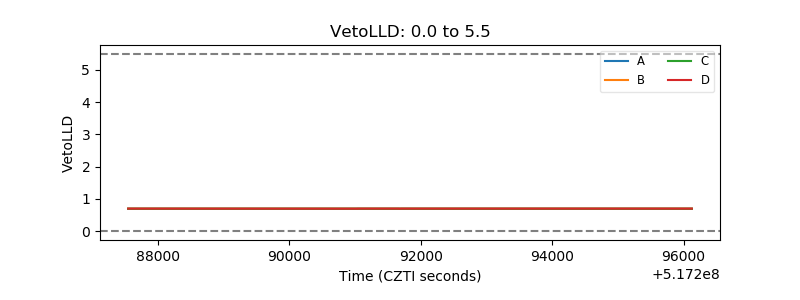 |
| Alpha Counter | 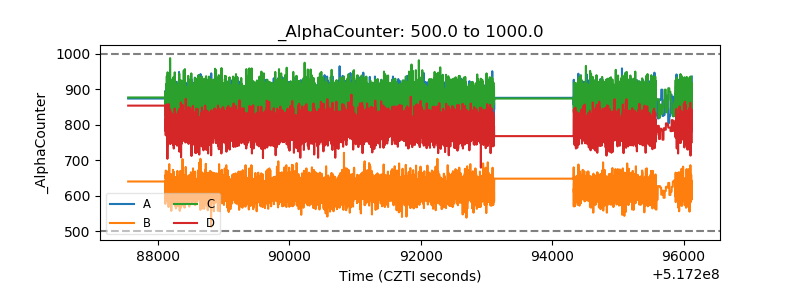 |
| _CPM_Rate | 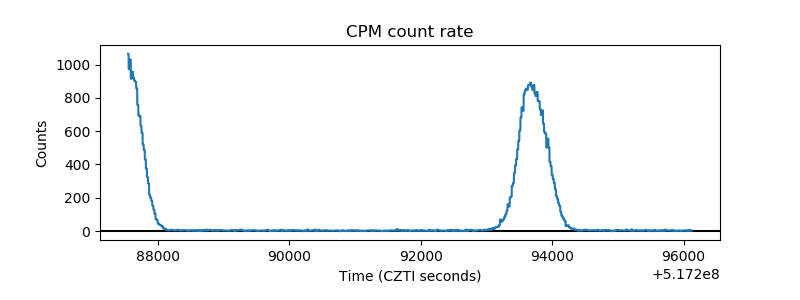 |
| CZT Counter | 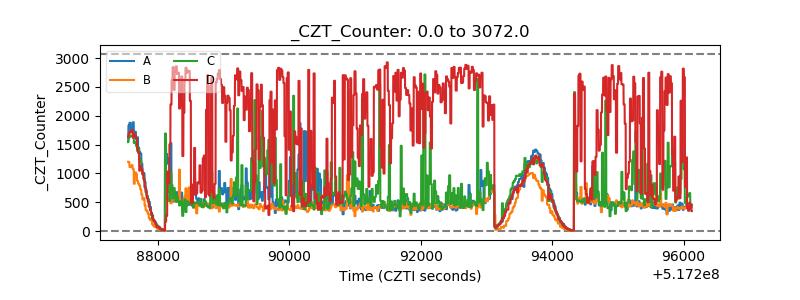 |
| +2.5 Volts monitor |  |
| +5 Volts monitor |  |
| _ROLL_ROT | 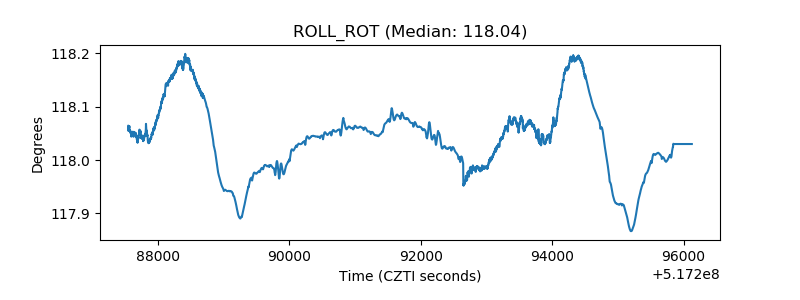 |
| _Roll_DEC | 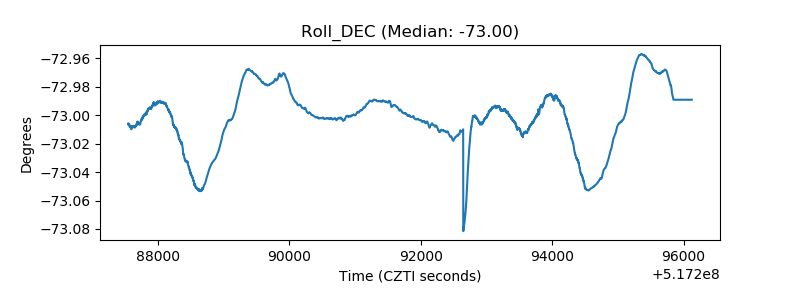 |
| _Roll_RA | 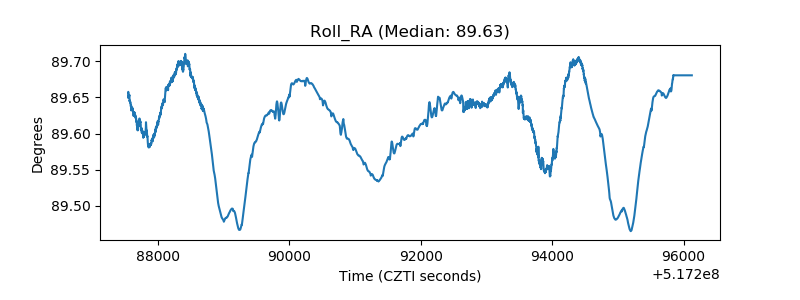 |
| Veto Counter | 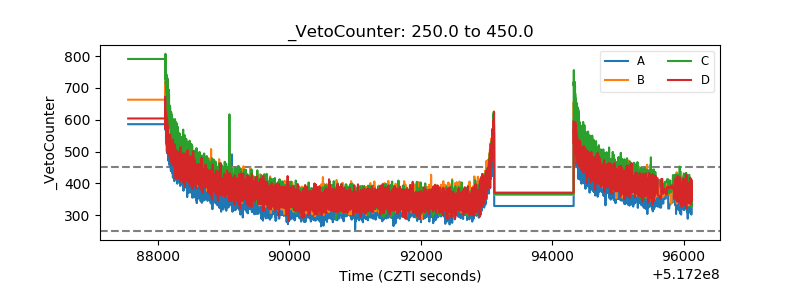 |