| Param | Original file | Final file |
|---|---|---|
| Filename | modeM0/AS1A14_125T09_9000006578_57643cztM0_level2.fits | modeM0/AS1A14_125T09_9000006578_57643cztM0_level2_quad_clean.evt |
| Size (bytes) | 507,409,920 | 100,419,840 |
| Size | 483.9 MB | 95.8 MB |
| Events in quadrant A | 4,592,780 | 626,932 |
| Events in quadrant B | 3,631,300 | 720,587 |
| Events in quadrant C | 4,786,207 | 633,098 |
| Events in quadrant D | 5,229,649 | 573,979 |
| Mode M9 | |||
|---|---|---|---|
| Quadrant | BADHDUFLAG | Total packets | Discarded packets |
| A | 0 | 7 | 0 |
| B | 0 | 7 | 0 |
| C | 0 | 7 | 0 |
| D | 0 | 7 | 0 |
| Mode SS | |||
|---|---|---|---|
| Quadrant | BADHDUFLAG | Total packets | Discarded packets |
| A | 0 | 140 | 0 |
| B | 0 | 140 | 0 |
| C | 0 | 140 | 0 |
| D | 0 | 140 | 0 |
| Mode M0 | |||
|---|---|---|---|
| Quadrant | BADHDUFLAG | Total packets | Discarded packets |
| A | 0 | 18728 | 1 |
| B | 0 | 15621 | 1 |
| C | 0 | 19139 | 1 |
| D | 0 | 20234 | 1 |
| Quadrant | Total seconds | Saturated seconds | Saturation percentage |
|---|---|---|---|
| A | 6982 | 604 | 8.650816% |
| B | 6983 | 155 | 2.219676% |
| C | 6983 | 353 | 5.055134% |
| D | 6983 | 545 | 7.804668% |
Noise dominated data is calculated using 1-second bins in cleaned event files. If a bin has >2000 counts, and if more than 50% of those come from <1% of pixels, then it is considered to be noise-dominated and hence unusable.
| Quadrant | # 1 sec bins | Bins with >0 counts | Bins with >2000 counts | High rate bins dominated by noise | Noise dominated (total time) | Noise dominated (detector-on time) | Marked lightcurve |
|---|---|---|---|---|---|---|---|
| A | 7677 | 6983 | 351 | 351 | 4.57% | 5.03% | 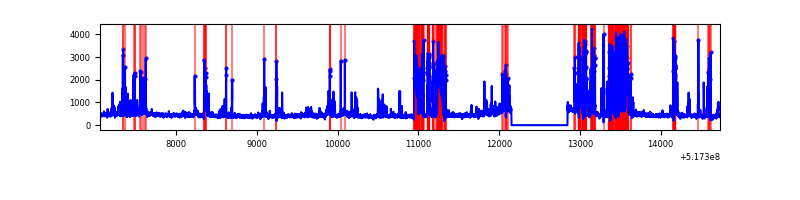 |
| B | 7678 | 6984 | 40 | 40 | 0.52% | 0.57% | 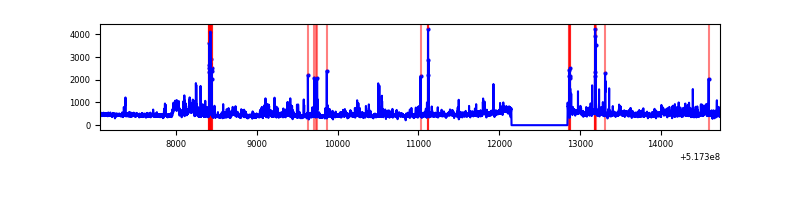 |
| C | 7678 | 6984 | 237 | 237 | 3.09% | 3.39% | 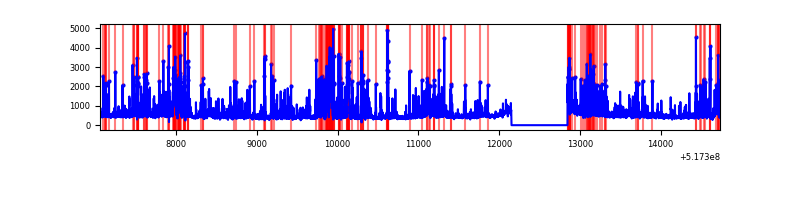 |
| D | 7678 | 6984 | 449 | 449 | 5.85% | 6.43% | 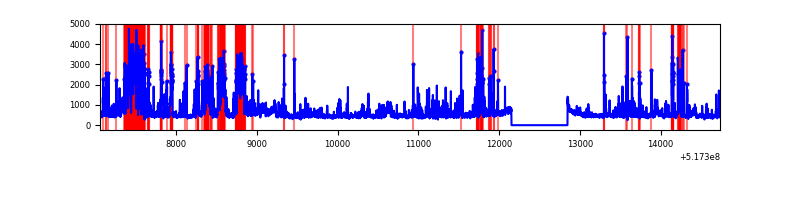 |
Top three noisy pixels from each quadrant. If the there are fewer than three noisy pixels in the level2.evt file, extra rows are filled as -1
| Pixel properties | Quadrant properties | ||||||
|---|---|---|---|---|---|---|---|
| Quadrant | DetID | PixID | Counts | Sigma | Mean | Median | Sigma |
| A | 7 | 223 | 1622546 | 8986.93 | 735 | 715 | 180.5 |
| A | 3 | 14 | 74093 | 406.6 | 735 | 715 | 180.5 |
| A | 10 | 251 | 30908 | 167.3 | 735 | 715 | 180.5 |
| B | 0 | 216 | 188900 | 1183.06 | 745 | 716 | 159.1 |
| B | 10 | 247 | 134627 | 841.86 | 745 | 716 | 159.1 |
| B | 5 | 172 | 126791 | 792.6 | 745 | 716 | 159.1 |
| C | 15 | 224 | 1606437 | 8129.04 | 728 | 720 | 197.5 |
| C | 14 | 254 | 129420 | 651.55 | 728 | 720 | 197.5 |
| C | 10 | 21 | 119261 | 600.12 | 728 | 720 | 197.5 |
| D | 8 | 160 | 1009260 | 5002.46 | 718 | 686 | 201.6 |
| D | 8 | 240 | 996240 | 4937.88 | 718 | 686 | 201.6 |
| D | 5 | 38 | 55317 | 270.97 | 718 | 686 | 201.6 |
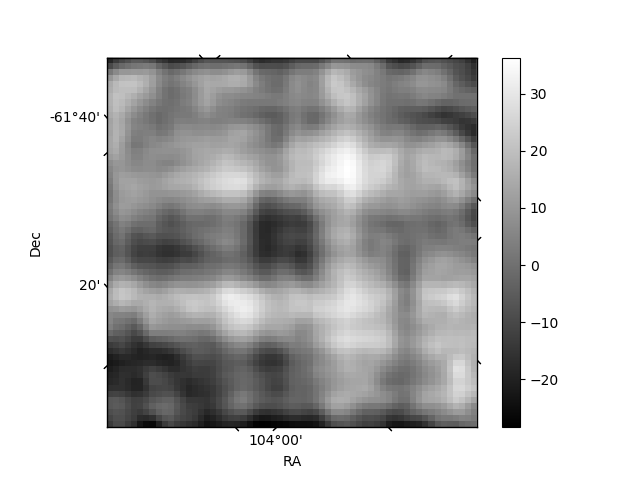
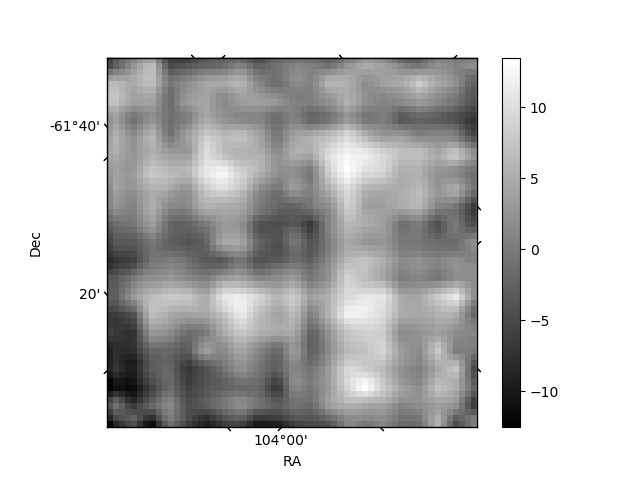
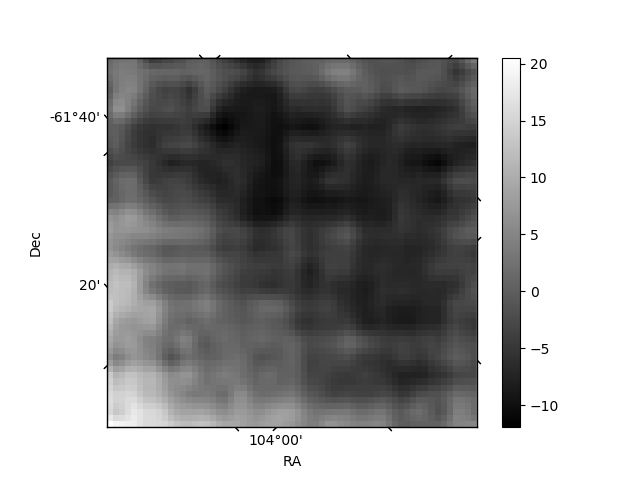
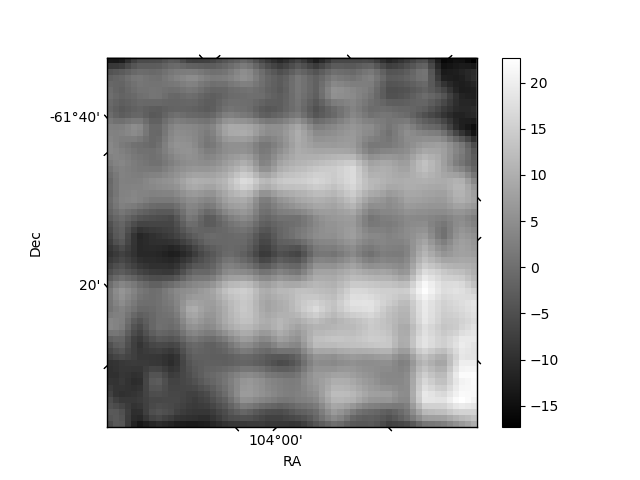
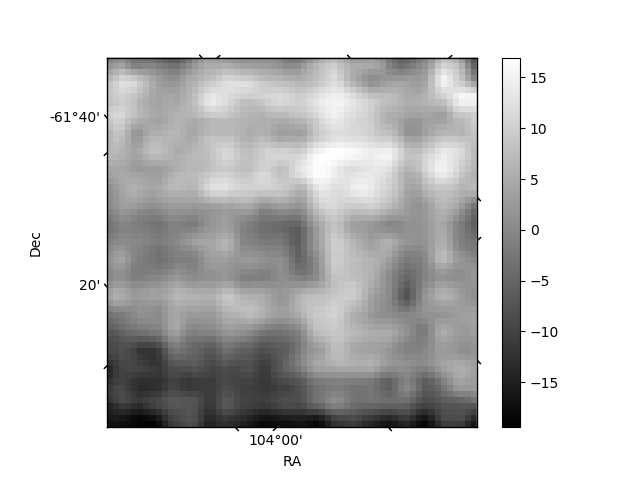
Histogram calculated using DETX and DETY for each event in the final _common_clean file
| Quadrant A | 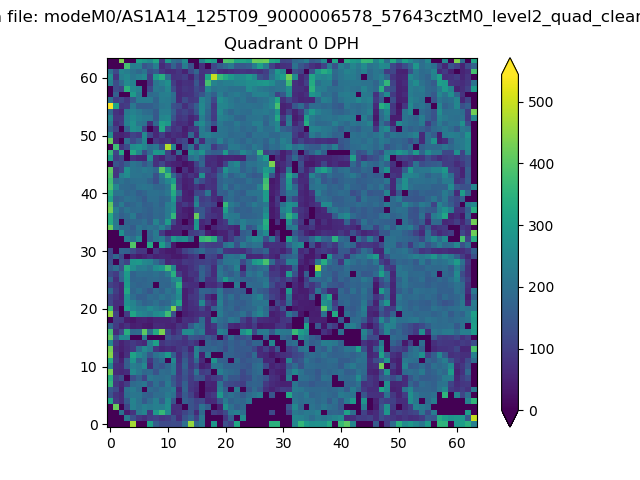 |
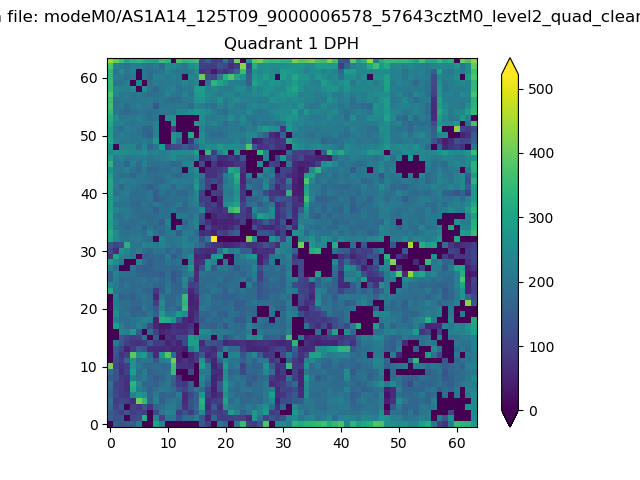 |
Quadrant B |
|---|---|---|---|
| Quadrant D | 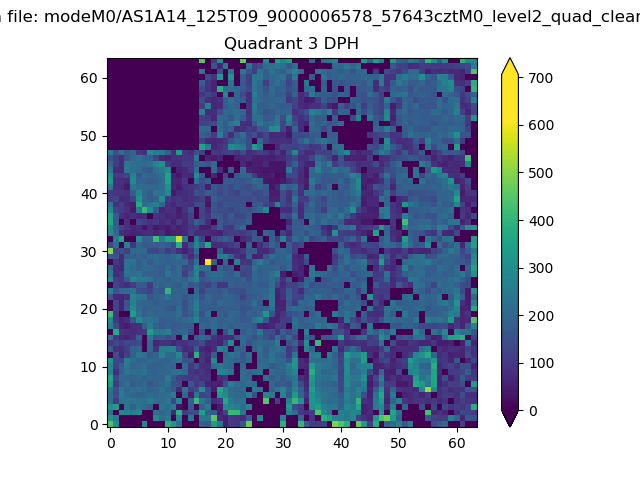 |
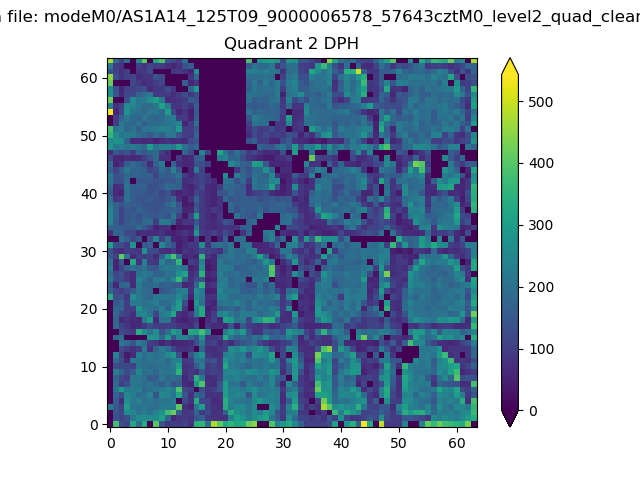 |
Quadrant C |
| Plot type | Count rate plots | Images |
|---|---|---|
| Comparison with Poisson distribution Blue bars denote a histogram of data divided into 1 sec bins. Red curve is a Poisson curve with rate = median count rate of data. |
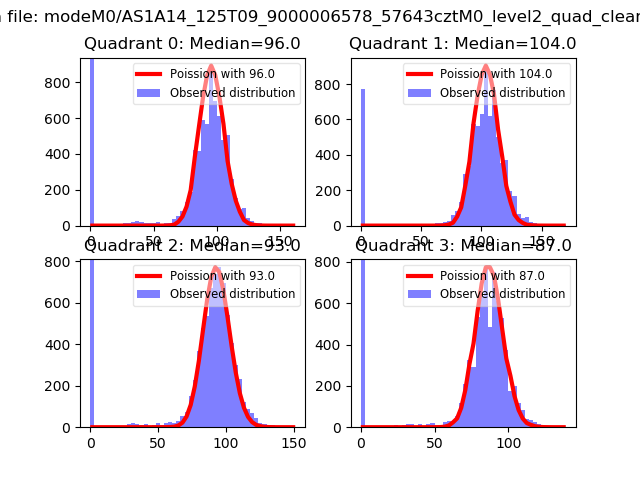 |
 |
| Quadrant-wise count rates Data is divided into 100 sec bins |
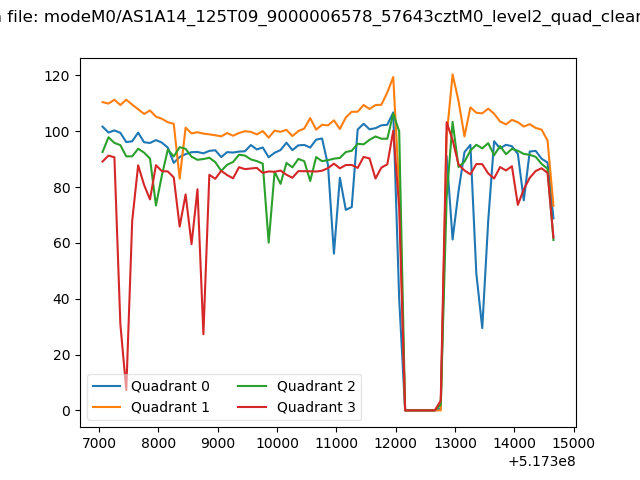 |
|
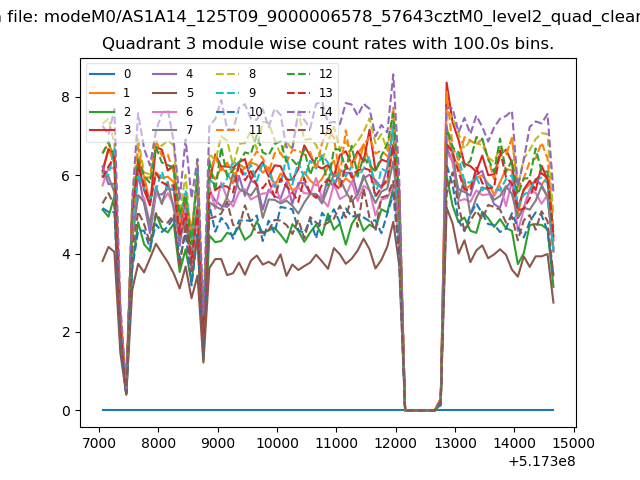
| Module-wise count rates for Quadrant A Data is divided into 100 sec bins |
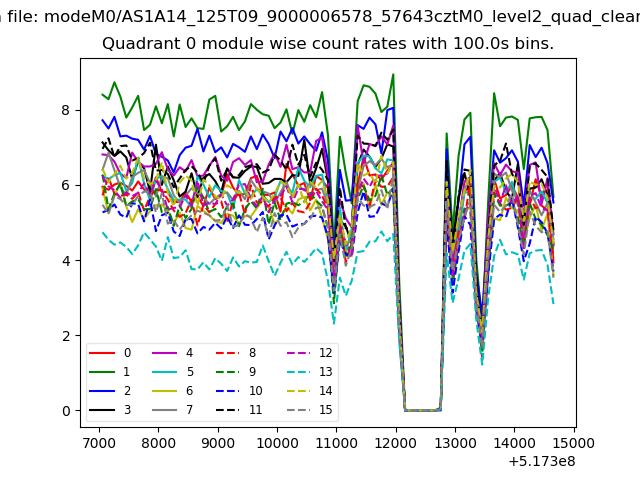 |
 |
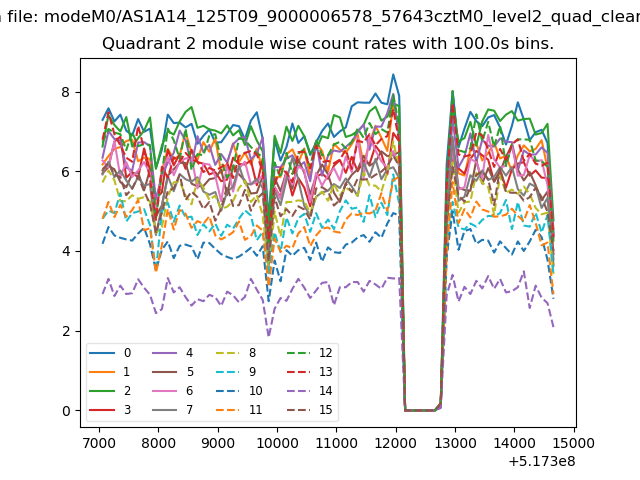
| Module-wise count rates for Quadrant B Data is divided into 100 sec bins |
 |
 |
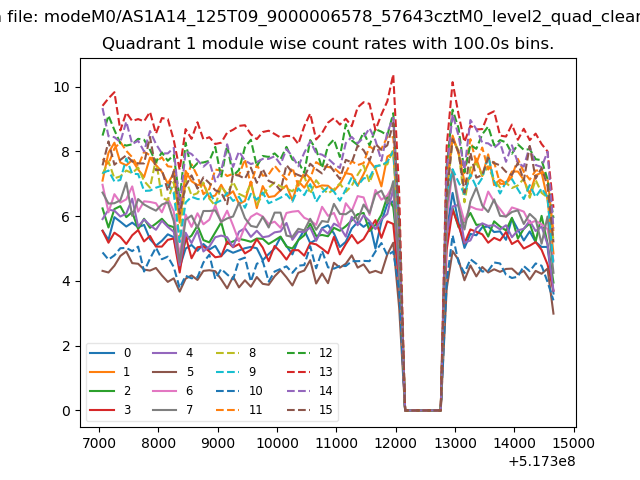
| Module-wise count rates for Quadrant C Data is divided into 100 sec bins |
 |
 |
| Module-wise count rates for Quadrant D Data is divided into 100 sec bins |
 |
 |
| Parameter | Plot |
|---|---|
| CZT HV Monitor | 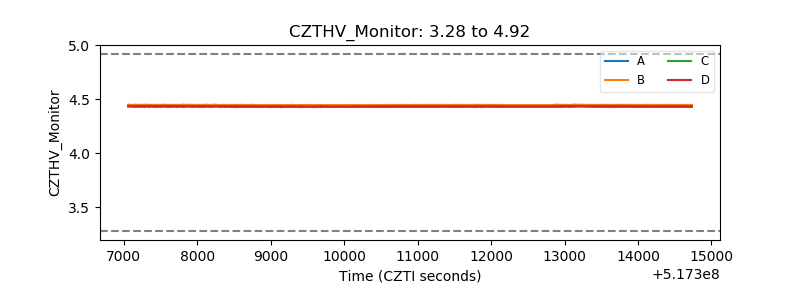 |
| D_VDD | 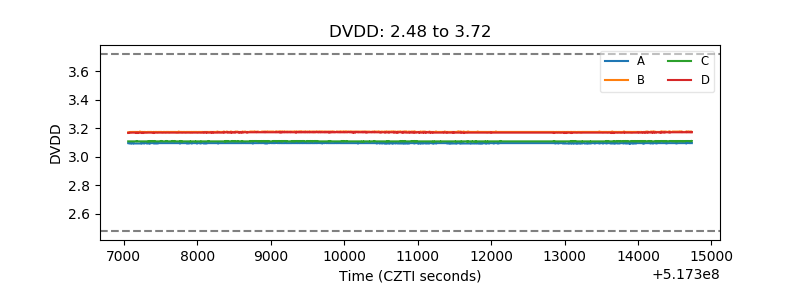 |
| Temperature 1 | 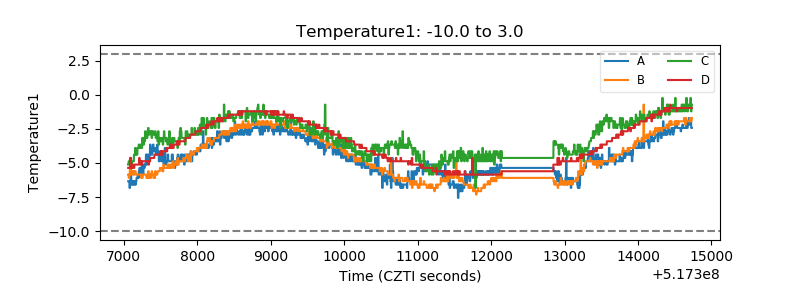 |
| Veto HV Monitor | 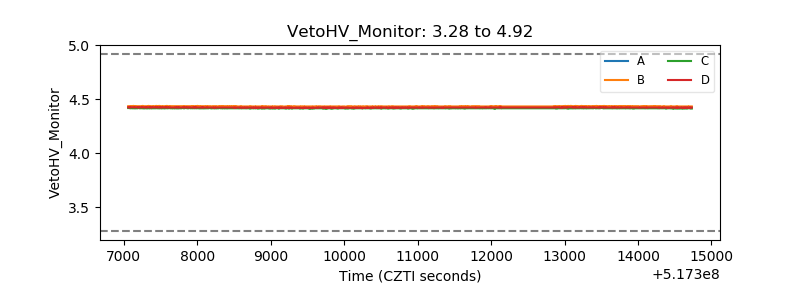 |
| Veto LLD | 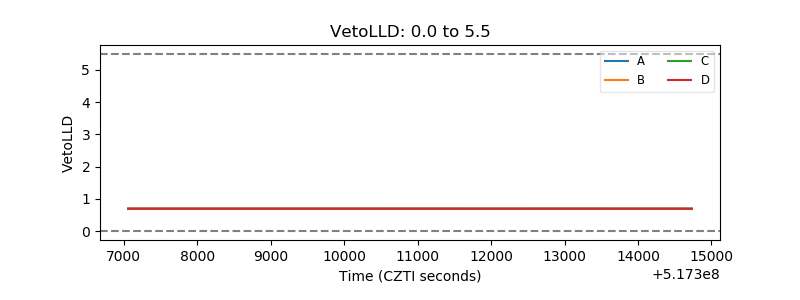 |
| Alpha Counter | 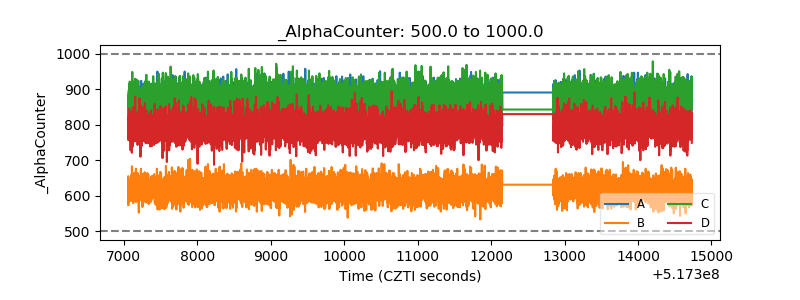 |
| _CPM_Rate | 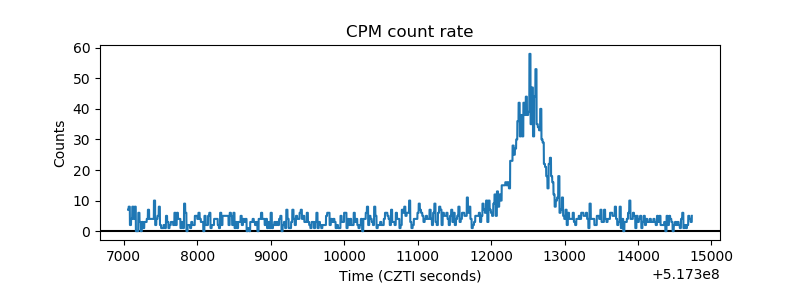 |
| CZT Counter | 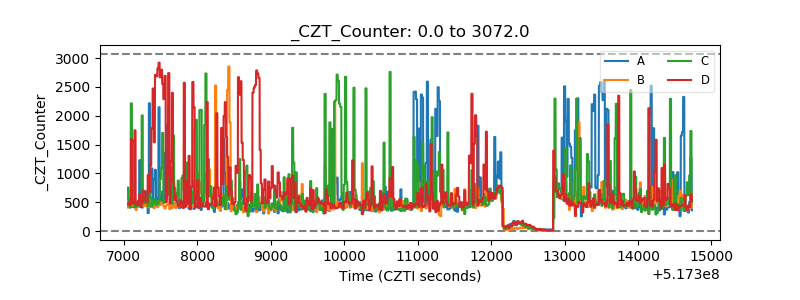 |
| +2.5 Volts monitor | 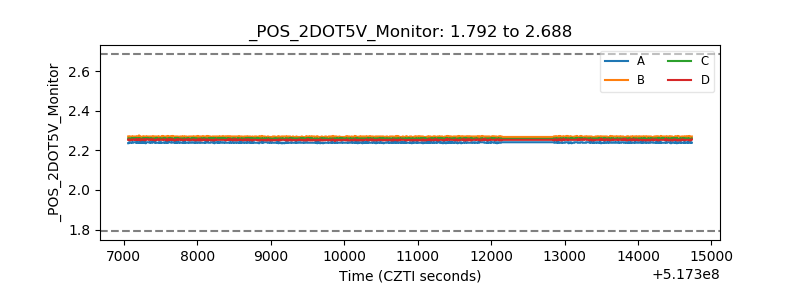 |
| +5 Volts monitor |  |
| _ROLL_ROT | 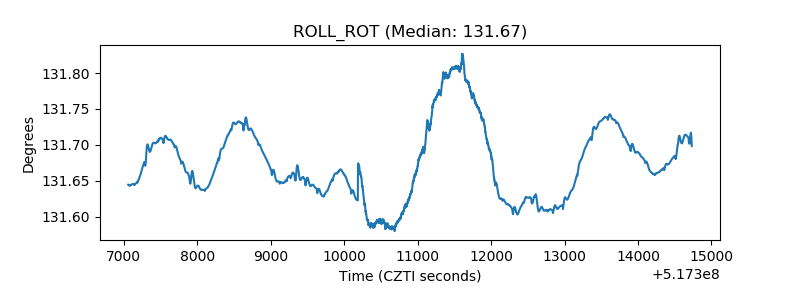 |
| _Roll_DEC | 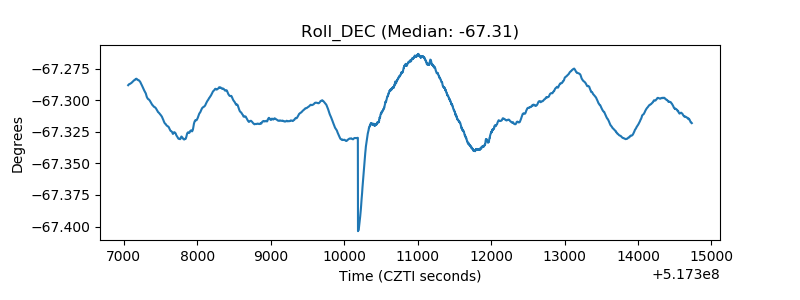 |
| _Roll_RA | 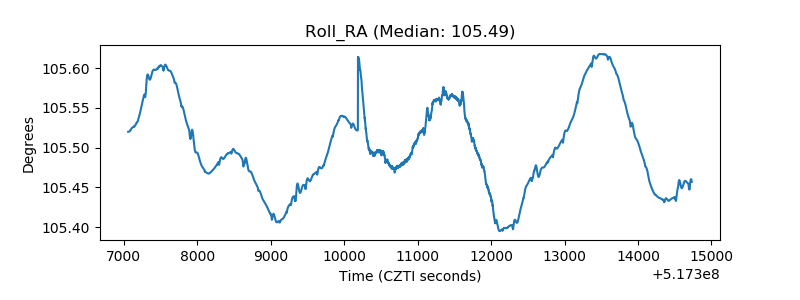 |
| Veto Counter | 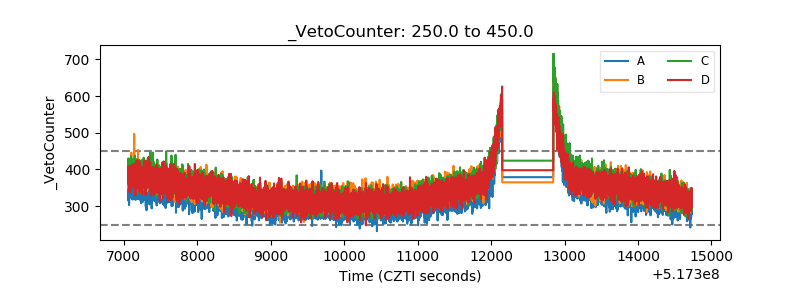 |