| Param | Original file | Final file |
|---|---|---|
| Filename | modeM0/AS1A14_125T09_9000006578_57644cztM0_level2.fits | modeM0/AS1A14_125T09_9000006578_57644cztM0_level2_quad_clean.evt |
| Size (bytes) | 505,730,880 | 100,632,960 |
| Size | 482.3 MB | 96.0 MB |
| Events in quadrant A | 3,524,993 | 660,607 |
| Events in quadrant B | 4,054,273 | 717,157 |
| Events in quadrant C | 5,879,601 | 594,270 |
| Events in quadrant D | 4,716,377 | 585,856 |
| Mode SS | |||
|---|---|---|---|
| Quadrant | BADHDUFLAG | Total packets | Discarded packets |
| A | 0 | 142 | 0 |
| B | 0 | 142 | 0 |
| C | 0 | 142 | 0 |
| D | 0 | 142 | 0 |
| Mode M0 | |||
|---|---|---|---|
| Quadrant | BADHDUFLAG | Total packets | Discarded packets |
| A | 0 | 15760 | 0 |
| B | 0 | 16902 | 0 |
| C | 0 | 22427 | 0 |
| D | 0 | 18835 | 0 |
| Quadrant | Total seconds | Saturated seconds | Saturation percentage |
|---|---|---|---|
| A | 7016 | 250 | 3.563284% |
| B | 7017 | 178 | 2.536697% |
| C | 7017 | 780 | 11.115861% |
| D | 7017 | 409 | 5.828702% |
Noise dominated data is calculated using 1-second bins in cleaned event files. If a bin has >2000 counts, and if more than 50% of those come from <1% of pixels, then it is considered to be noise-dominated and hence unusable.
| Quadrant | # 1 sec bins | Bins with >0 counts | Bins with >2000 counts | High rate bins dominated by noise | Noise dominated (total time) | Noise dominated (detector-on time) | Marked lightcurve |
|---|---|---|---|---|---|---|---|
| A | 7016 | 7016 | 92 | 92 | 1.31% | 1.31% | 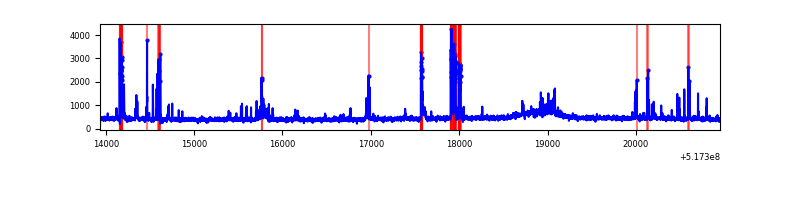 |
| B | 7017 | 7017 | 22 | 22 | 0.31% | 0.31% | 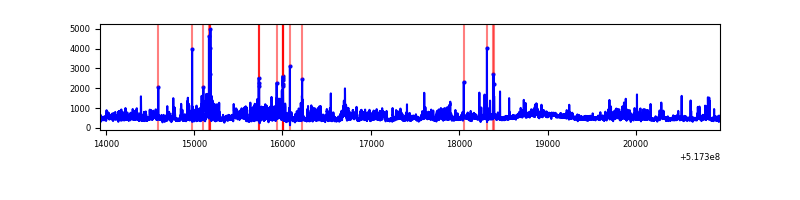 |
| C | 7017 | 7017 | 533 | 533 | 7.60% | 7.60% | 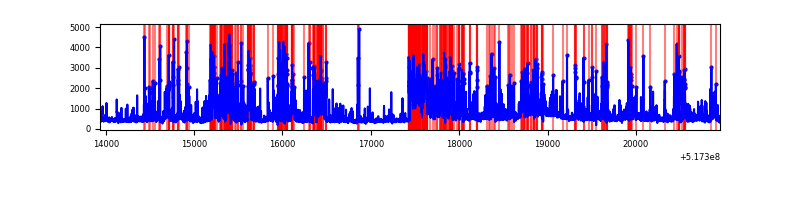 |
| D | 7017 | 7017 | 315 | 315 | 4.49% | 4.49% | 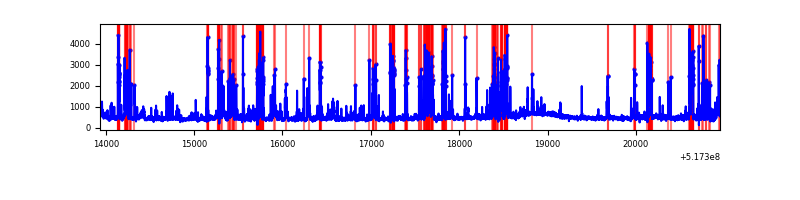 |
Top three noisy pixels from each quadrant. If the there are fewer than three noisy pixels in the level2.evt file, extra rows are filled as -1
| Pixel properties | Quadrant properties | ||||||
|---|---|---|---|---|---|---|---|
| Quadrant | DetID | PixID | Counts | Sigma | Mean | Median | Sigma |
| A | 7 | 223 | 509073 | 2686.31 | 765 | 744 | 189.2 |
| A | 4 | 3 | 20350 | 103.61 | 765 | 744 | 189.2 |
| A | 3 | 245 | 17941 | 90.88 | 765 | 744 | 189.2 |
| B | 0 | 216 | 733381 | 4589.77 | 756 | 728 | 159.6 |
| B | 10 | 247 | 67498 | 418.29 | 756 | 728 | 159.6 |
| B | 0 | 213 | 46838 | 288.86 | 756 | 728 | 159.6 |
| C | 15 | 224 | 2022558 | 10349.52 | 718 | 711 | 195.4 |
| C | 10 | 22 | 665484 | 3402.87 | 718 | 711 | 195.4 |
| C | 12 | 2 | 146585 | 746.7 | 718 | 711 | 195.4 |
| D | 8 | 240 | 1147297 | 5518.89 | 736 | 702 | 207.8 |
| D | 13 | 138 | 192966 | 925.42 | 736 | 702 | 207.8 |
| D | 3 | 12 | 90927 | 434.28 | 736 | 702 | 207.8 |
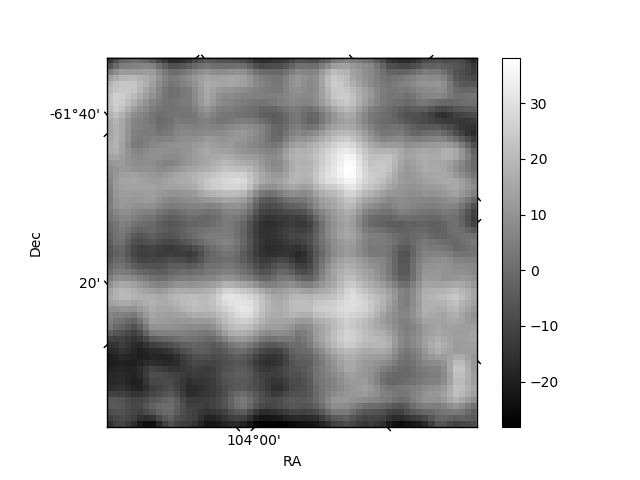
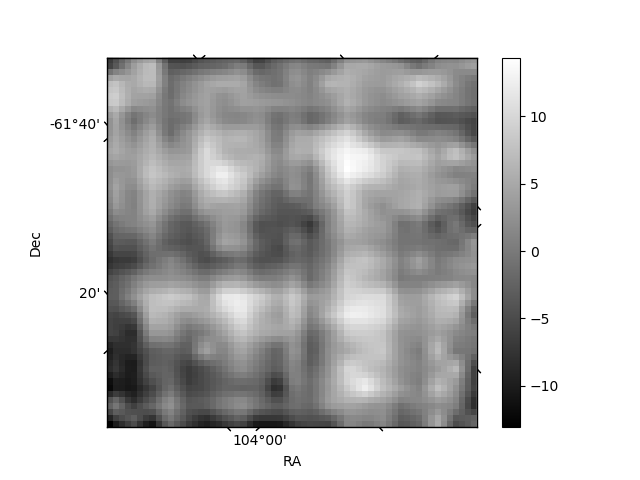
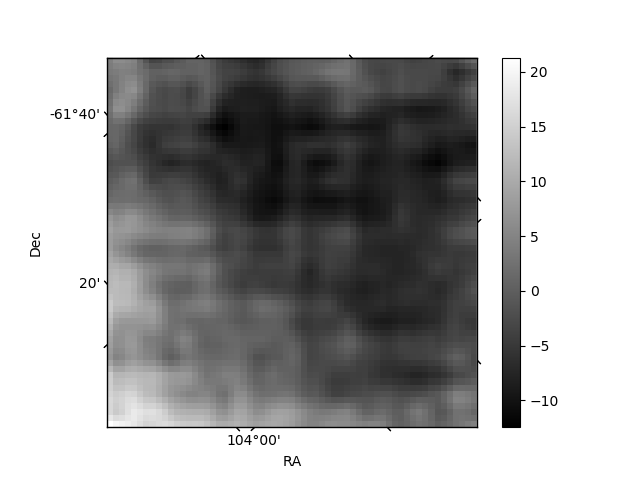
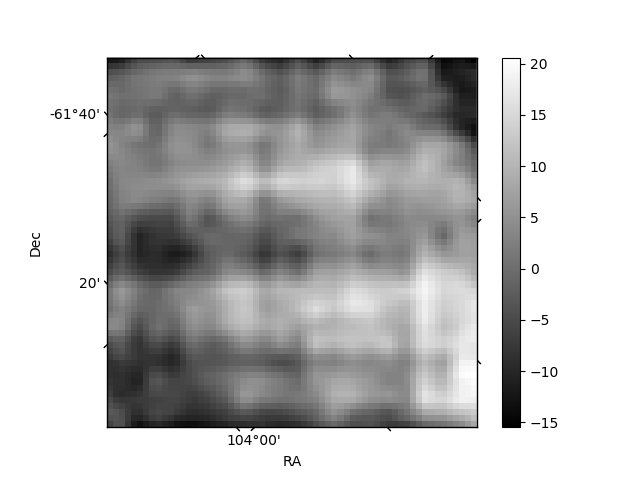
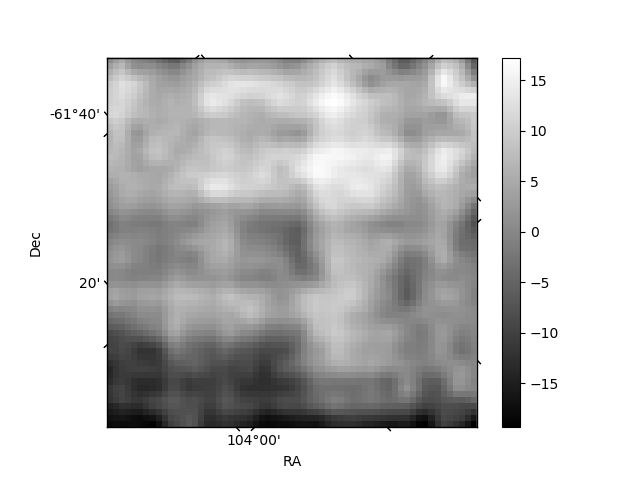
Histogram calculated using DETX and DETY for each event in the final _common_clean file
| Quadrant A | 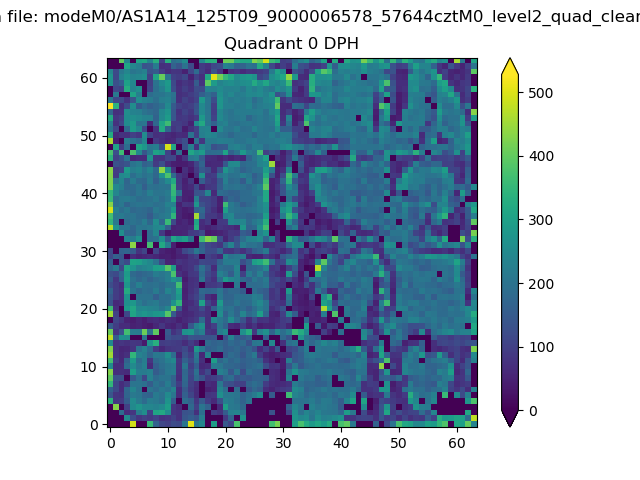 |
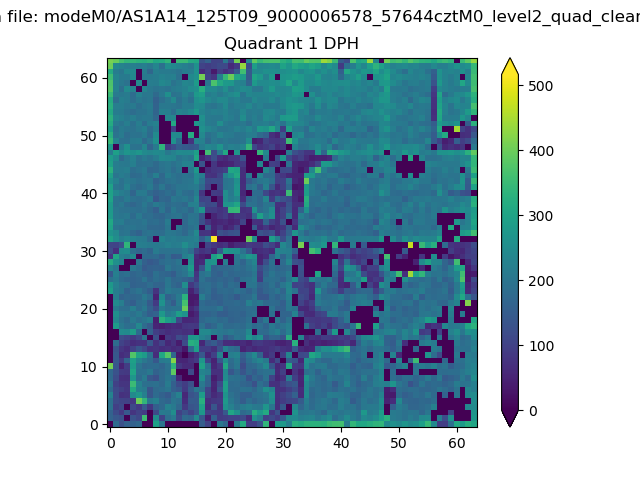 |
Quadrant B |
|---|---|---|---|
| Quadrant D | 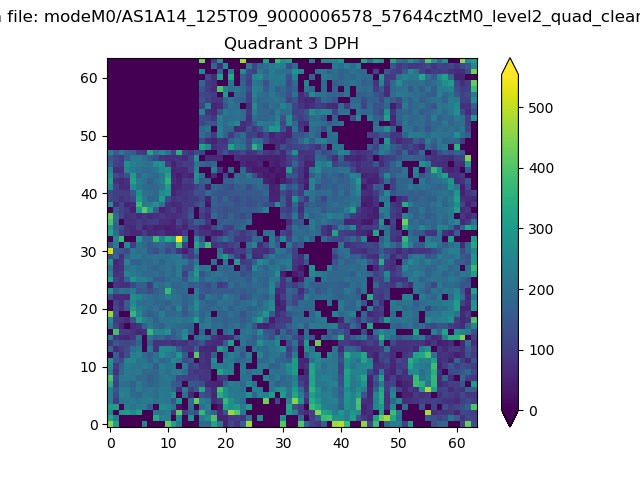 |
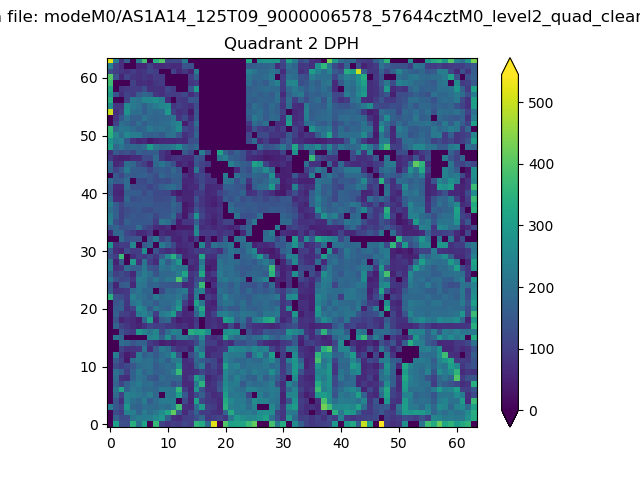 |
Quadrant C |
| Plot type | Count rate plots | Images |
|---|---|---|
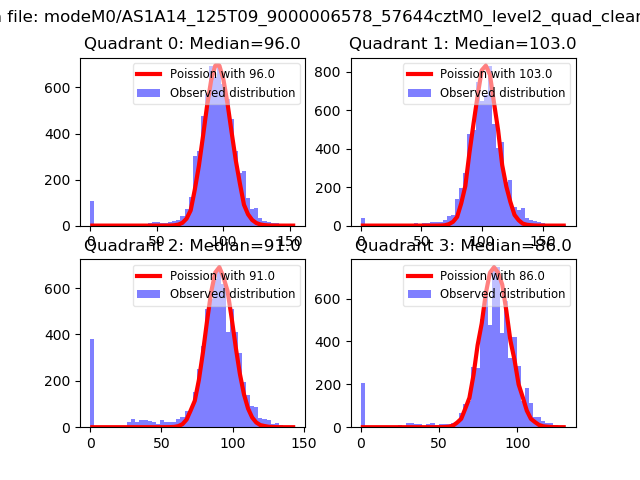
| Comparison with Poisson distribution Blue bars denote a histogram of data divided into 1 sec bins. Red curve is a Poisson curve with rate = median count rate of data. |
 |
 |
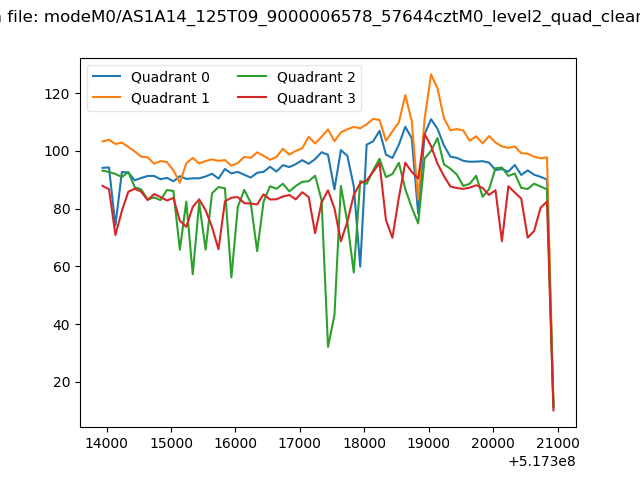
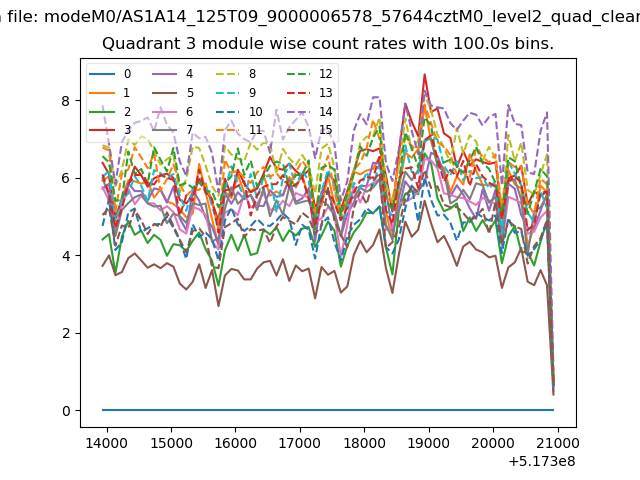
| Quadrant-wise count rates Data is divided into 100 sec bins |
 |
|
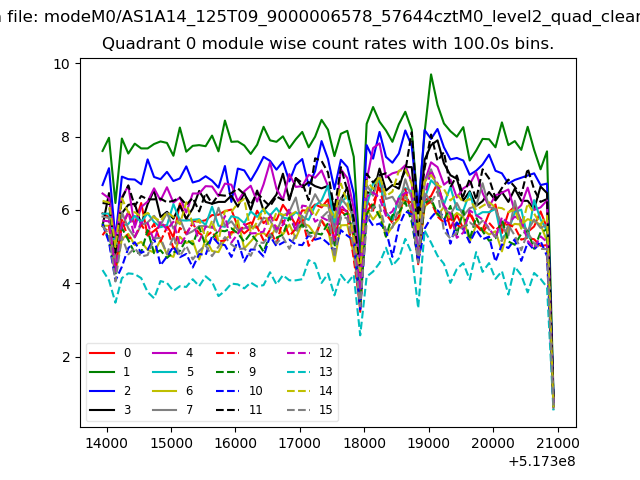
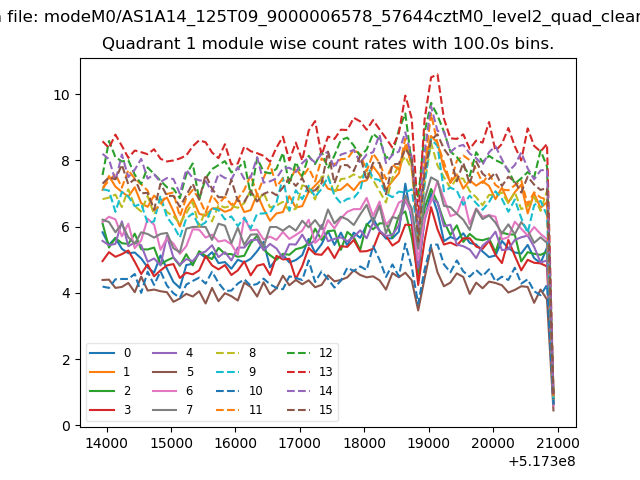
| Module-wise count rates for Quadrant A Data is divided into 100 sec bins |
 |
 |
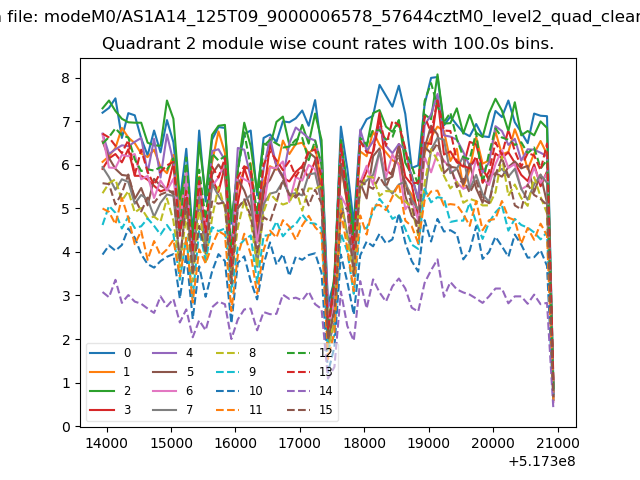
| Module-wise count rates for Quadrant B Data is divided into 100 sec bins |
 |
 |
| Module-wise count rates for Quadrant C Data is divided into 100 sec bins |
 |
 |
| Module-wise count rates for Quadrant D Data is divided into 100 sec bins |
 |
 |
| Parameter | Plot |
|---|---|
| CZT HV Monitor |  |
| D_VDD | 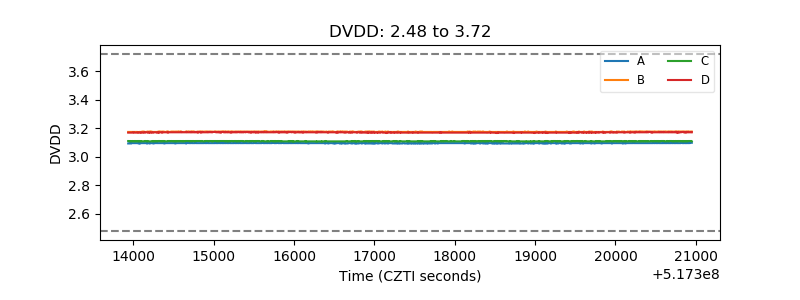 |
| Temperature 1 | 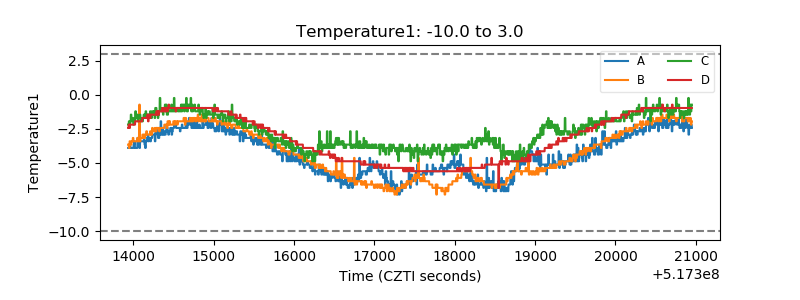 |
| Veto HV Monitor | 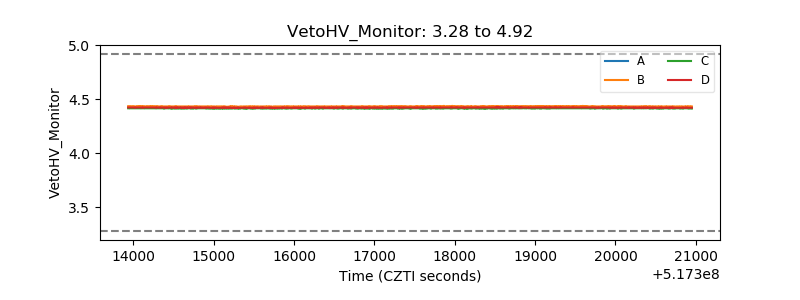 |
| Veto LLD | 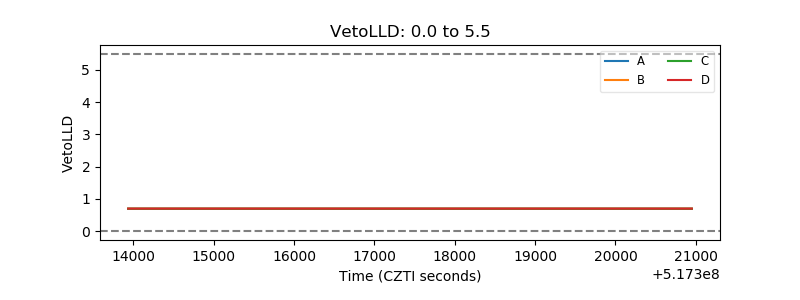 |
| Alpha Counter | 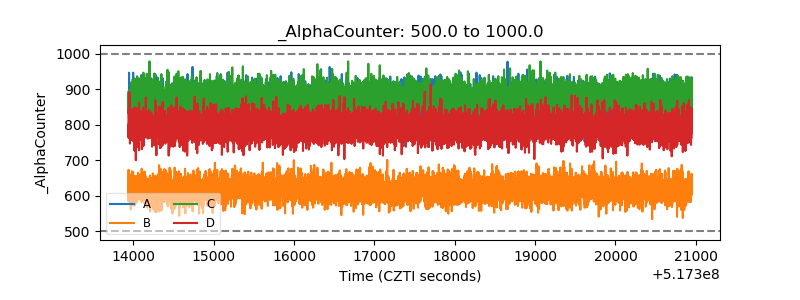 |
| _CPM_Rate | 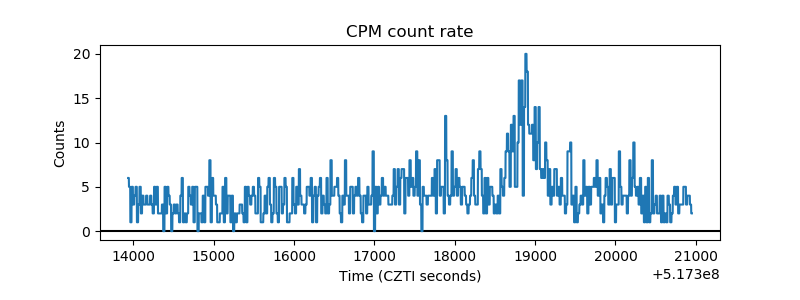 |
| CZT Counter | 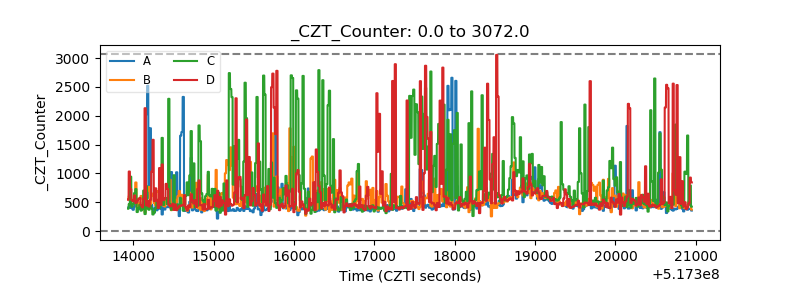 |
| +2.5 Volts monitor |  |
| +5 Volts monitor |  |
| _ROLL_ROT | 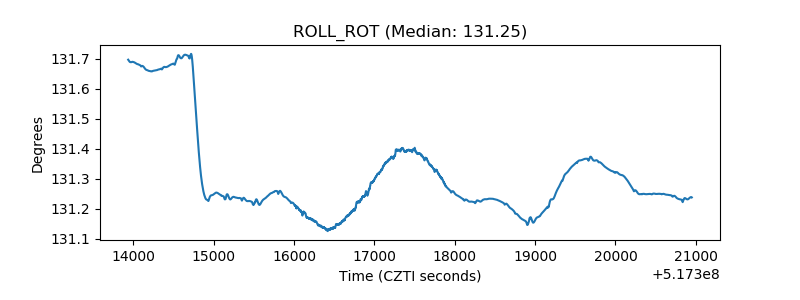 |
| _Roll_DEC | 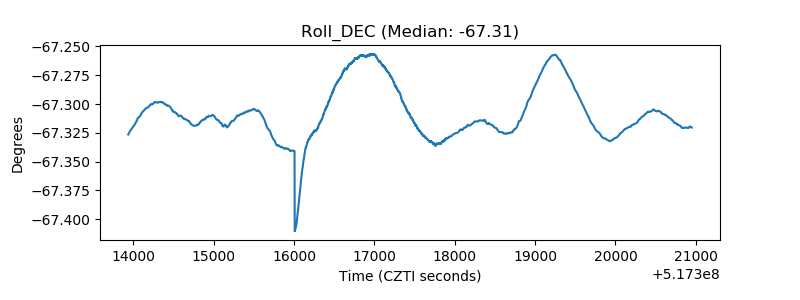 |
| _Roll_RA | 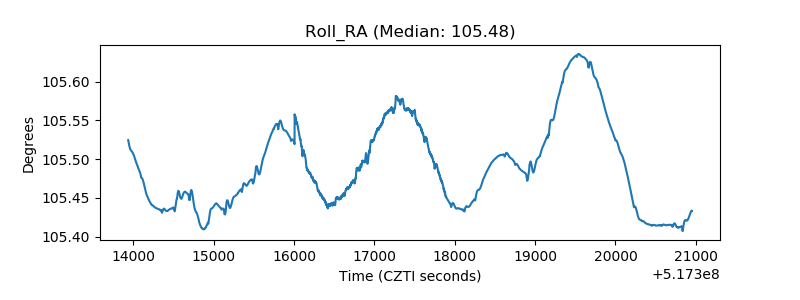 |
| Veto Counter | 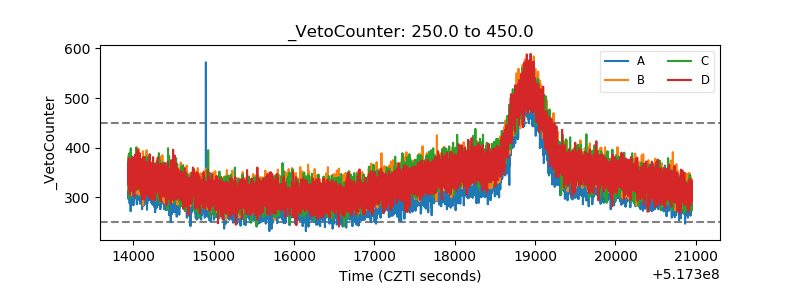 |