| Param | Original file | Final file |
|---|---|---|
| Filename | modeM0/AS1A14_125T09_9000006578_57645cztM0_level2.fits | modeM0/AS1A14_125T09_9000006578_57645cztM0_level2_quad_clean.evt |
| Size (bytes) | 479,966,400 | 103,777,920 |
| Size | 457.7 MB | 99.0 MB |
| Events in quadrant A | 3,397,128 | 683,150 |
| Events in quadrant B | 3,726,514 | 735,019 |
| Events in quadrant C | 5,041,451 | 637,854 |
| Events in quadrant D | 5,042,004 | 584,754 |
| Mode SS | |||
|---|---|---|---|
| Quadrant | BADHDUFLAG | Total packets | Discarded packets |
| A | 0 | 144 | 0 |
| B | 0 | 144 | 0 |
| C | 0 | 144 | 0 |
| D | 0 | 144 | 0 |
| Mode M0 | |||
|---|---|---|---|
| Quadrant | BADHDUFLAG | Total packets | Discarded packets |
| A | 0 | 15429 | 0 |
| B | 0 | 16124 | 0 |
| C | 0 | 20096 | 0 |
| D | 0 | 19906 | 0 |
| Quadrant | Total seconds | Saturated seconds | Saturation percentage |
|---|---|---|---|
| A | 7201 | 57 | 0.791557% |
| B | 7201 | 28 | 0.388835% |
| C | 7201 | 302 | 4.193862% |
| D | 7201 | 475 | 6.596306% |
Noise dominated data is calculated using 1-second bins in cleaned event files. If a bin has >2000 counts, and if more than 50% of those come from <1% of pixels, then it is considered to be noise-dominated and hence unusable.
| Quadrant | # 1 sec bins | Bins with >0 counts | Bins with >2000 counts | High rate bins dominated by noise | Noise dominated (total time) | Noise dominated (detector-on time) | Marked lightcurve |
|---|---|---|---|---|---|---|---|
| A | 7201 | 7201 | 40 | 40 | 0.56% | 0.56% | 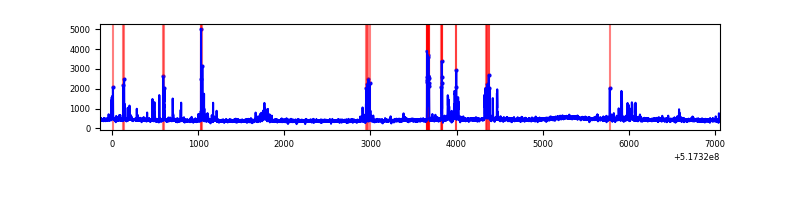 |
| B | 7201 | 7201 | 10 | 10 | 0.14% | 0.14% | 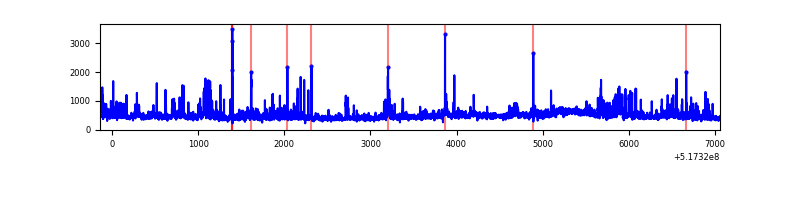 |
| C | 7201 | 7201 | 249 | 249 | 3.46% | 3.46% | 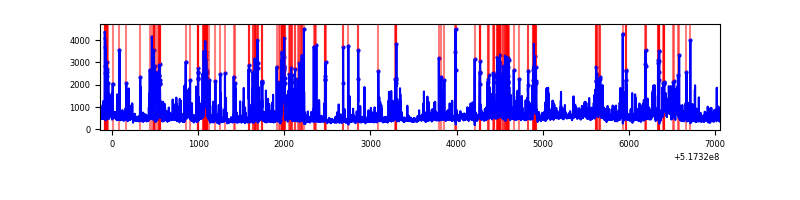 |
| D | 7201 | 7201 | 361 | 361 | 5.01% | 5.01% | 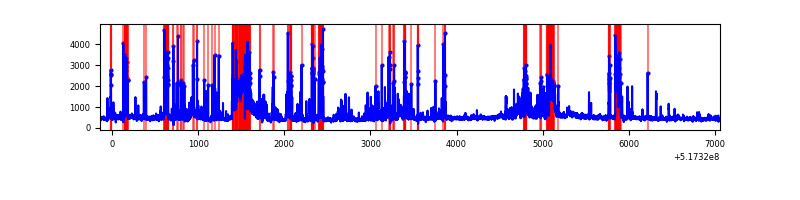 |
Top three noisy pixels from each quadrant. If the there are fewer than three noisy pixels in the level2.evt file, extra rows are filled as -1
| Pixel properties | Quadrant properties | ||||||
|---|---|---|---|---|---|---|---|
| Quadrant | DetID | PixID | Counts | Sigma | Mean | Median | Sigma |
| A | 7 | 223 | 334810 | 1746.71 | 771 | 752 | 191.2 |
| A | 13 | 248 | 31809 | 162.39 | 771 | 752 | 191.2 |
| A | 3 | 245 | 30735 | 156.77 | 771 | 752 | 191.2 |
| B | 0 | 216 | 429097 | 2636.14 | 763 | 734 | 162.5 |
| B | 10 | 247 | 80877 | 493.2 | 763 | 734 | 162.5 |
| B | 0 | 245 | 55229 | 335.36 | 763 | 734 | 162.5 |
| C | 15 | 224 | 1346384 | 6657.29 | 739 | 732 | 202.1 |
| C | 6 | 13 | 404190 | 1996.01 | 739 | 732 | 202.1 |
| C | 12 | 2 | 168527 | 830.13 | 739 | 732 | 202.1 |
| D | 8 | 240 | 1011692 | 4921.3 | 725 | 689 | 205.4 |
| D | 3 | 12 | 419107 | 2036.75 | 725 | 689 | 205.4 |
| D | 15 | 142 | 303289 | 1472.98 | 725 | 689 | 205.4 |
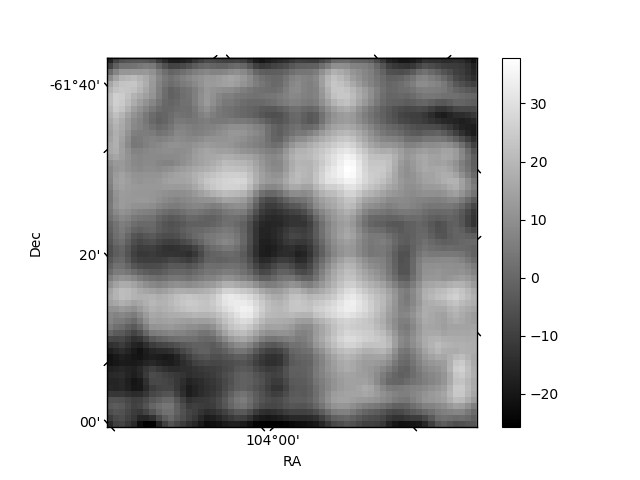
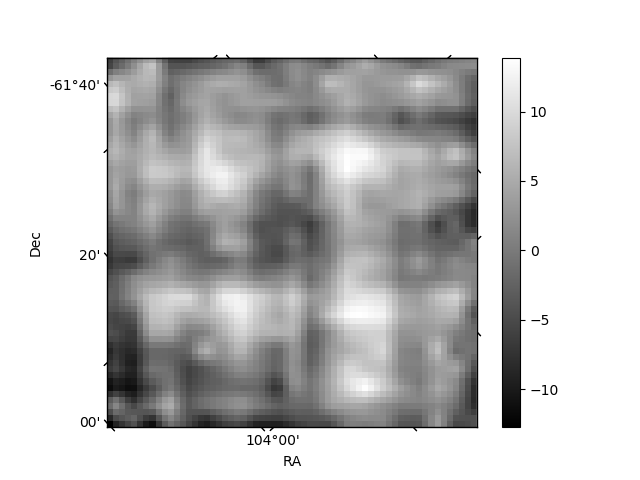
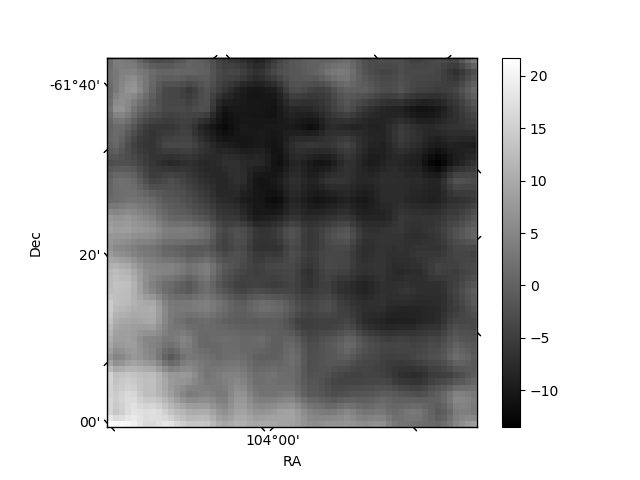
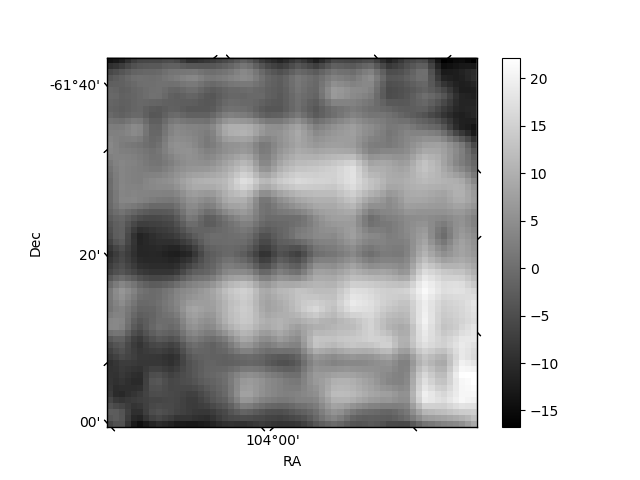
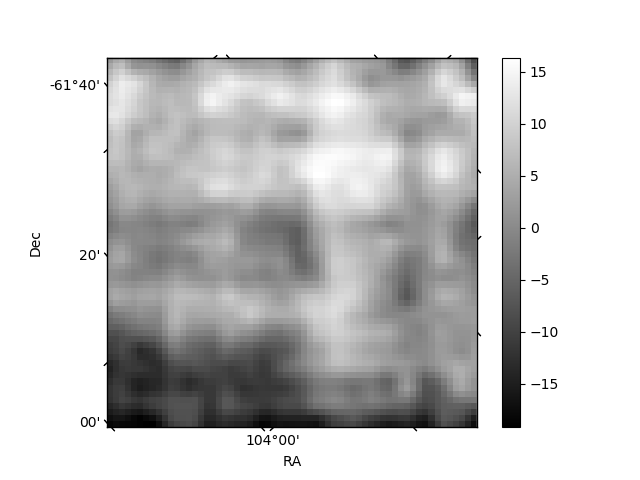
Histogram calculated using DETX and DETY for each event in the final _common_clean file
| Quadrant A | 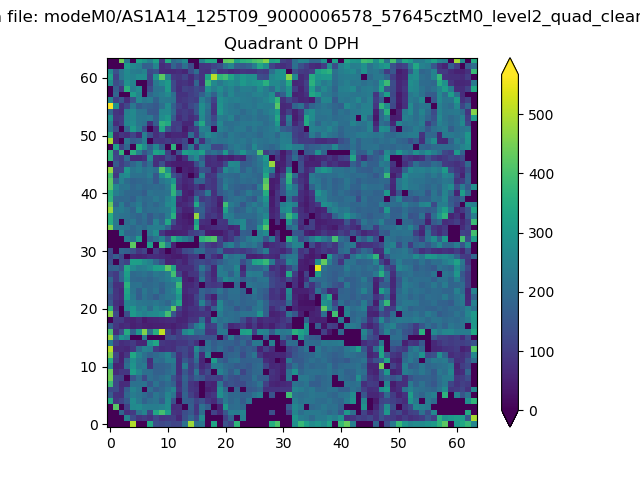 |
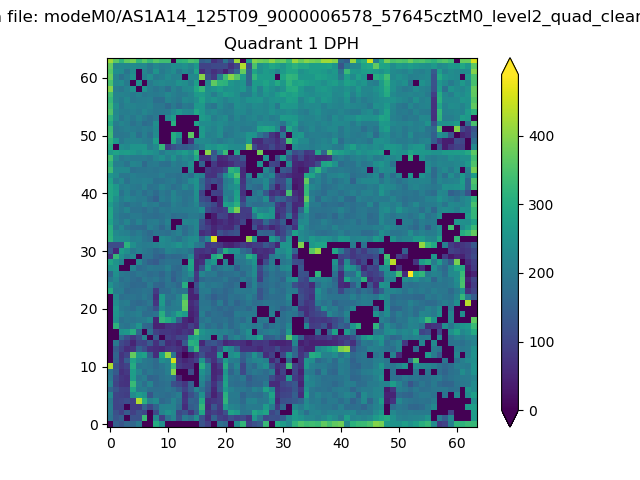 |
Quadrant B |
|---|---|---|---|
| Quadrant D | 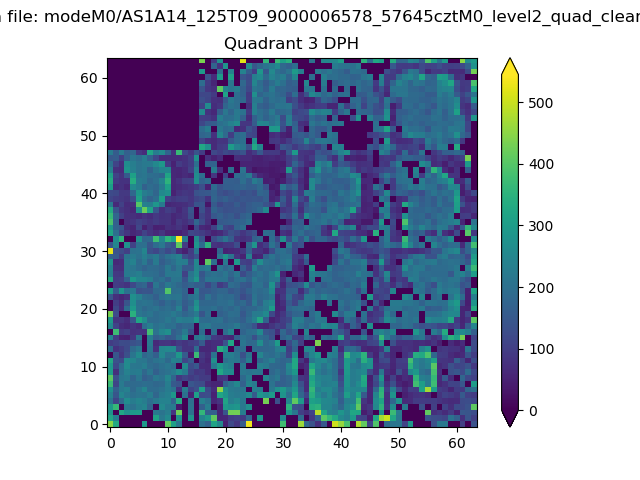 |
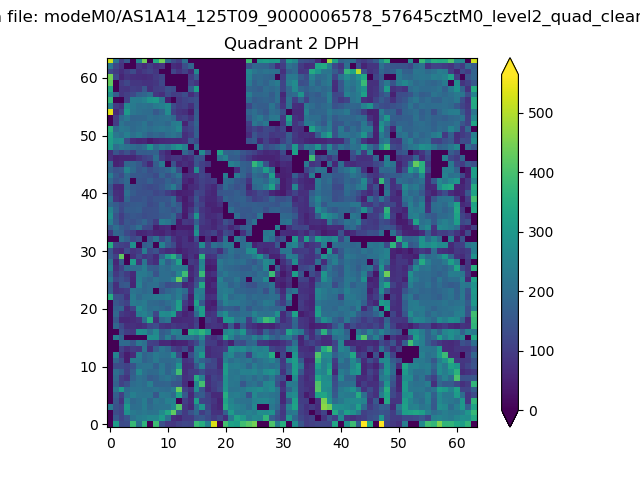 |
Quadrant C |
| Plot type | Count rate plots | Images |
|---|---|---|
| Comparison with Poisson distribution Blue bars denote a histogram of data divided into 1 sec bins. Red curve is a Poisson curve with rate = median count rate of data. |
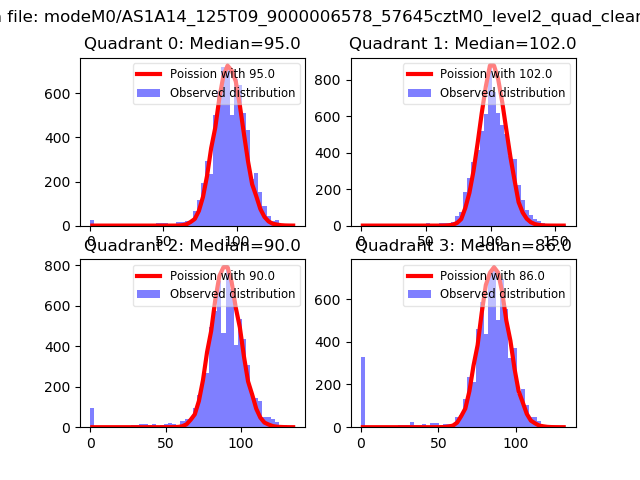 |
 |
| Quadrant-wise count rates Data is divided into 100 sec bins |
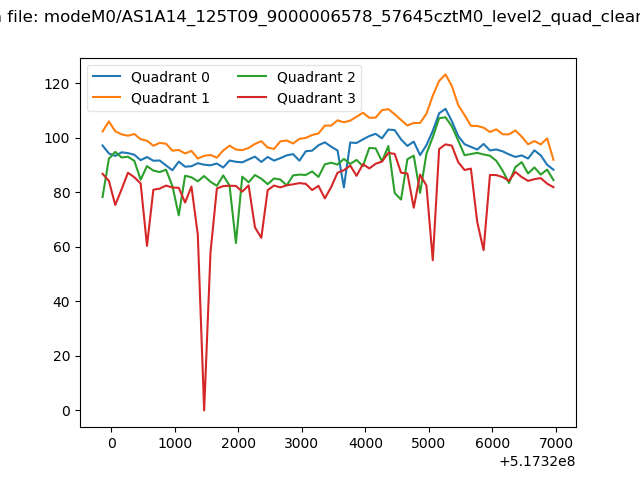 |
|
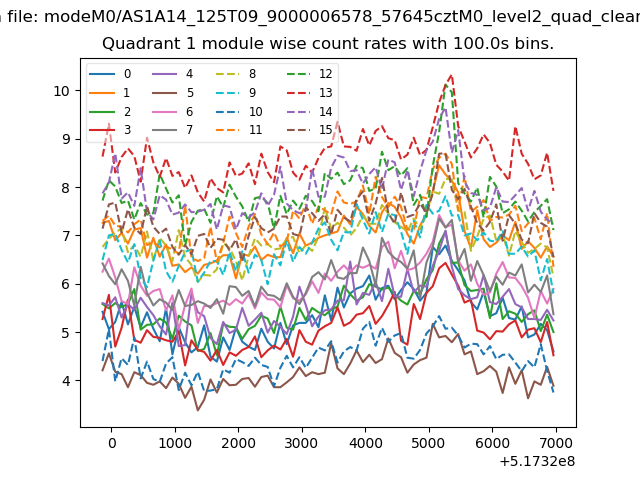
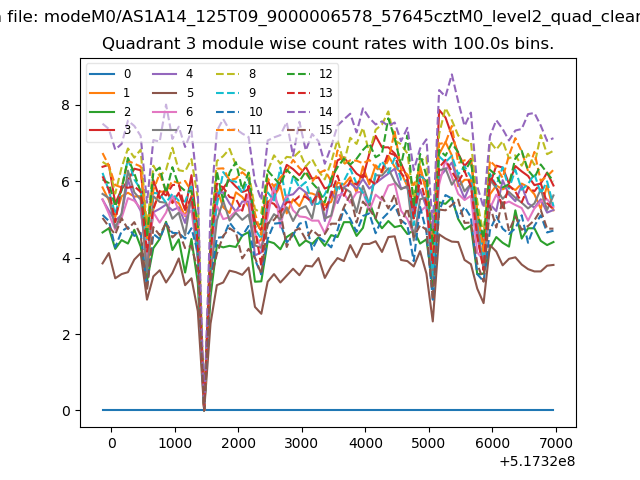
| Module-wise count rates for Quadrant A Data is divided into 100 sec bins |
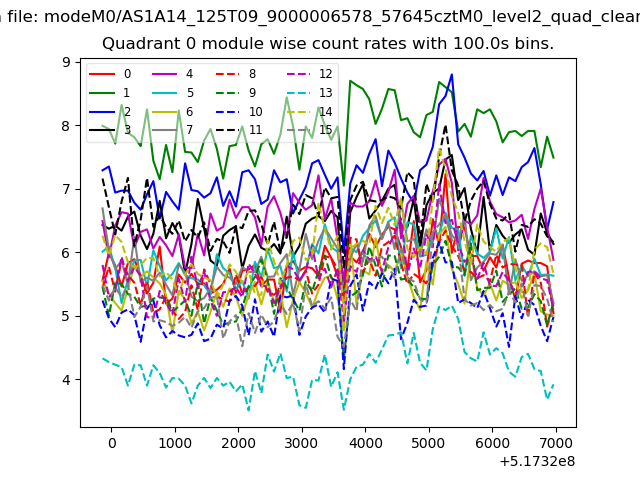 |
 |
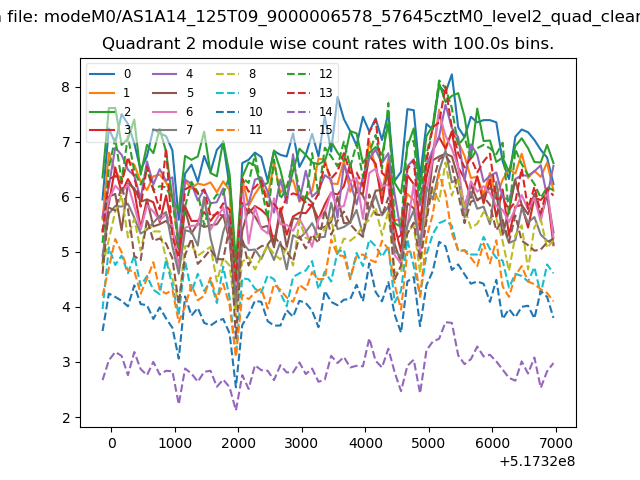
| Module-wise count rates for Quadrant B Data is divided into 100 sec bins |
 |
 |
| Module-wise count rates for Quadrant C Data is divided into 100 sec bins |
 |
 |
| Module-wise count rates for Quadrant D Data is divided into 100 sec bins |
 |
 |
| Parameter | Plot |
|---|---|
| CZT HV Monitor | 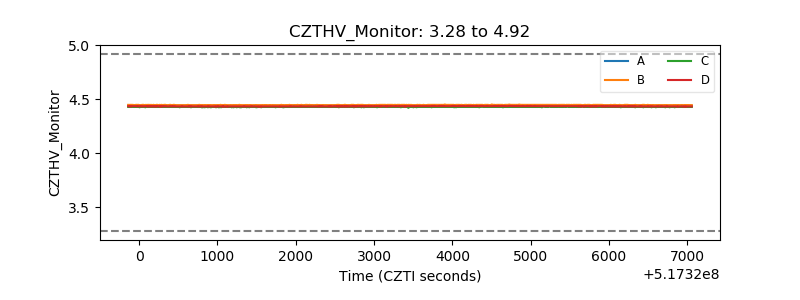 |
| D_VDD | 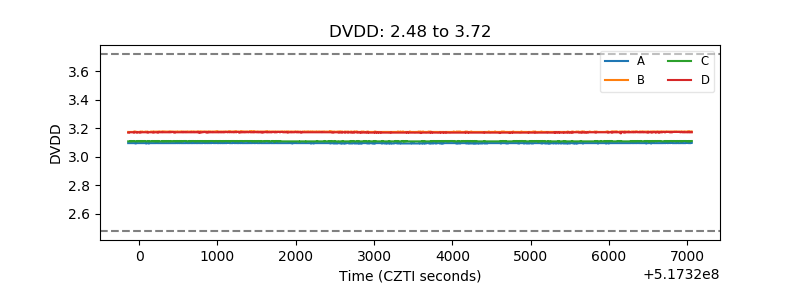 |
| Temperature 1 | 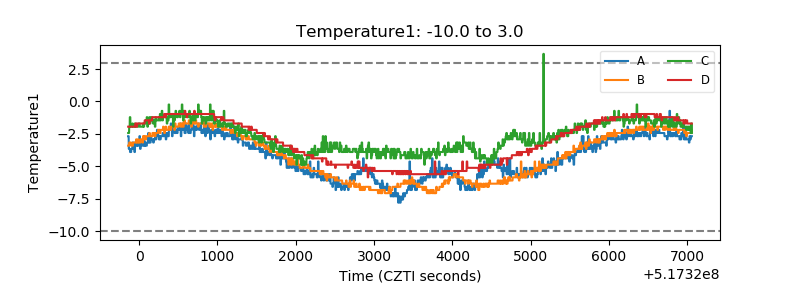 |
| Veto HV Monitor | 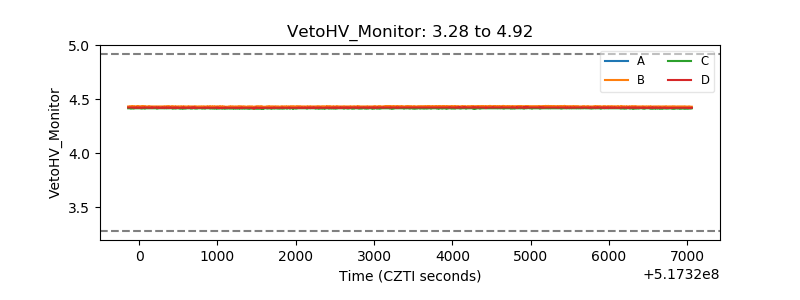 |
| Veto LLD | 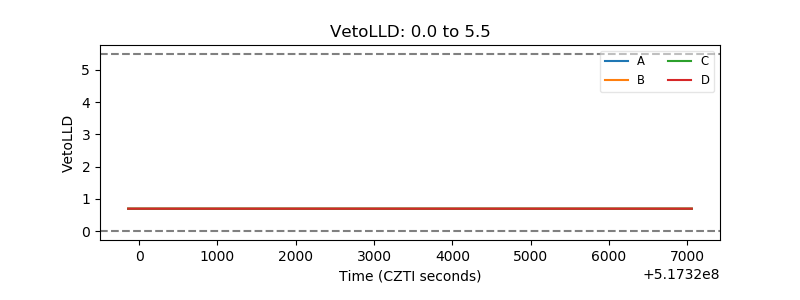 |
| Alpha Counter | 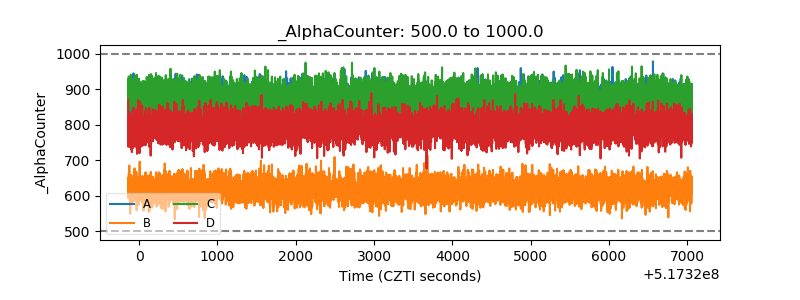 |
| _CPM_Rate | 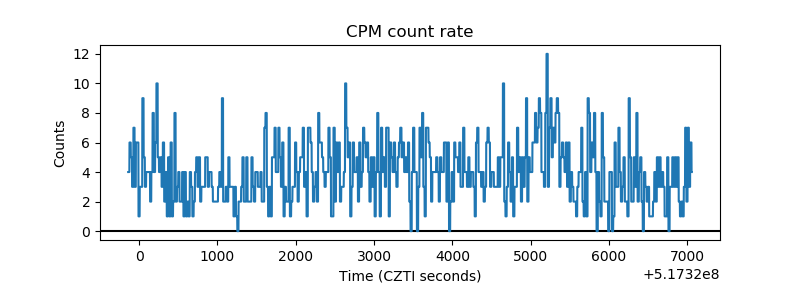 |
| CZT Counter | 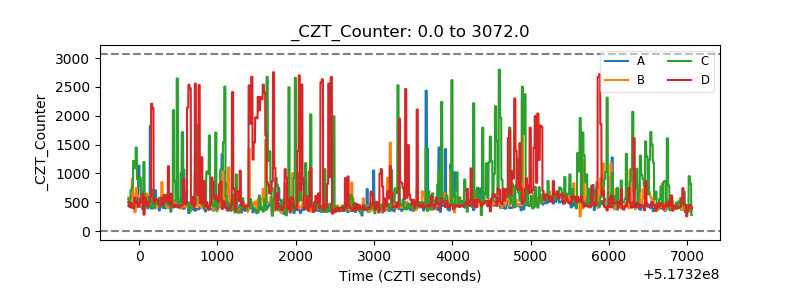 |
| +2.5 Volts monitor |  |
| +5 Volts monitor |  |
| _ROLL_ROT | 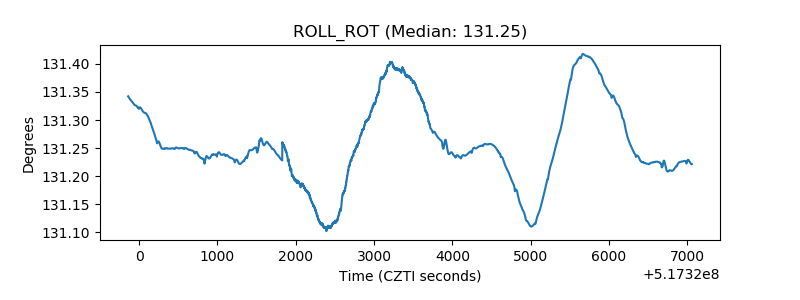 |
| _Roll_DEC | 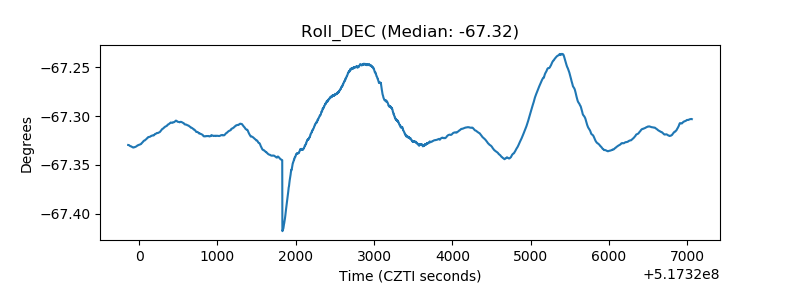 |
| _Roll_RA | 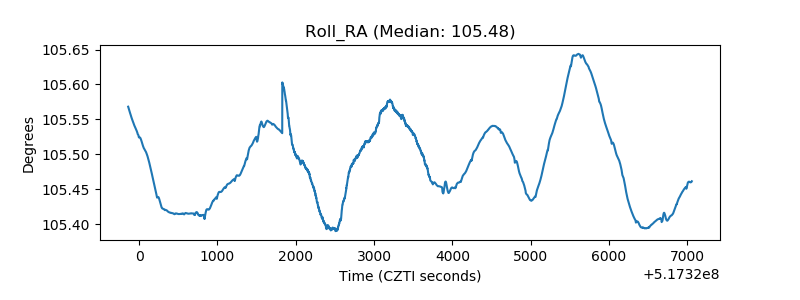 |
| Veto Counter | 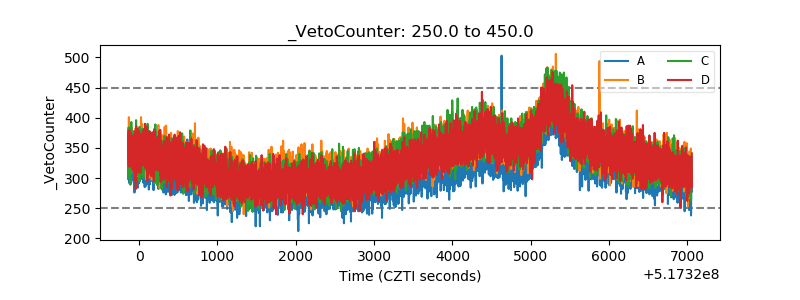 |