| Param | Original file | Final file |
|---|---|---|
| Filename | modeM0/AS1A14_125T09_9000006578_57646cztM0_level2.fits | modeM0/AS1A14_125T09_9000006578_57646cztM0_level2_quad_clean.evt |
| Size (bytes) | 510,773,760 | 105,229,440 |
| Size | 487.1 MB | 100.4 MB |
| Events in quadrant A | 3,311,525 | 703,624 |
| Events in quadrant B | 3,871,154 | 749,664 |
| Events in quadrant C | 6,977,738 | 609,588 |
| Events in quadrant D | 4,176,441 | 612,397 |
| Mode SS | |||
|---|---|---|---|
| Quadrant | BADHDUFLAG | Total packets | Discarded packets |
| A | 0 | 146 | 0 |
| B | 0 | 146 | 0 |
| C | 0 | 146 | 0 |
| D | 0 | 146 | 0 |
| Mode M0 | |||
|---|---|---|---|
| Quadrant | BADHDUFLAG | Total packets | Discarded packets |
| A | 0 | 15281 | 0 |
| B | 0 | 16645 | 0 |
| C | 0 | 25914 | 0 |
| D | 0 | 17604 | 0 |
| Quadrant | Total seconds | Saturated seconds | Saturation percentage |
|---|---|---|---|
| A | 7342 | 14 | 0.190684% |
| B | 7343 | 46 | 0.626447% |
| C | 7343 | 725 | 9.873349% |
| D | 7343 | 263 | 3.581642% |
Noise dominated data is calculated using 1-second bins in cleaned event files. If a bin has >2000 counts, and if more than 50% of those come from <1% of pixels, then it is considered to be noise-dominated and hence unusable.
| Quadrant | # 1 sec bins | Bins with >0 counts | Bins with >2000 counts | High rate bins dominated by noise | Noise dominated (total time) | Noise dominated (detector-on time) | Marked lightcurve |
|---|---|---|---|---|---|---|---|
| A | 7342 | 7342 | 6 | 6 | 0.08% | 0.08% | 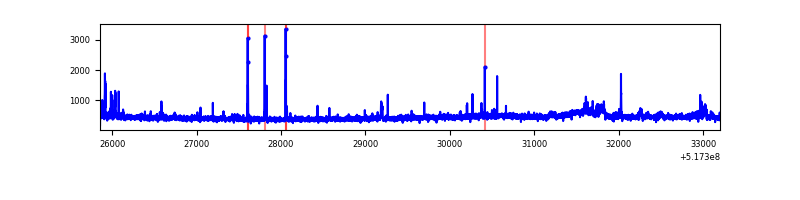 |
| B | 7343 | 7343 | 14 | 14 | 0.19% | 0.19% | 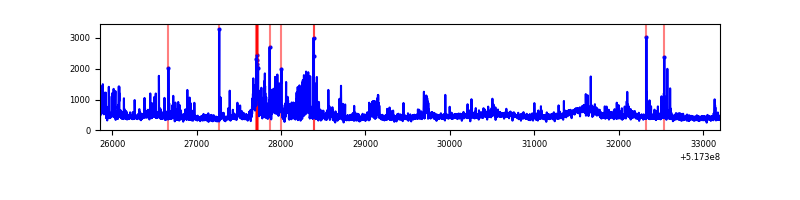 |
| C | 7343 | 7343 | 559 | 559 | 7.61% | 7.61% | 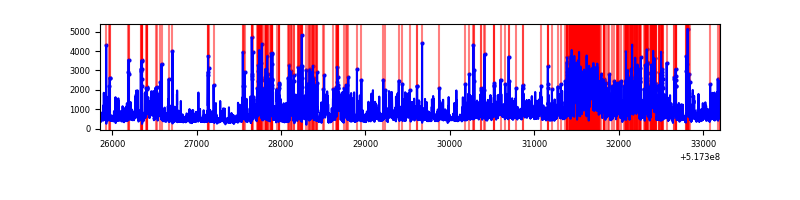 |
| D | 7343 | 7343 | 209 | 209 | 2.85% | 2.85% | 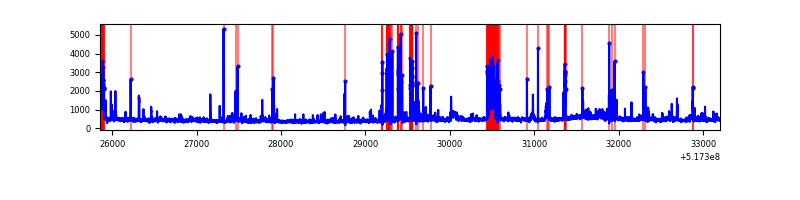 |
Top three noisy pixels from each quadrant. If the there are fewer than three noisy pixels in the level2.evt file, extra rows are filled as -1
| Pixel properties | Quadrant properties | ||||||
|---|---|---|---|---|---|---|---|
| Quadrant | DetID | PixID | Counts | Sigma | Mean | Median | Sigma |
| A | 3 | 14 | 105490 | 528.49 | 796 | 774 | 198.1 |
| A | 7 | 223 | 43567 | 215.97 | 796 | 774 | 198.1 |
| A | 13 | 248 | 29274 | 143.84 | 796 | 774 | 198.1 |
| B | 0 | 216 | 502171 | 2995.08 | 783 | 754 | 167.4 |
| B | 10 | 246 | 75198 | 444.67 | 783 | 754 | 167.4 |
| B | 0 | 245 | 42559 | 249.71 | 783 | 754 | 167.4 |
| C | 15 | 224 | 2112207 | 10673.54 | 730 | 724 | 197.8 |
| C | 6 | 13 | 1487403 | 7515.16 | 730 | 724 | 197.8 |
| C | 12 | 254 | 227652 | 1147.12 | 730 | 724 | 197.8 |
| D | 8 | 240 | 800413 | 3740.73 | 756 | 721 | 213.8 |
| D | 3 | 12 | 65462 | 302.84 | 756 | 721 | 213.8 |
| D | 5 | 173 | 64312 | 297.46 | 756 | 721 | 213.8 |
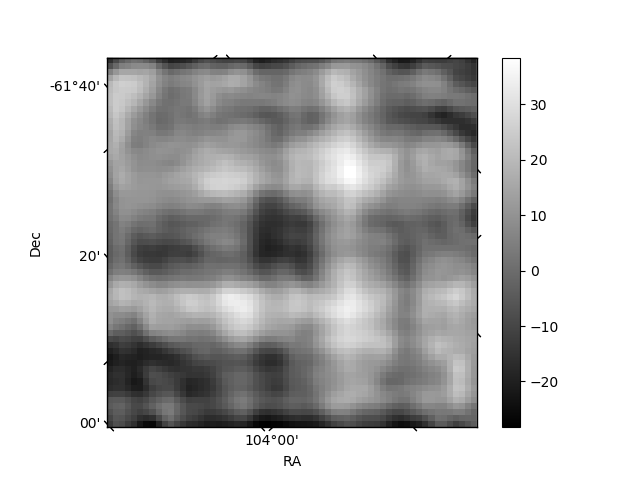
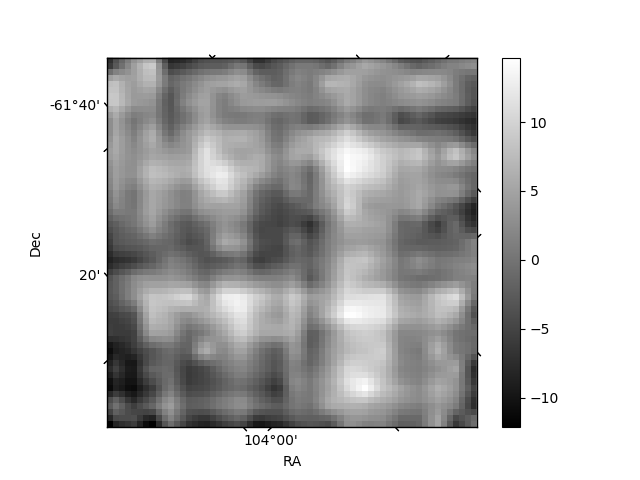
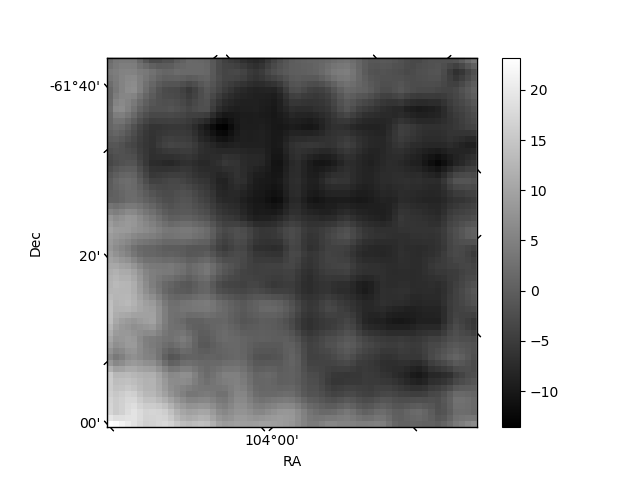
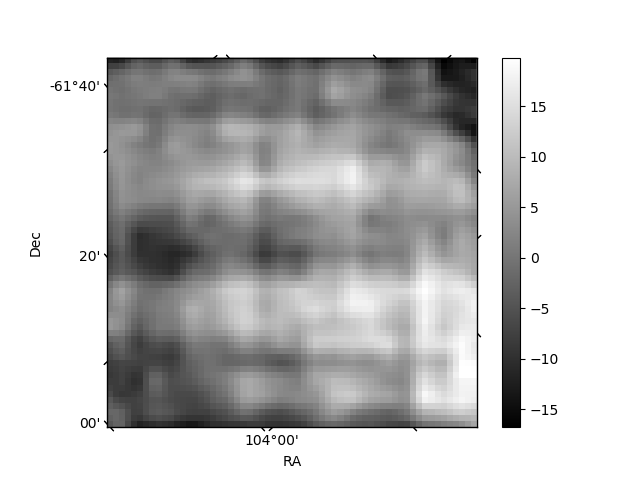
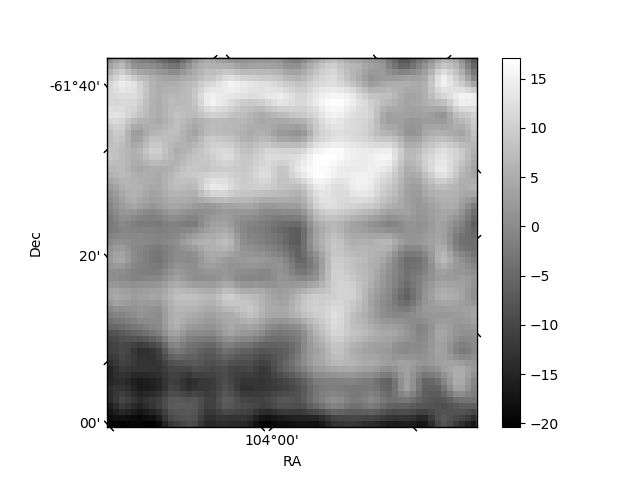
Histogram calculated using DETX and DETY for each event in the final _common_clean file
| Quadrant A | 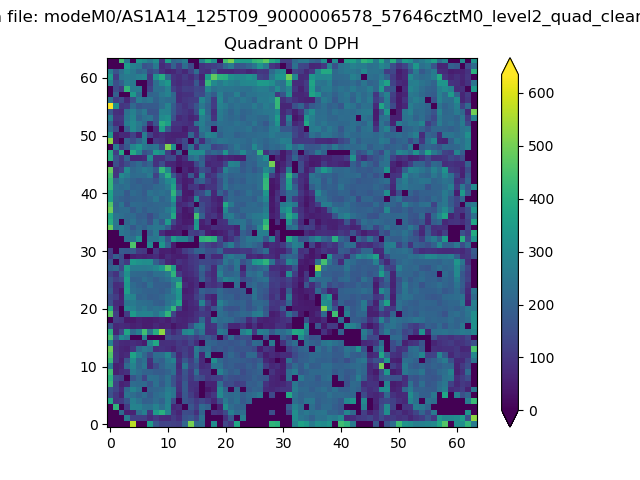 |
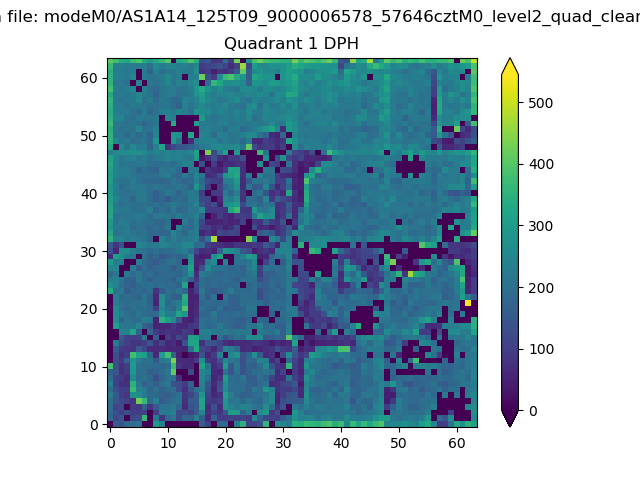 |
Quadrant B |
|---|---|---|---|
| Quadrant D | 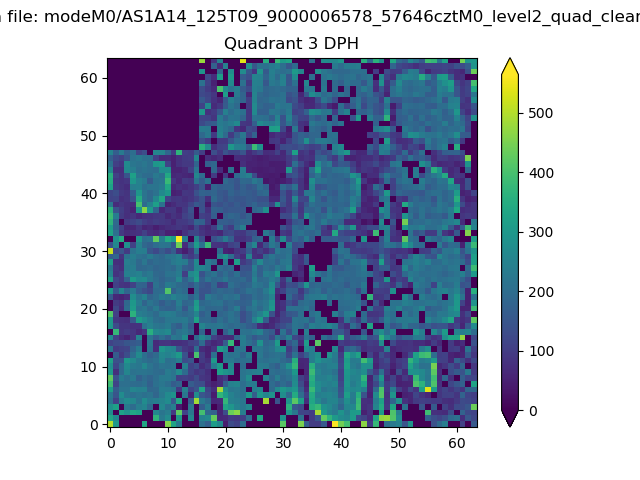 |
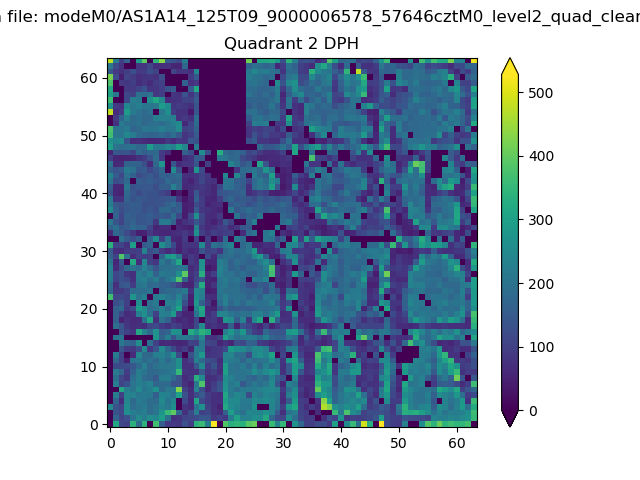 |
Quadrant C |
| Plot type | Count rate plots | Images |
|---|---|---|
| Comparison with Poisson distribution Blue bars denote a histogram of data divided into 1 sec bins. Red curve is a Poisson curve with rate = median count rate of data. |
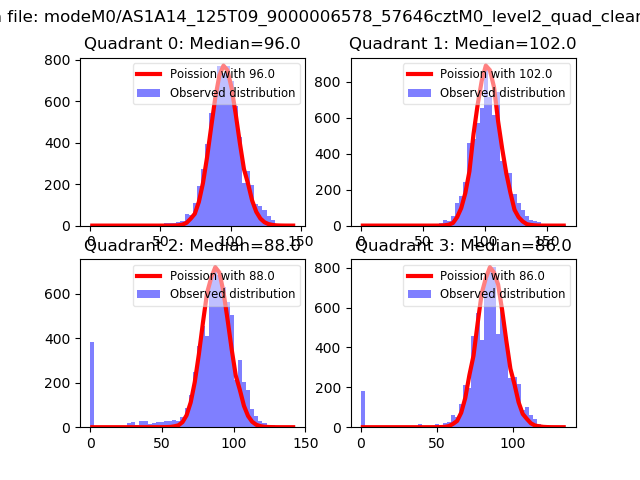 |
 |
| Quadrant-wise count rates Data is divided into 100 sec bins |
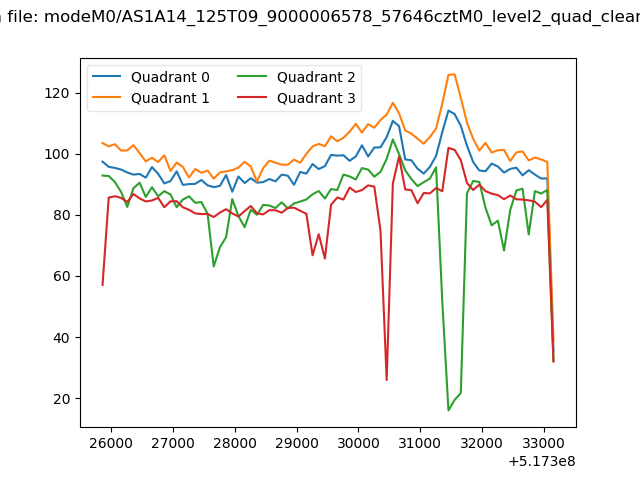 |
|
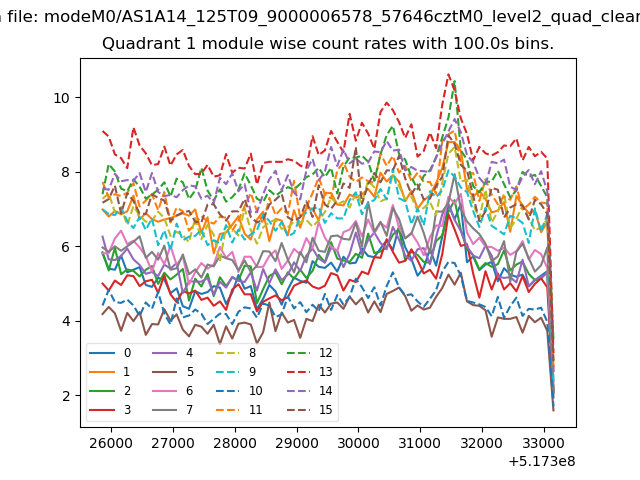
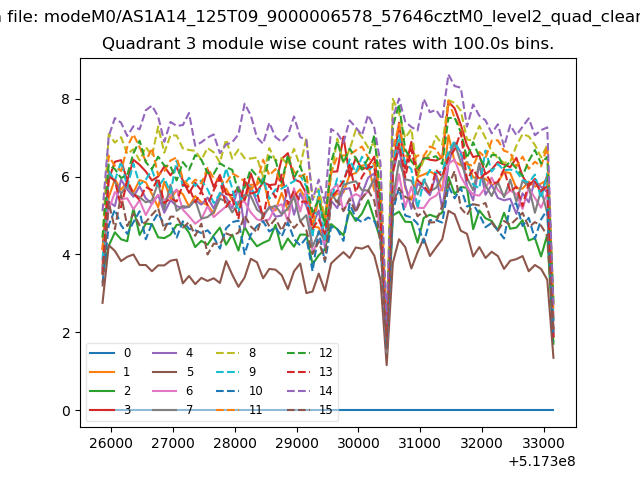
| Module-wise count rates for Quadrant A Data is divided into 100 sec bins |
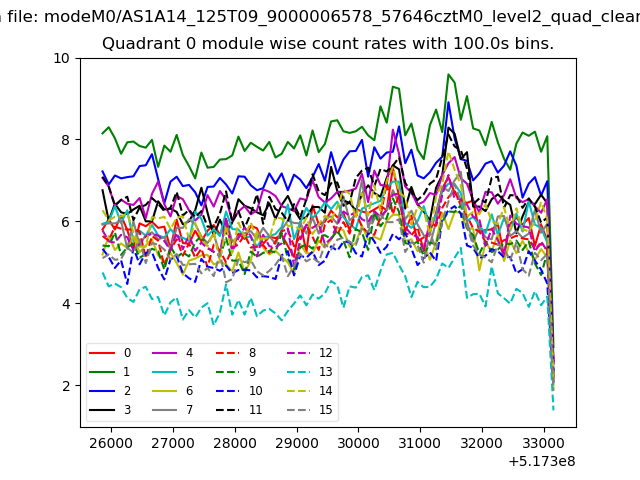 |
 |
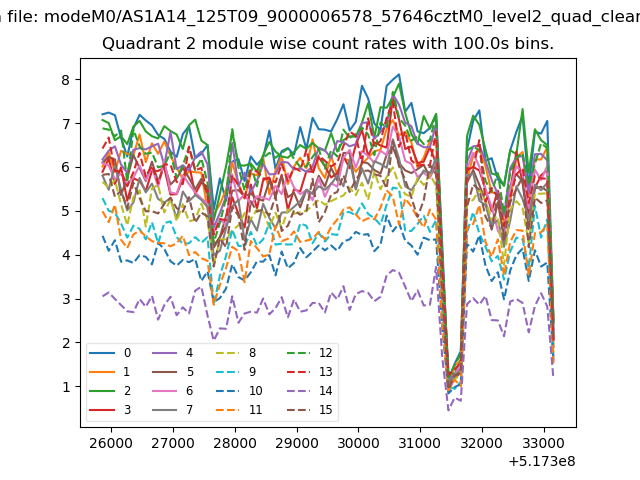
| Module-wise count rates for Quadrant B Data is divided into 100 sec bins |
 |
 |
| Module-wise count rates for Quadrant C Data is divided into 100 sec bins |
 |
 |
| Module-wise count rates for Quadrant D Data is divided into 100 sec bins |
 |
 |
| Parameter | Plot |
|---|---|
| CZT HV Monitor | 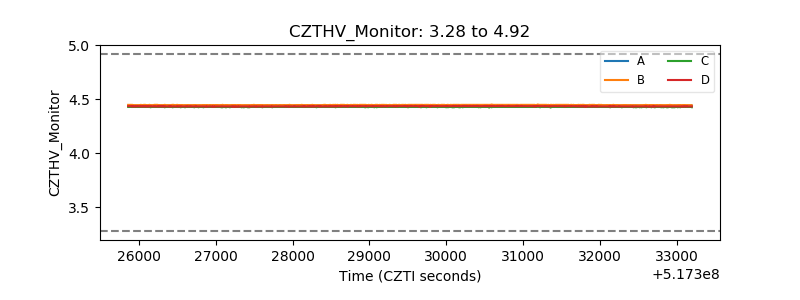 |
| D_VDD | 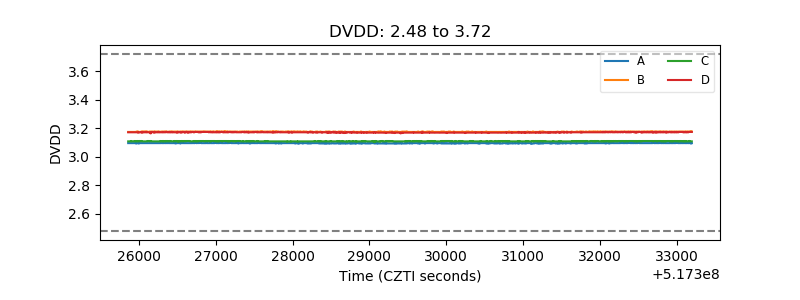 |
| Temperature 1 | 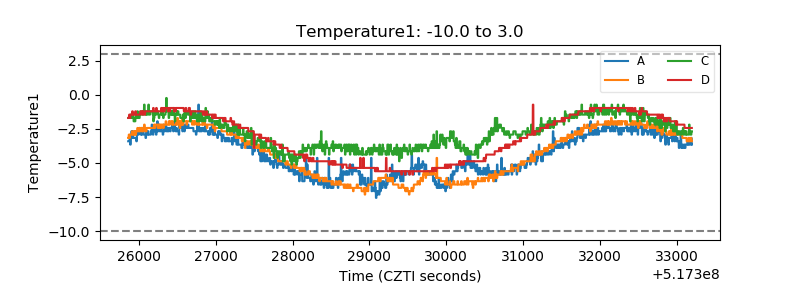 |
| Veto HV Monitor | 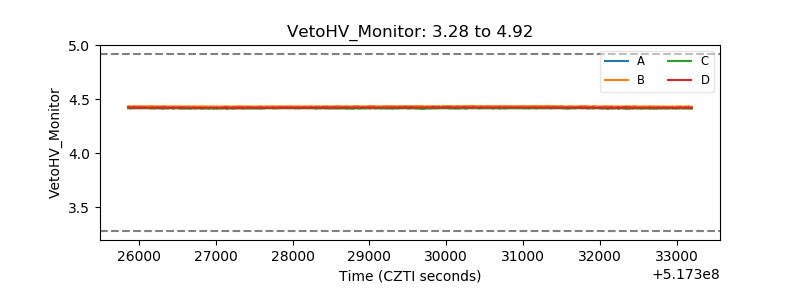 |
| Veto LLD | 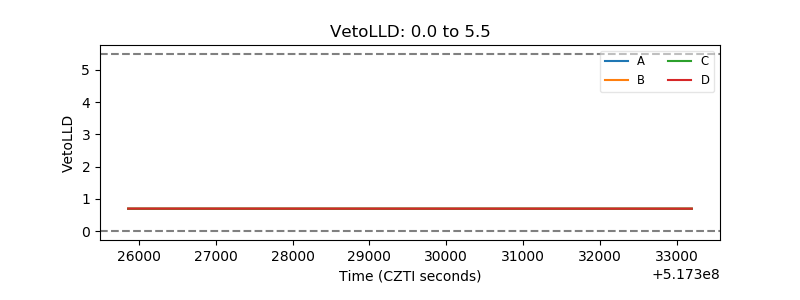 |
| Alpha Counter | 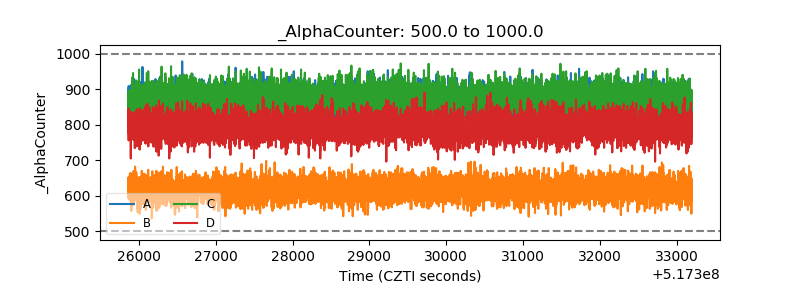 |
| _CPM_Rate | 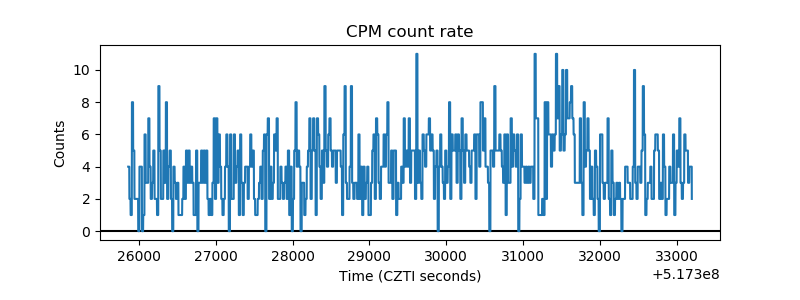 |
| CZT Counter | 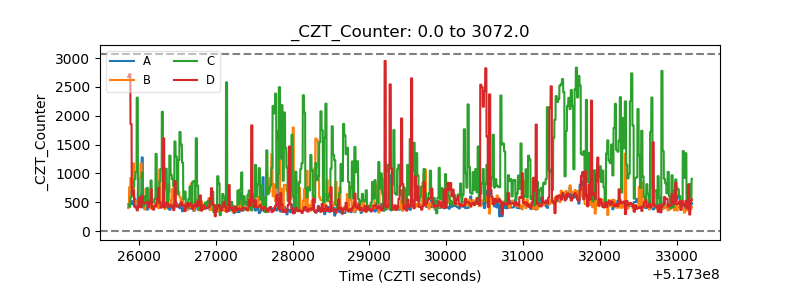 |
| +2.5 Volts monitor |  |
| +5 Volts monitor |  |
| _ROLL_ROT | 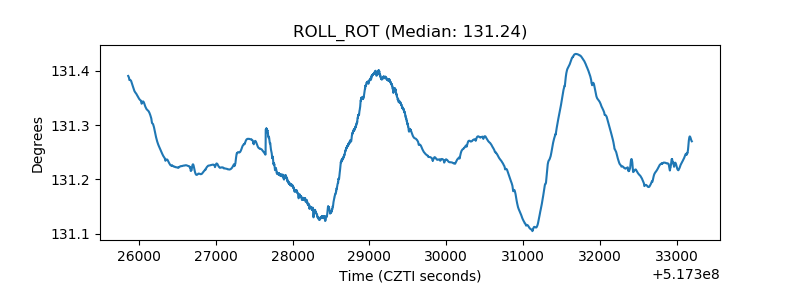 |
| _Roll_DEC | 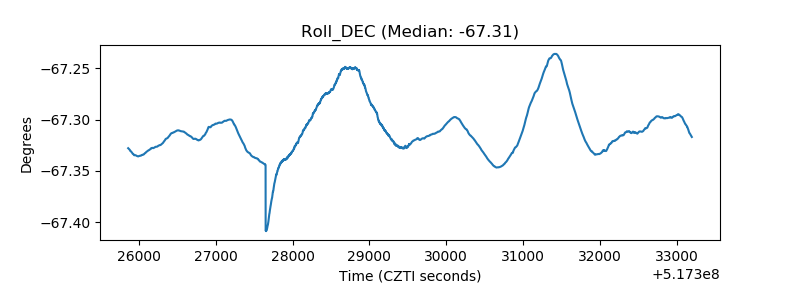 |
| _Roll_RA | 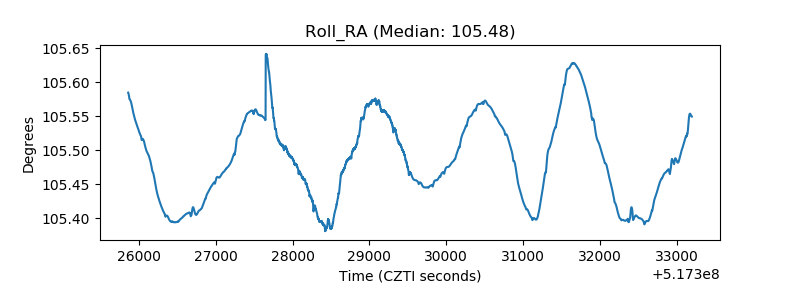 |
| Veto Counter | 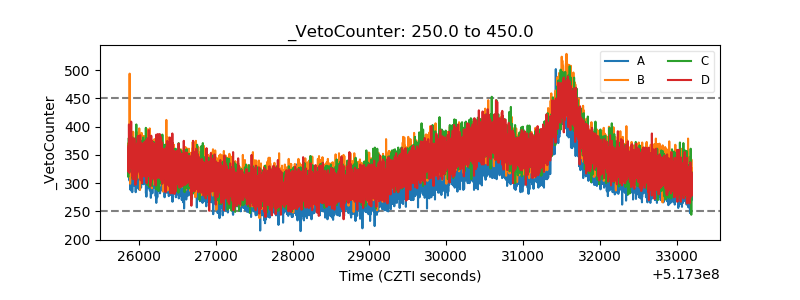 |