| Param | Original file | Final file |
|---|---|---|
| Filename | modeM0/AS1A14_125T09_9000006578_57649cztM0_level2.fits | modeM0/AS1A14_125T09_9000006578_57649cztM0_level2_quad_clean.evt |
| Size (bytes) | 1,323,080,640 | 263,992,320 |
| Size | 1.2 GB | 251.8 MB |
| Events in quadrant A | 8,215,064 | 1,780,739 |
| Events in quadrant B | 9,503,977 | 1,880,220 |
| Events in quadrant C | 18,189,968 | 1,492,409 |
| Events in quadrant D | 11,616,963 | 1,547,323 |
| Mode M9 | |||
|---|---|---|---|
| Quadrant | BADHDUFLAG | Total packets | Discarded packets |
| A | 0 | 15 | 0 |
| B | 0 | 15 | 0 |
| C | 0 | 15 | 0 |
| D | 0 | 15 | 0 |
| Mode SS | |||
|---|---|---|---|
| Quadrant | BADHDUFLAG | Total packets | Discarded packets |
| A | 0 | 382 | 0 |
| B | 0 | 382 | 0 |
| C | 0 | 382 | 0 |
| D | 0 | 382 | 0 |
| Mode M0 | |||
|---|---|---|---|
| Quadrant | BADHDUFLAG | Total packets | Discarded packets |
| A | 0 | 38504 | 3 |
| B | 0 | 41708 | 3 |
| C | 0 | 67271 | 3 |
| D | 0 | 47051 | 3 |
| Quadrant | Total seconds | Saturated seconds | Saturation percentage |
|---|---|---|---|
| A | 18745 | 44 | 0.234729% |
| B | 18746 | 268 | 1.429638% |
| C | 18746 | 2374 | 12.664035% |
| D | 18746 | 435 | 2.320495% |
Noise dominated data is calculated using 1-second bins in cleaned event files. If a bin has >2000 counts, and if more than 50% of those come from <1% of pixels, then it is considered to be noise-dominated and hence unusable.
| Quadrant | # 1 sec bins | Bins with >0 counts | Bins with >2000 counts | High rate bins dominated by noise | Noise dominated (total time) | Noise dominated (detector-on time) | Marked lightcurve |
|---|---|---|---|---|---|---|---|
| A | 20295 | 18748 | 5 | 5 | 0.02% | 0.03% | 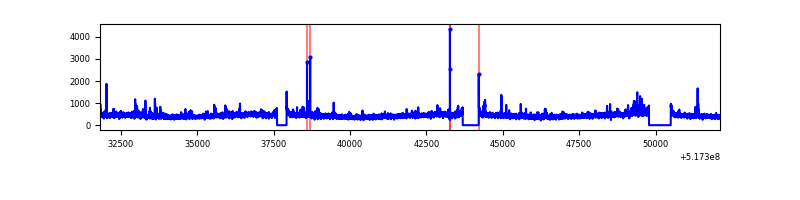 |
| B | 20296 | 18749 | 104 | 104 | 0.51% | 0.55% | 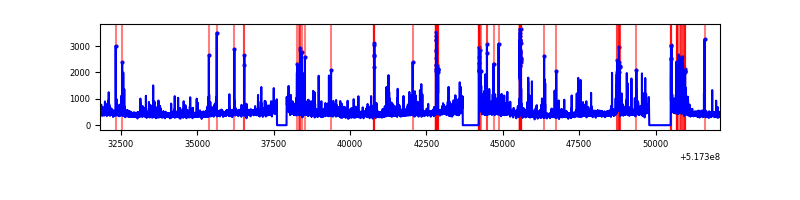 |
| C | 20296 | 18749 | 1899 | 1899 | 9.36% | 10.13% | 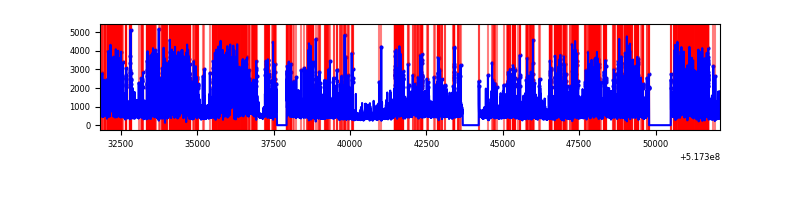 |
| D | 20296 | 18749 | 519 | 519 | 2.56% | 2.77% | 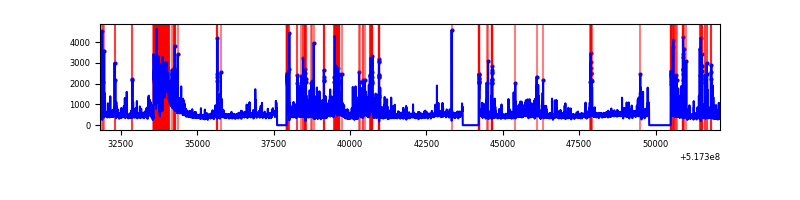 |
Top three noisy pixels from each quadrant. If the there are fewer than three noisy pixels in the level2.evt file, extra rows are filled as -1
| Pixel properties | Quadrant properties | ||||||
|---|---|---|---|---|---|---|---|
| Quadrant | DetID | PixID | Counts | Sigma | Mean | Median | Sigma |
| A | 7 | 64 | 168231 | 335.16 | 2017 | 1964 | 496.1 |
| A | 3 | 14 | 108206 | 214.16 | 2017 | 1964 | 496.1 |
| A | 13 | 248 | 52697 | 102.27 | 2017 | 1964 | 496.1 |
| B | 0 | 216 | 452001 | 1072.97 | 1983 | 1904 | 419.5 |
| B | 10 | 247 | 249407 | 590.01 | 1983 | 1904 | 419.5 |
| B | 0 | 213 | 191811 | 452.71 | 1983 | 1904 | 419.5 |
| C | 15 | 224 | 8985408 | 17945.2 | 1841 | 1820 | 500.6 |
| C | 6 | 13 | 1228658 | 2450.67 | 1841 | 1820 | 500.6 |
| C | 14 | 254 | 268994 | 533.69 | 1841 | 1820 | 500.6 |
| D | 6 | 29 | 1480771 | 2725.68 | 1925 | 1835 | 542.6 |
| D | 2 | 172 | 549853 | 1010.0 | 1925 | 1835 | 542.6 |
| D | 3 | 12 | 399531 | 732.95 | 1925 | 1835 | 542.6 |
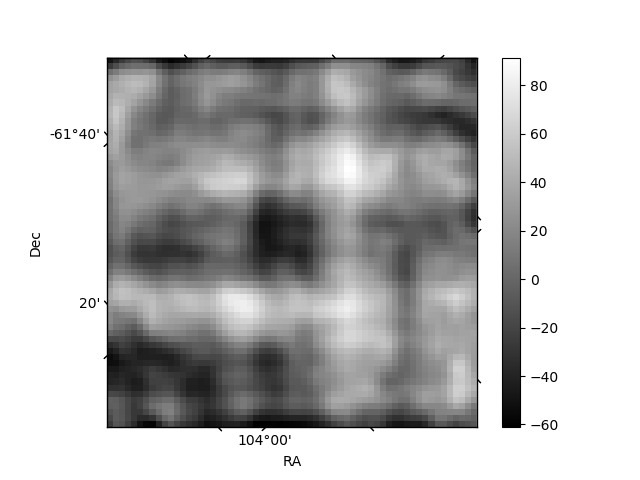
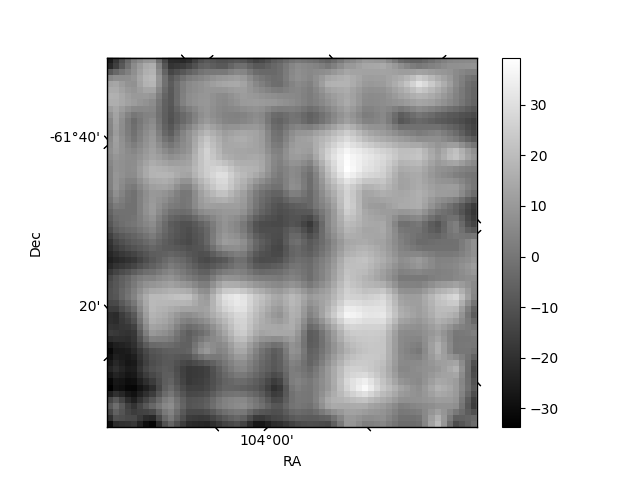
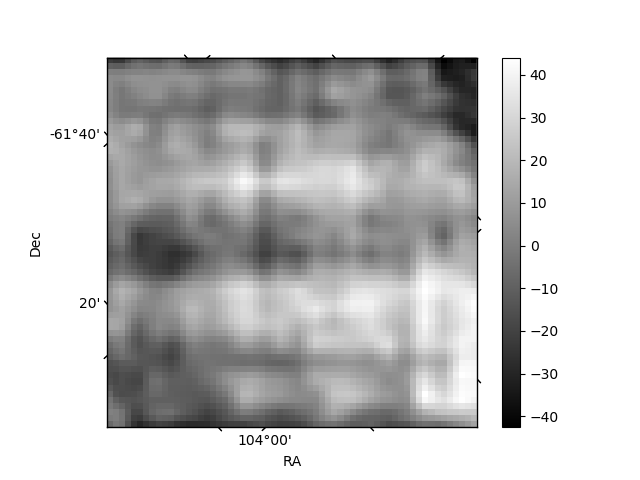
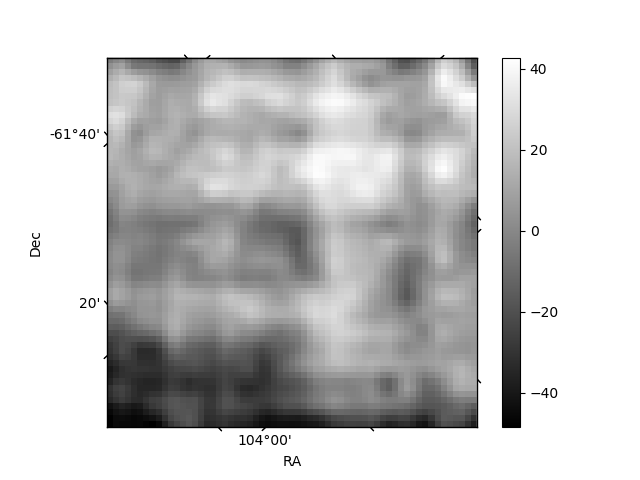
Histogram calculated using DETX and DETY for each event in the final _common_clean file
| Quadrant A | 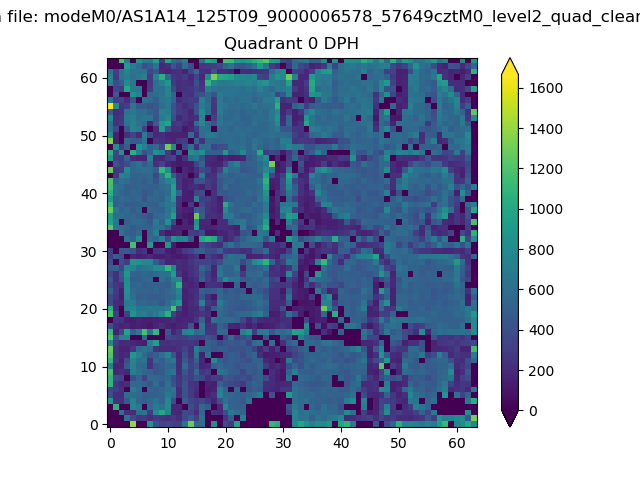 |
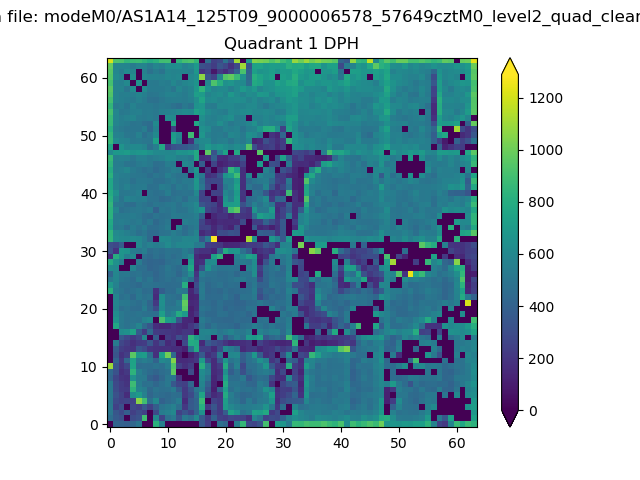 |
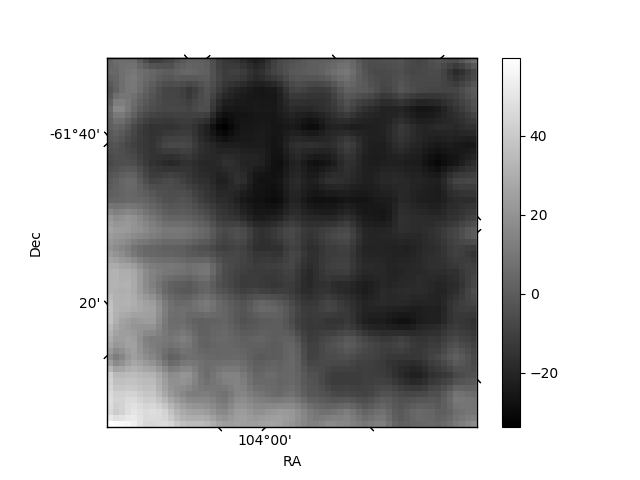
Quadrant B |
|---|---|---|---|
| Quadrant D | 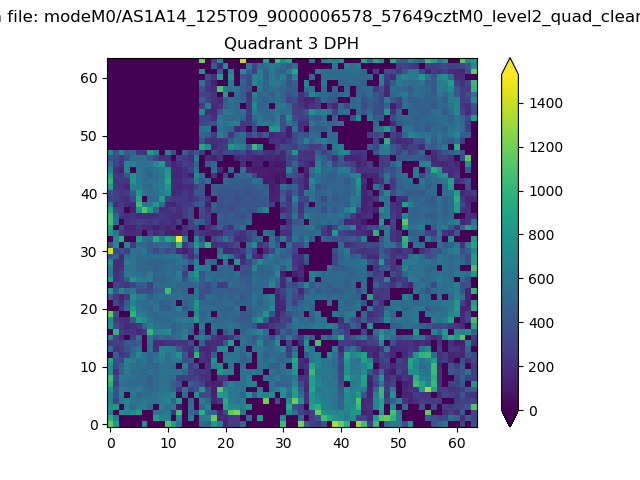 |
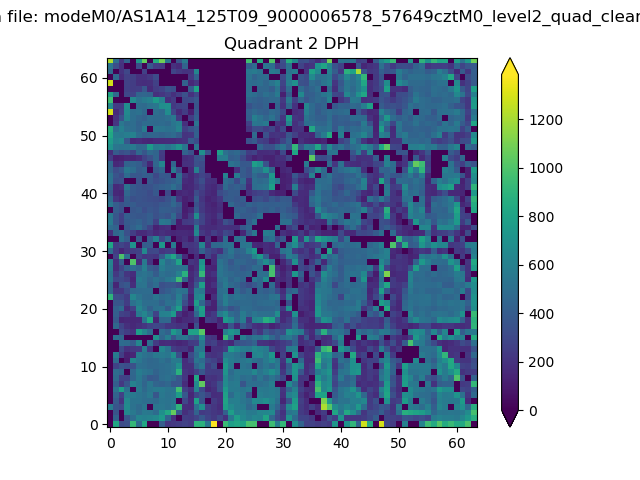 |
Quadrant C |
| Plot type | Count rate plots | Images |
|---|---|---|
| Comparison with Poisson distribution Blue bars denote a histogram of data divided into 1 sec bins. Red curve is a Poisson curve with rate = median count rate of data. |
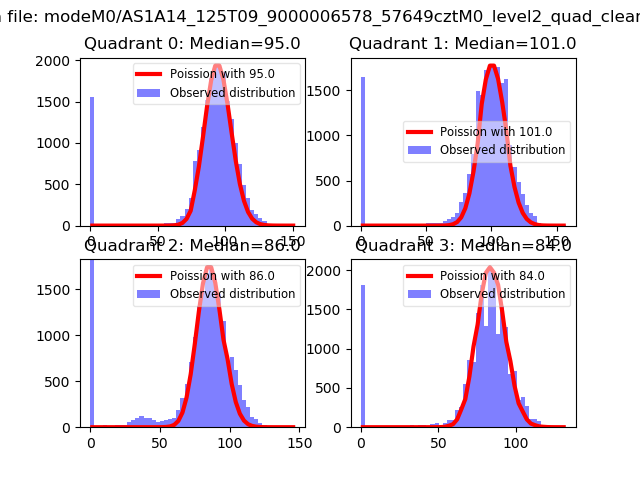 |
 |
| Quadrant-wise count rates Data is divided into 100 sec bins |
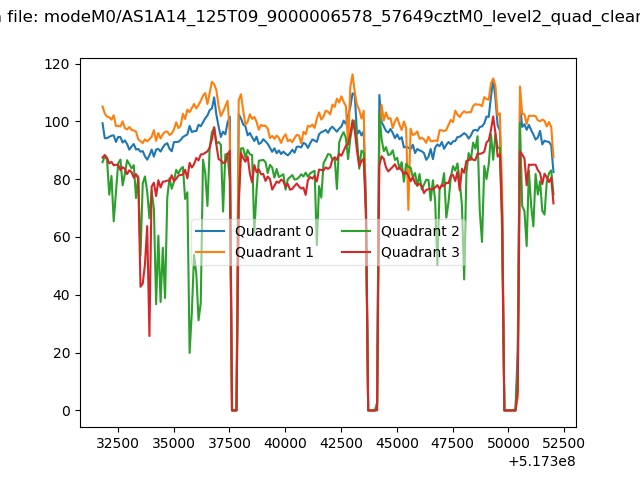 |
|
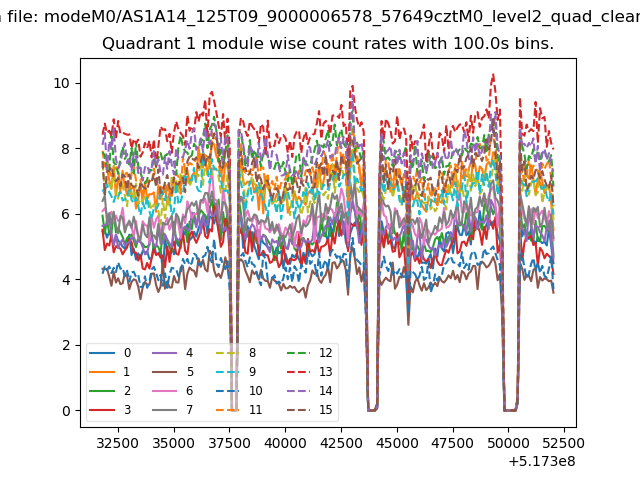
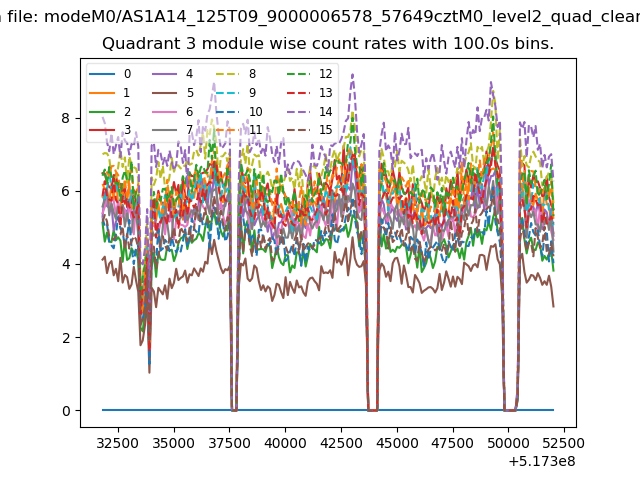
| Module-wise count rates for Quadrant A Data is divided into 100 sec bins |
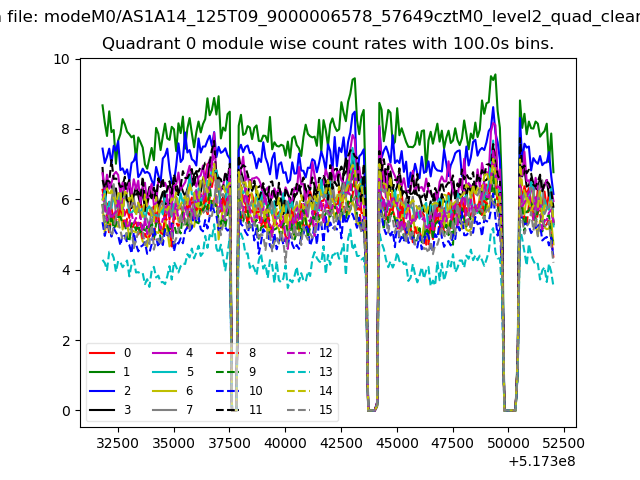 |
 |
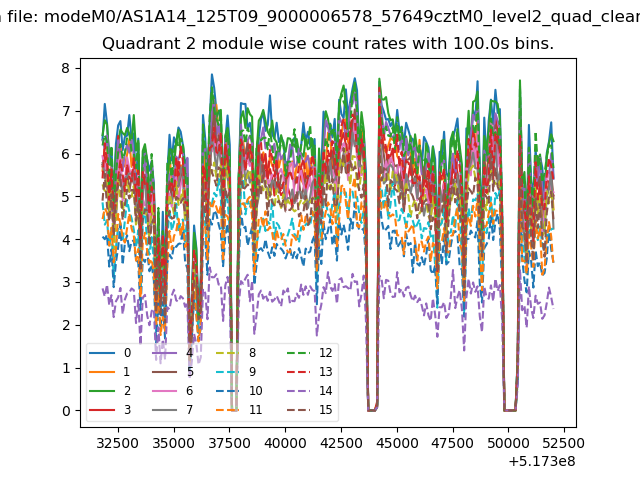
| Module-wise count rates for Quadrant B Data is divided into 100 sec bins |
 |
 |
| Module-wise count rates for Quadrant C Data is divided into 100 sec bins |
 |
 |
| Module-wise count rates for Quadrant D Data is divided into 100 sec bins |
 |
 |
| Parameter | Plot |
|---|---|
| CZT HV Monitor | 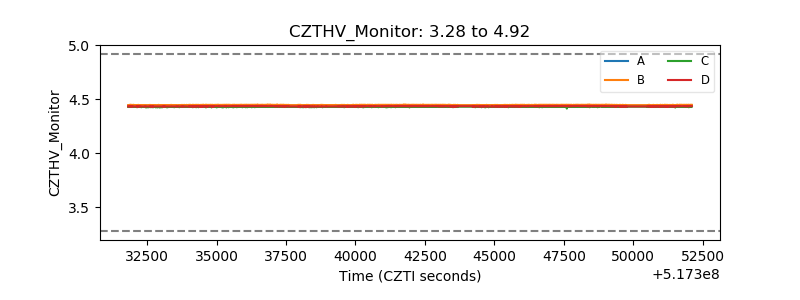 |
| D_VDD | 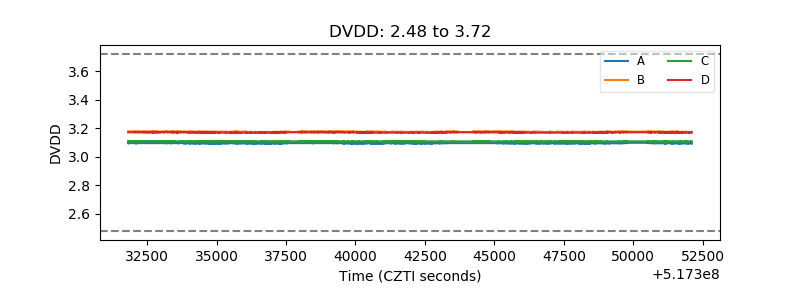 |
| Temperature 1 | 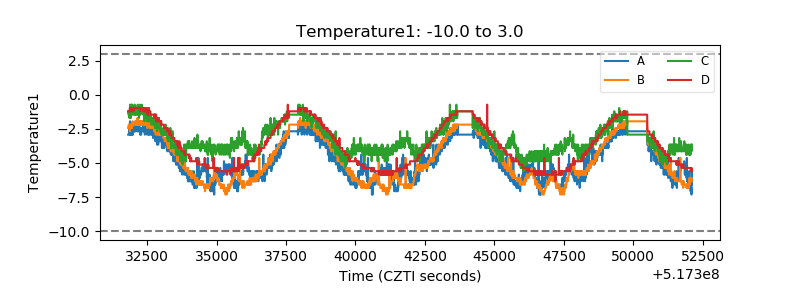 |
| Veto HV Monitor | 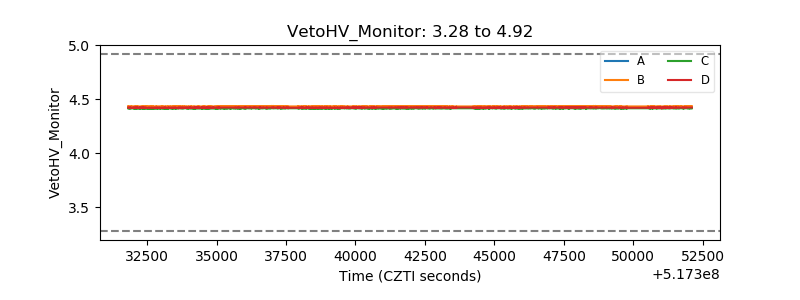 |
| Veto LLD | 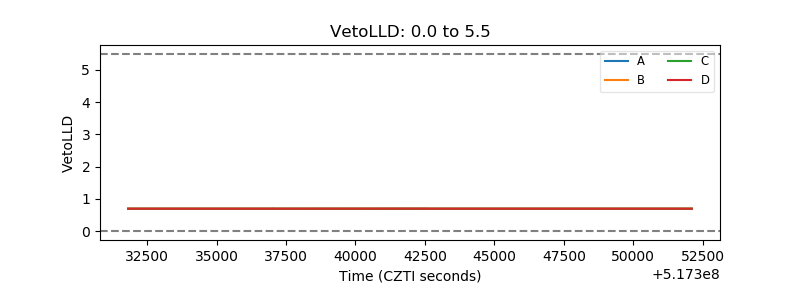 |
| Alpha Counter | 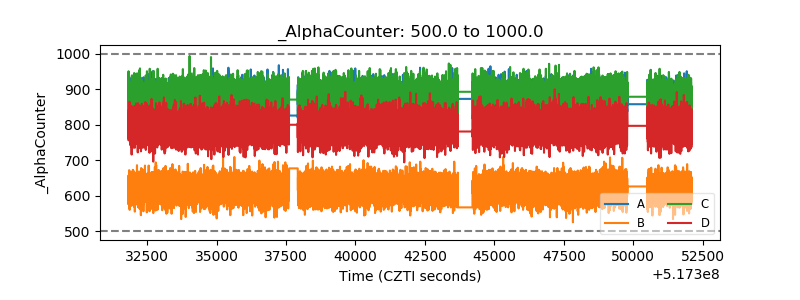 |
| _CPM_Rate | 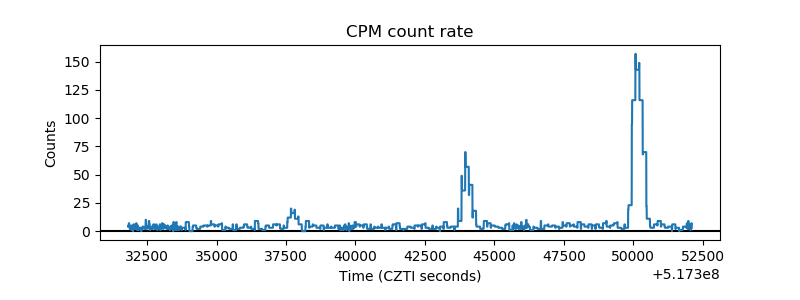 |
| CZT Counter | 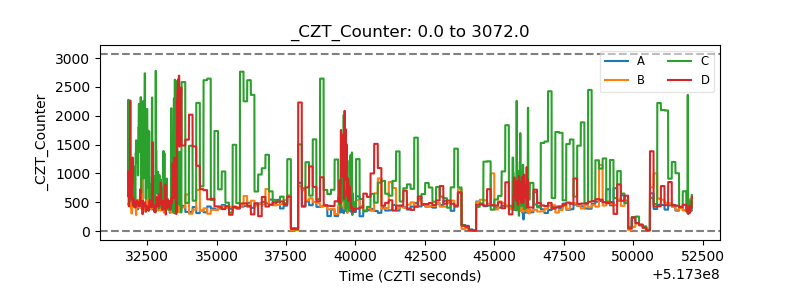 |
| +2.5 Volts monitor |  |
| +5 Volts monitor |  |
| _ROLL_ROT | 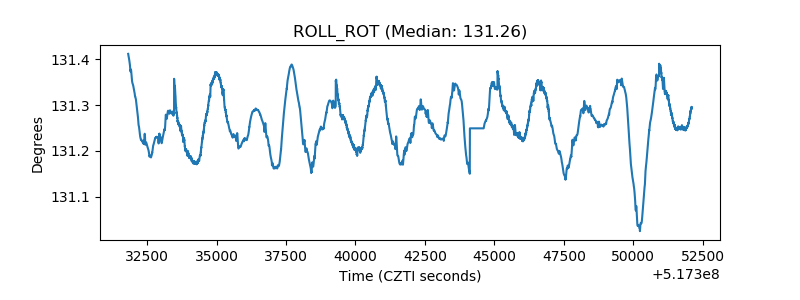 |
| _Roll_DEC | 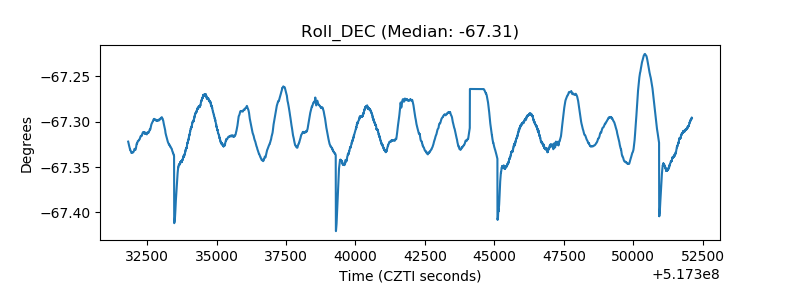 |
| _Roll_RA | 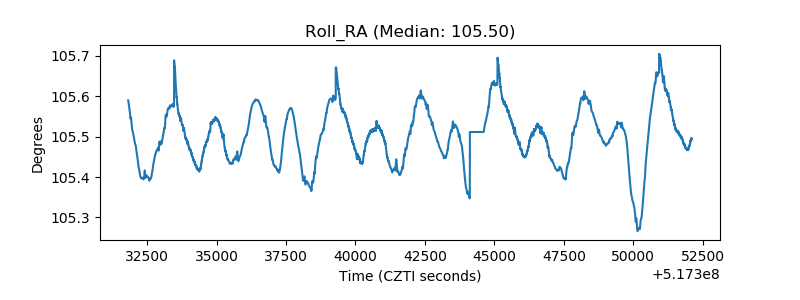 |
| Veto Counter | 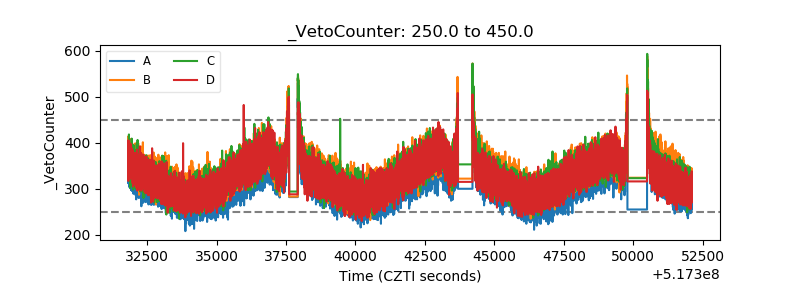 |