| Param | Original file | Final file |
|---|---|---|
| Filename | modeM0/AS1A14_125T09_9000006578_57652cztM0_level2.fits | modeM0/AS1A14_125T09_9000006578_57652cztM0_level2_quad_clean.evt |
| Size (bytes) | 418,579,200 | 96,831,360 |
| Size | 399.2 MB | 92.3 MB |
| Events in quadrant A | 2,835,575 | 645,148 |
| Events in quadrant B | 3,032,670 | 690,574 |
| Events in quadrant C | 5,384,911 | 572,543 |
| Events in quadrant D | 3,728,371 | 564,467 |
| Mode M9 | |||
|---|---|---|---|
| Quadrant | BADHDUFLAG | Total packets | Discarded packets |
| A | 0 | 16 | 0 |
| B | 0 | 17 | 0 |
| C | 0 | 17 | 0 |
| D | 0 | 17 | 0 |
| Mode SS | |||
|---|---|---|---|
| Quadrant | BADHDUFLAG | Total packets | Discarded packets |
| A | 0 | 132 | 0 |
| B | 0 | 132 | 0 |
| C | 0 | 132 | 0 |
| D | 0 | 132 | 0 |
| Mode M0 | |||
|---|---|---|---|
| Quadrant | BADHDUFLAG | Total packets | Discarded packets |
| A | 0 | 13462 | 2 |
| B | 0 | 13753 | 2 |
| C | 0 | 20722 | 2 |
| D | 0 | 15769 | 2 |
| Quadrant | Total seconds | Saturated seconds | Saturation percentage |
|---|---|---|---|
| A | 6591 | 31 | 0.470338% |
| B | 6591 | 59 | 0.895160% |
| C | 6591 | 546 | 8.284024% |
| D | 6591 | 175 | 2.655136% |
Noise dominated data is calculated using 1-second bins in cleaned event files. If a bin has >2000 counts, and if more than 50% of those come from <1% of pixels, then it is considered to be noise-dominated and hence unusable.
| Quadrant | # 1 sec bins | Bins with >0 counts | Bins with >2000 counts | High rate bins dominated by noise | Noise dominated (total time) | Noise dominated (detector-on time) | Marked lightcurve |
|---|---|---|---|---|---|---|---|
| A | 7631 | 6591 | 2 | 2 | 0.03% | 0.03% | 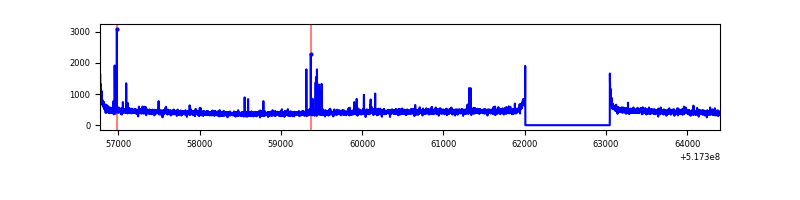 |
| B | 7631 | 6592 | 14 | 14 | 0.18% | 0.21% | 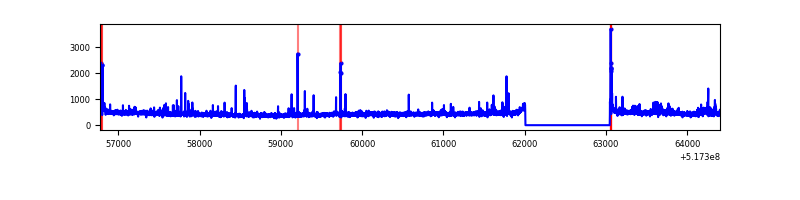 |
| C | 7631 | 6592 | 415 | 415 | 5.44% | 6.30% | 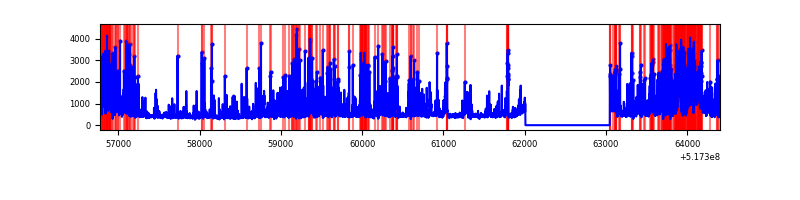 |
| D | 7631 | 6592 | 130 | 130 | 1.70% | 1.97% | 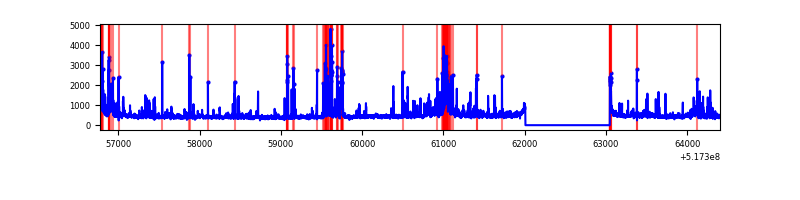 |
Top three noisy pixels from each quadrant. If the there are fewer than three noisy pixels in the level2.evt file, extra rows are filled as -1
| Pixel properties | Quadrant properties | ||||||
|---|---|---|---|---|---|---|---|
| Quadrant | DetID | PixID | Counts | Sigma | Mean | Median | Sigma |
| A | 4 | 13 | 24675 | 135.13 | 718 | 699 | 177.4 |
| A | 3 | 245 | 10893 | 57.45 | 718 | 699 | 177.4 |
| A | 4 | 3 | 10521 | 55.36 | 718 | 699 | 177.4 |
| B | 10 | 247 | 57027 | 373.12 | 709 | 682 | 151.0 |
| B | 10 | 16 | 35707 | 231.94 | 709 | 682 | 151.0 |
| B | 5 | 172 | 33767 | 219.09 | 709 | 682 | 151.0 |
| C | 15 | 224 | 2493271 | 13589.65 | 674 | 665 | 183.4 |
| C | 14 | 254 | 124178 | 673.39 | 674 | 665 | 183.4 |
| C | 6 | 223 | 119493 | 647.85 | 674 | 665 | 183.4 |
| D | 3 | 12 | 339194 | 1753.92 | 680 | 648 | 193.0 |
| D | 8 | 240 | 276054 | 1426.81 | 680 | 648 | 193.0 |
| D | 8 | 160 | 70178 | 360.22 | 680 | 648 | 193.0 |
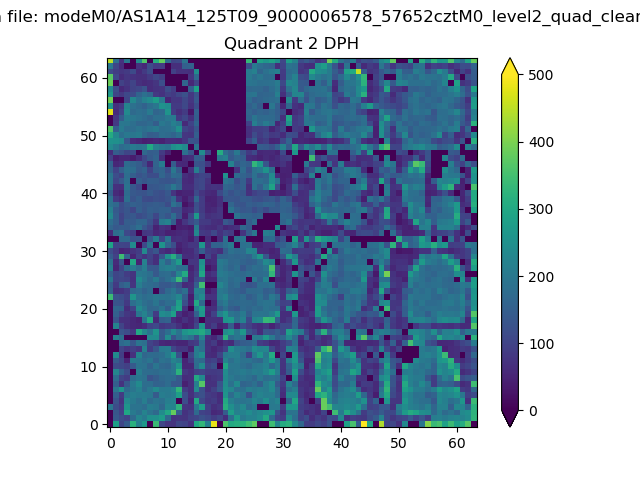
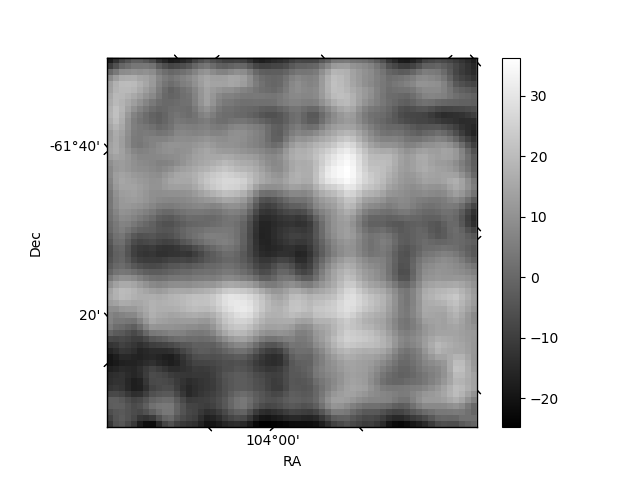
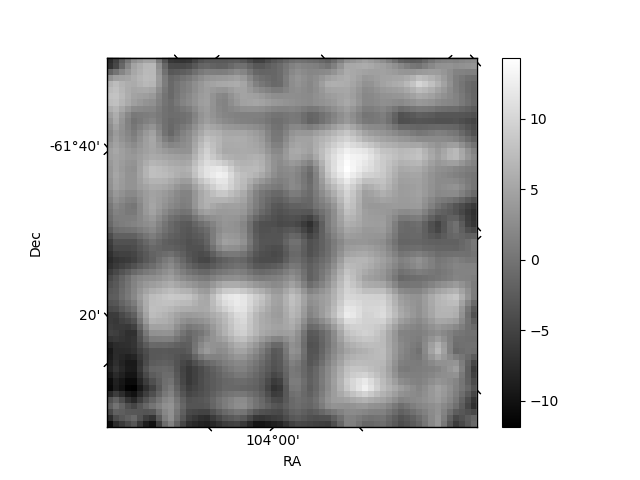
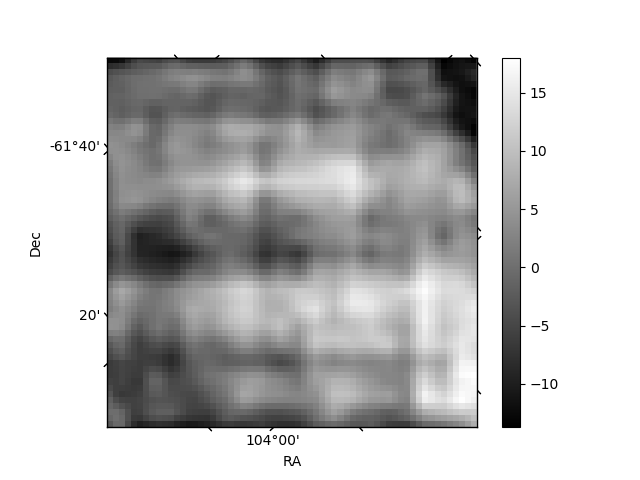
Histogram calculated using DETX and DETY for each event in the final _common_clean file
| Quadrant A | 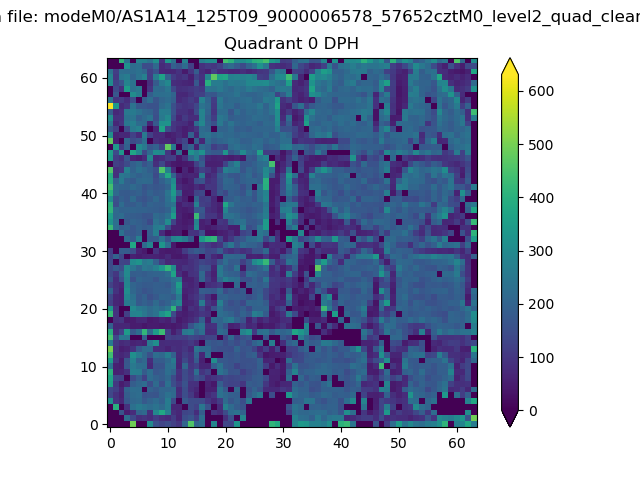 |
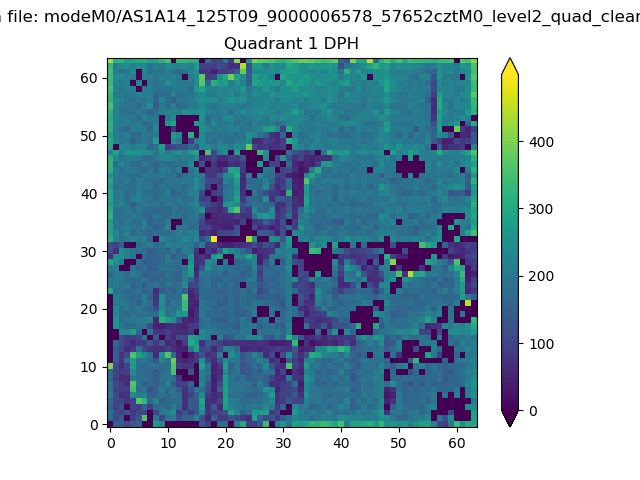 |
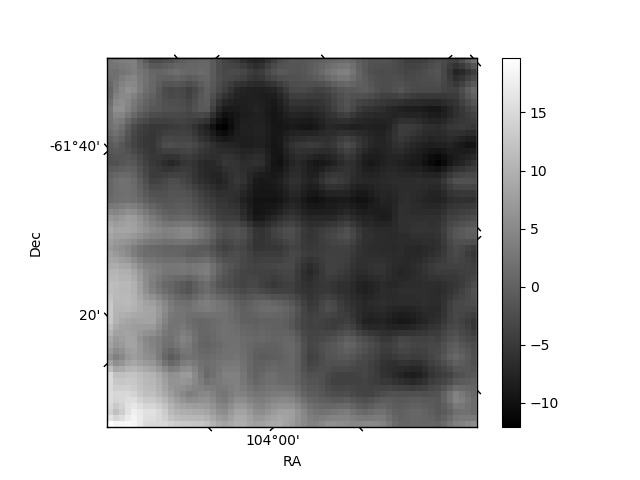
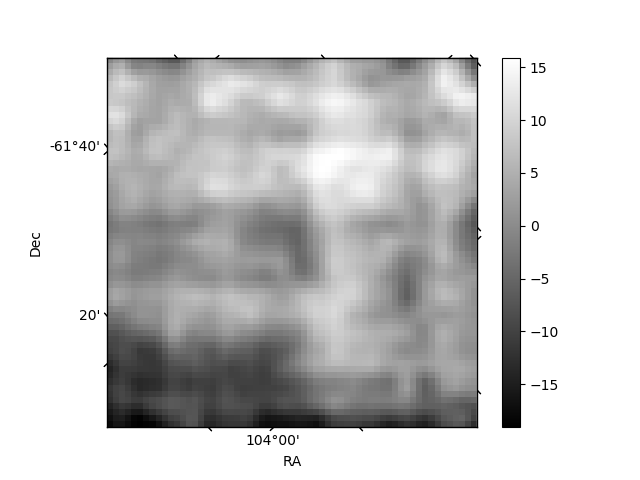
Quadrant B |
|---|---|---|---|
| Quadrant D | 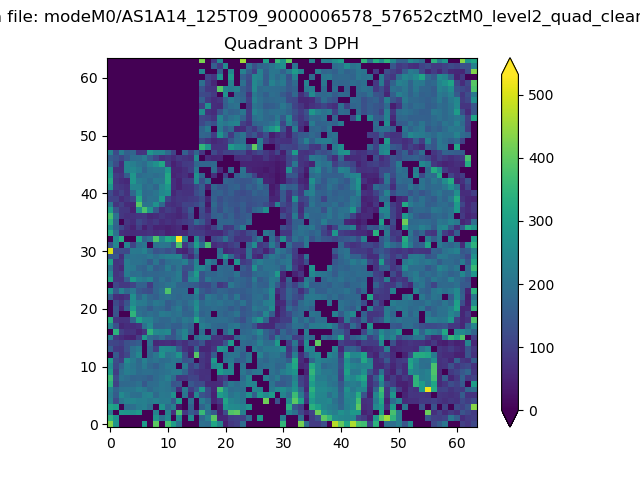 |
 |
Quadrant C |
| Plot type | Count rate plots | Images |
|---|---|---|
| Comparison with Poisson distribution Blue bars denote a histogram of data divided into 1 sec bins. Red curve is a Poisson curve with rate = median count rate of data. |
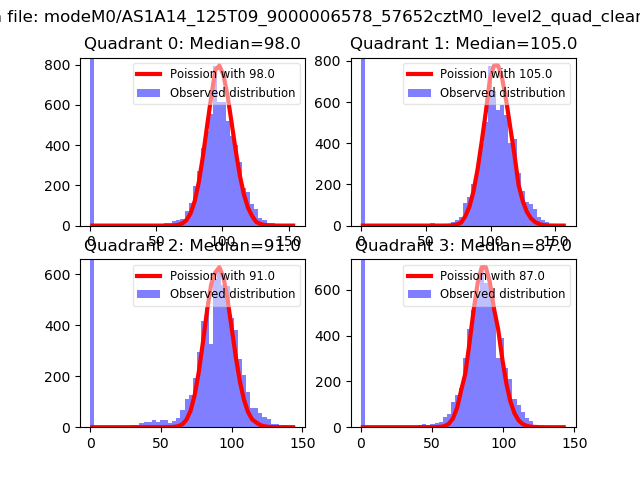 |
 |
| Quadrant-wise count rates Data is divided into 100 sec bins |
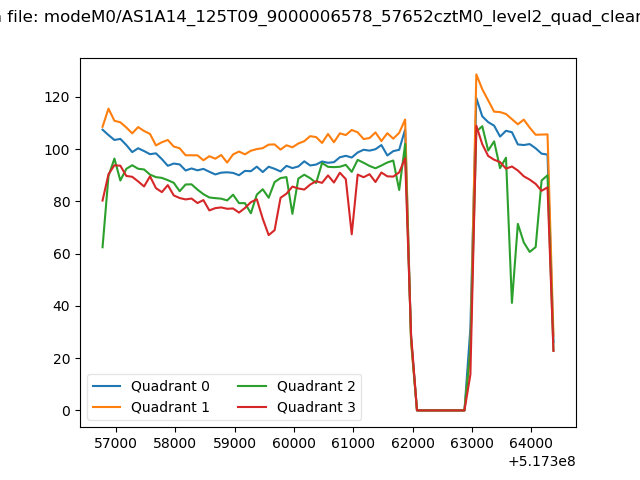 |
|
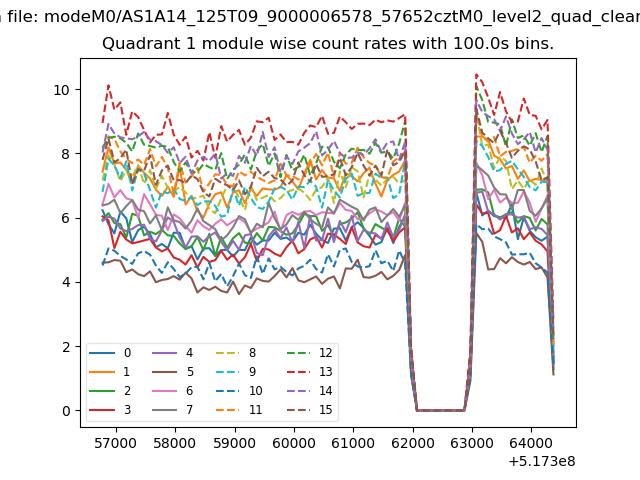
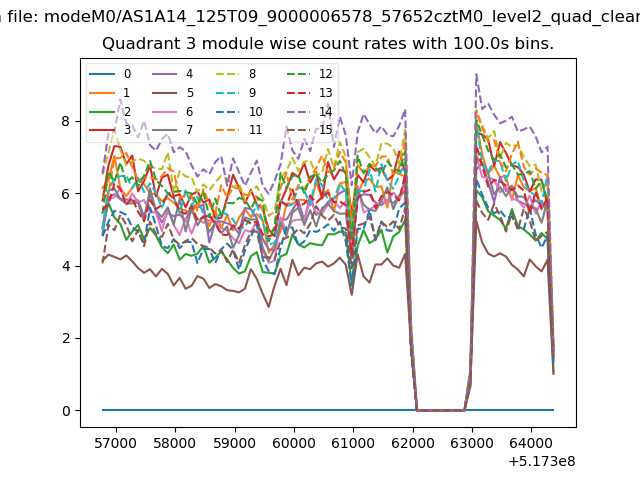
| Module-wise count rates for Quadrant A Data is divided into 100 sec bins |
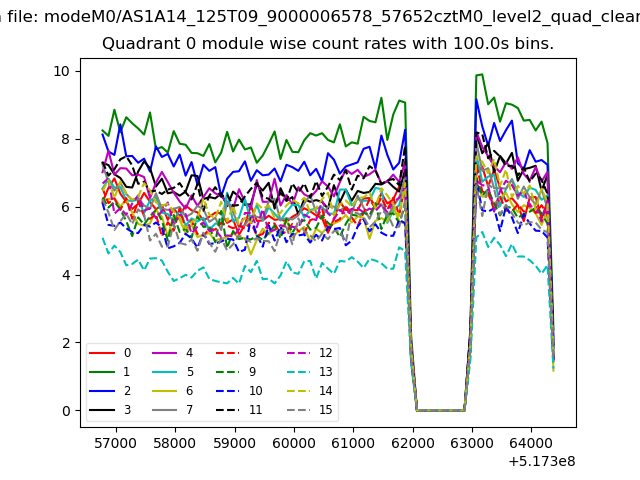 |
 |
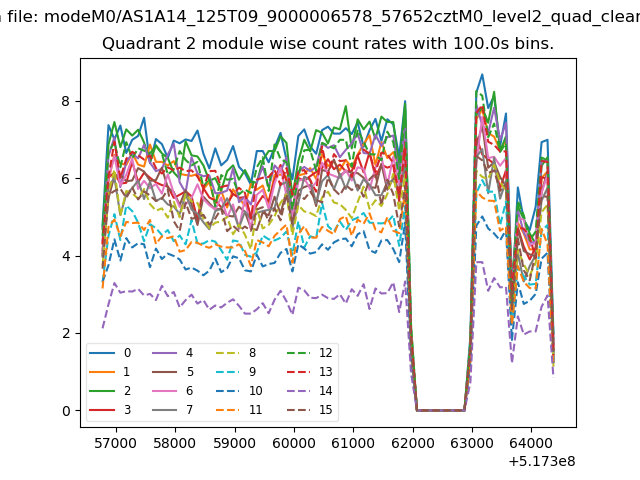
| Module-wise count rates for Quadrant B Data is divided into 100 sec bins |
 |
 |
| Module-wise count rates for Quadrant C Data is divided into 100 sec bins |
 |
 |
| Module-wise count rates for Quadrant D Data is divided into 100 sec bins |
 |
 |
| Parameter | Plot |
|---|---|
| CZT HV Monitor | 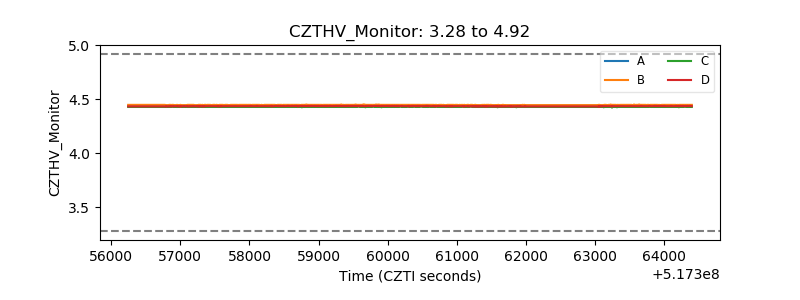 |
| D_VDD | 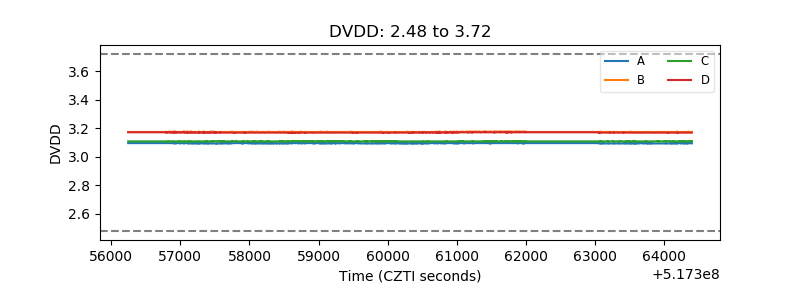 |
| Temperature 1 | 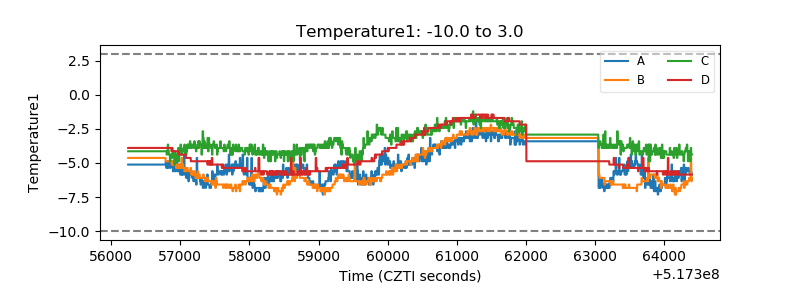 |
| Veto HV Monitor | 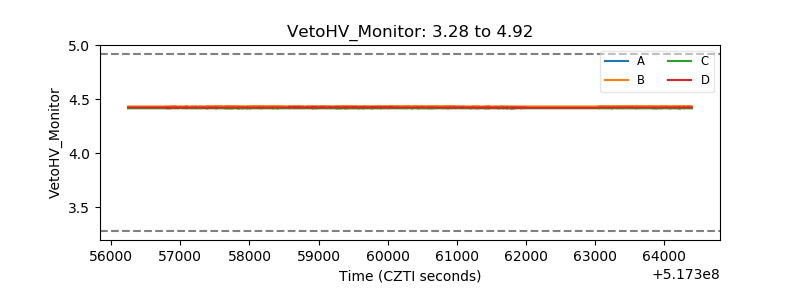 |
| Veto LLD | 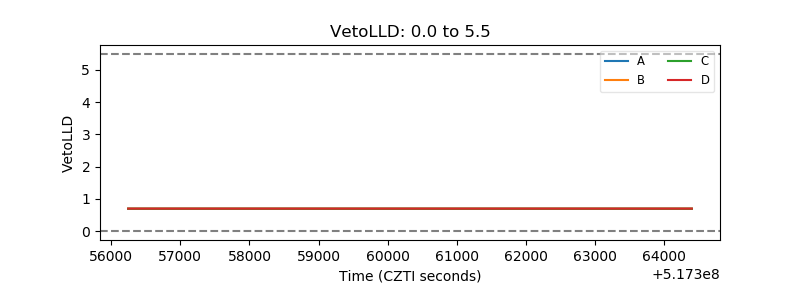 |
| Alpha Counter | 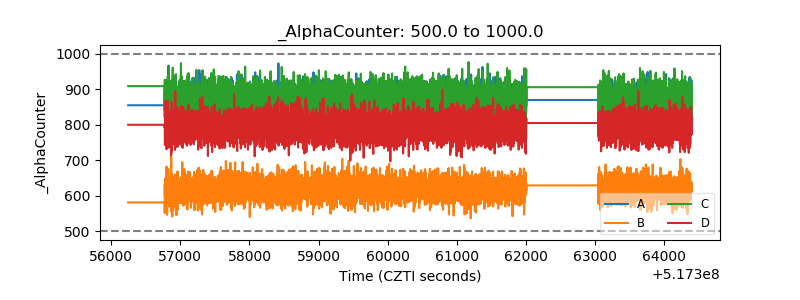 |
| _CPM_Rate | 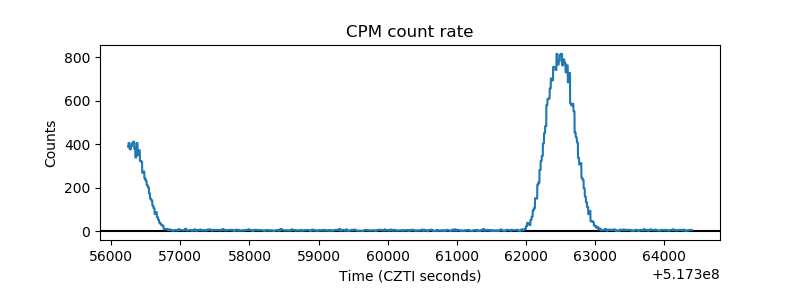 |
| CZT Counter | 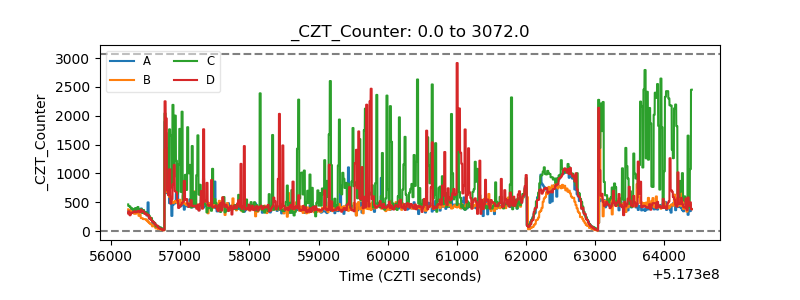 |
| +2.5 Volts monitor | 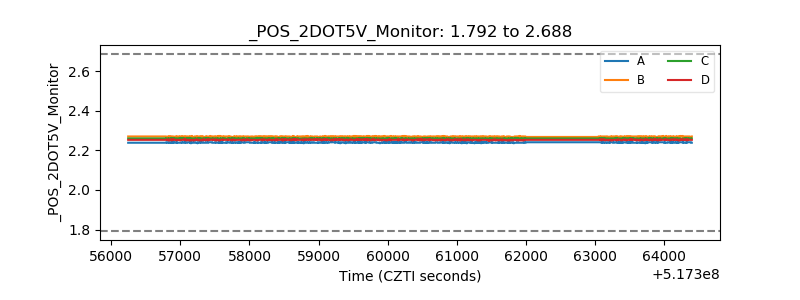 |
| +5 Volts monitor | 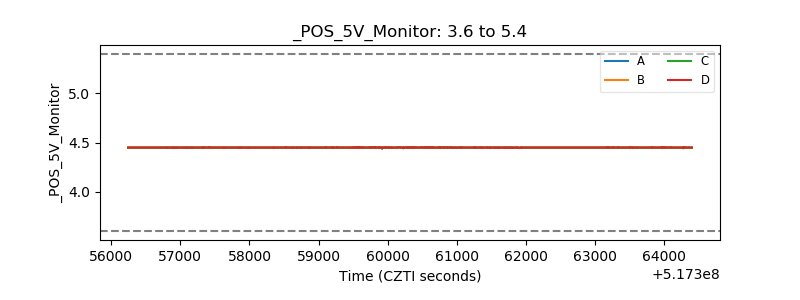 |
| _ROLL_ROT | 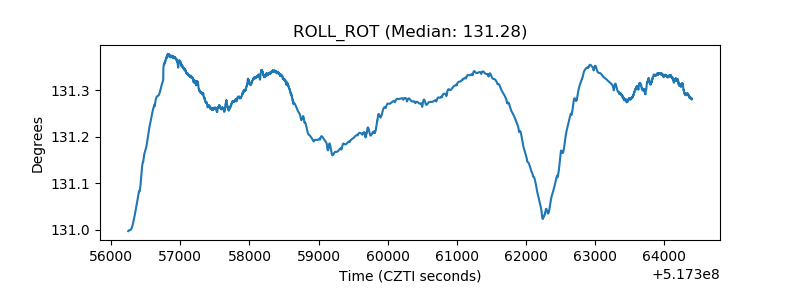 |
| _Roll_DEC | 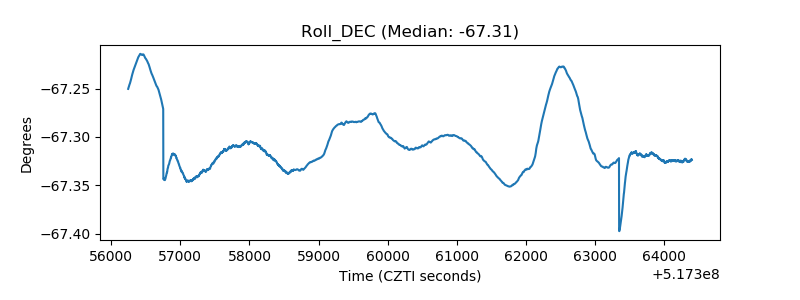 |
| _Roll_RA | 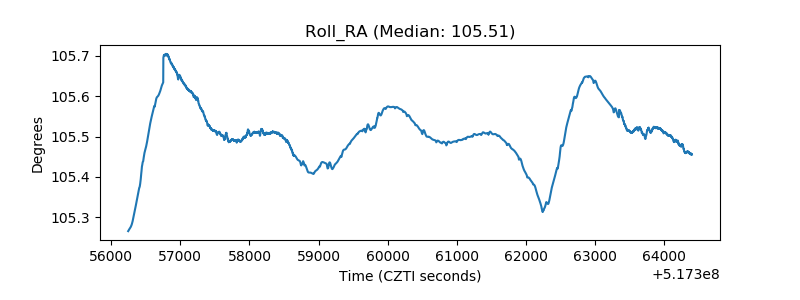 |
| Veto Counter | 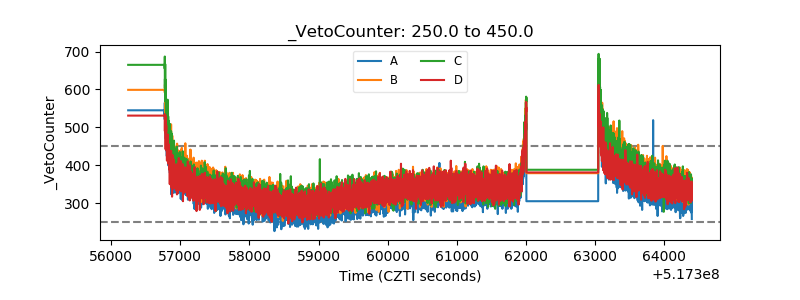 |