| Param | Original file | Final file |
|---|---|---|
| Filename | modeM0/AS1A14_125T09_9000006578_57653cztM0_level2.fits | modeM0/AS1A14_125T09_9000006578_57653cztM0_level2_quad_clean.evt |
| Size (bytes) | 487,776,960 | 107,340,480 |
| Size | 465.2 MB | 102.4 MB |
| Events in quadrant A | 3,117,924 | 717,664 |
| Events in quadrant B | 3,467,565 | 774,206 |
| Events in quadrant C | 5,860,440 | 648,949 |
| Events in quadrant D | 5,056,003 | 613,494 |
| Mode M9 | |||
|---|---|---|---|
| Quadrant | BADHDUFLAG | Total packets | Discarded packets |
| A | 0 | 23 | 0 |
| B | 0 | 23 | 0 |
| C | 0 | 23 | 0 |
| D | 0 | 23 | 0 |
| Mode SS | |||
|---|---|---|---|
| Quadrant | BADHDUFLAG | Total packets | Discarded packets |
| A | 0 | 144 | 0 |
| B | 0 | 144 | 0 |
| C | 0 | 144 | 0 |
| D | 0 | 144 | 0 |
| Mode M0 | |||
|---|---|---|---|
| Quadrant | BADHDUFLAG | Total packets | Discarded packets |
| A | 0 | 14571 | 2 |
| B | 0 | 15265 | 3 |
| C | 0 | 22296 | 2 |
| D | 0 | 19806 | 2 |
| Quadrant | Total seconds | Saturated seconds | Saturation percentage |
|---|---|---|---|
| A | 7130 | 48 | 0.673212% |
| B | 7129 | 88 | 1.234395% |
| C | 7129 | 554 | 7.771076% |
| D | 7130 | 426 | 5.974755% |
Noise dominated data is calculated using 1-second bins in cleaned event files. If a bin has >2000 counts, and if more than 50% of those come from <1% of pixels, then it is considered to be noise-dominated and hence unusable.
| Quadrant | # 1 sec bins | Bins with >0 counts | Bins with >2000 counts | High rate bins dominated by noise | Noise dominated (total time) | Noise dominated (detector-on time) | Marked lightcurve |
|---|---|---|---|---|---|---|---|
| A | 9305 | 7130 | 0 | 0 | 0.00% | 0.00% | 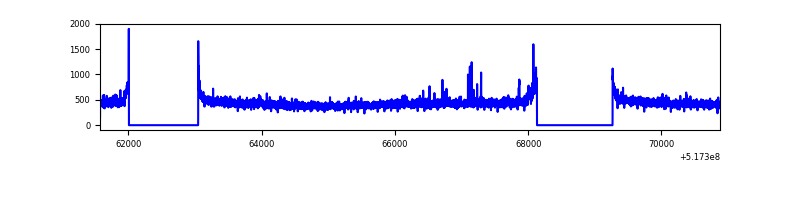 |
| B | 9304 | 7131 | 10 | 10 | 0.11% | 0.14% | 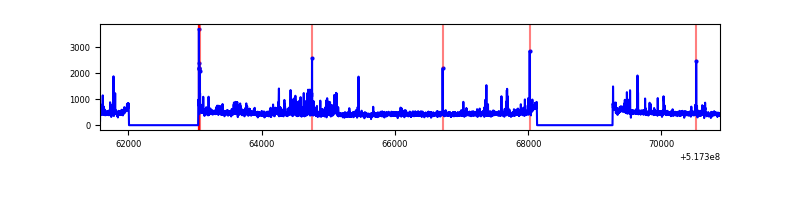 |
| C | 9304 | 7131 | 427 | 427 | 4.59% | 5.99% | 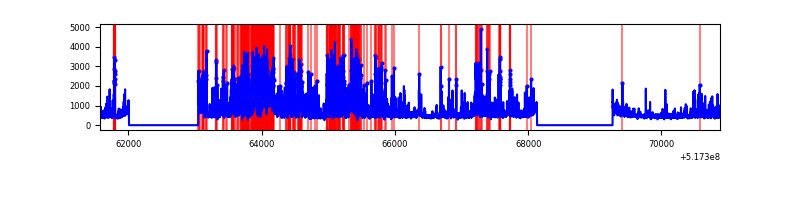 |
| D | 9305 | 7132 | 349 | 349 | 3.75% | 4.89% | 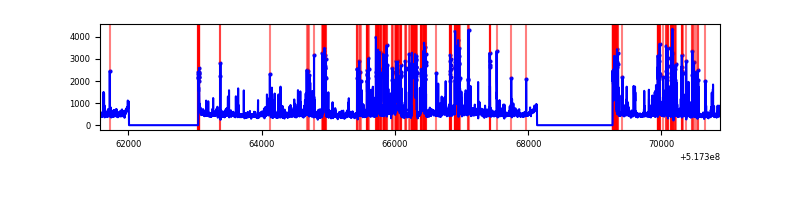 |
Top three noisy pixels from each quadrant. If the there are fewer than three noisy pixels in the level2.evt file, extra rows are filled as -1
| Pixel properties | Quadrant properties | ||||||
|---|---|---|---|---|---|---|---|
| Quadrant | DetID | PixID | Counts | Sigma | Mean | Median | Sigma |
| A | 13 | 248 | 31397 | 156.23 | 793 | 772 | 196.0 |
| A | 3 | 137 | 9426 | 44.15 | 793 | 772 | 196.0 |
| A | 13 | 254 | 8804 | 40.97 | 793 | 772 | 196.0 |
| B | 10 | 247 | 202079 | 1203.61 | 784 | 753 | 167.3 |
| B | 10 | 16 | 32157 | 187.74 | 784 | 753 | 167.3 |
| B | 4 | 201 | 24040 | 139.22 | 784 | 753 | 167.3 |
| C | 15 | 224 | 2474140 | 12094.19 | 755 | 747 | 204.5 |
| C | 6 | 13 | 245931 | 1198.88 | 755 | 747 | 204.5 |
| C | 14 | 254 | 129715 | 630.61 | 755 | 747 | 204.5 |
| D | 8 | 240 | 1227721 | 5802.42 | 748 | 715 | 211.5 |
| D | 3 | 12 | 199654 | 940.77 | 748 | 715 | 211.5 |
| D | 8 | 160 | 133782 | 629.26 | 748 | 715 | 211.5 |
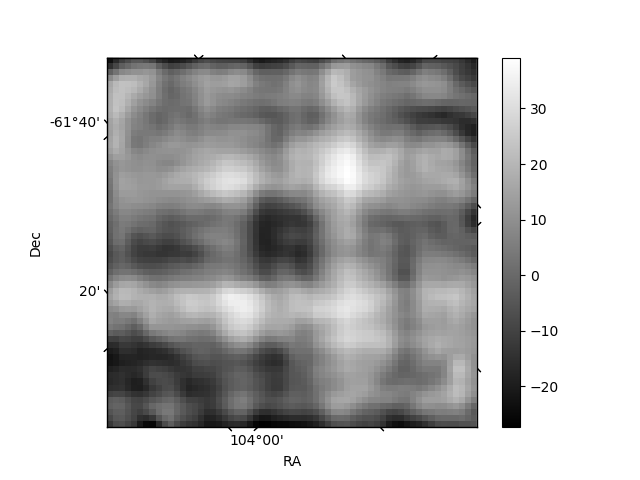
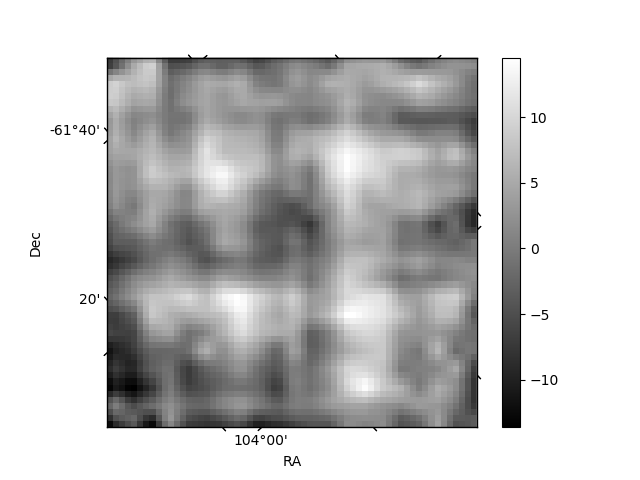
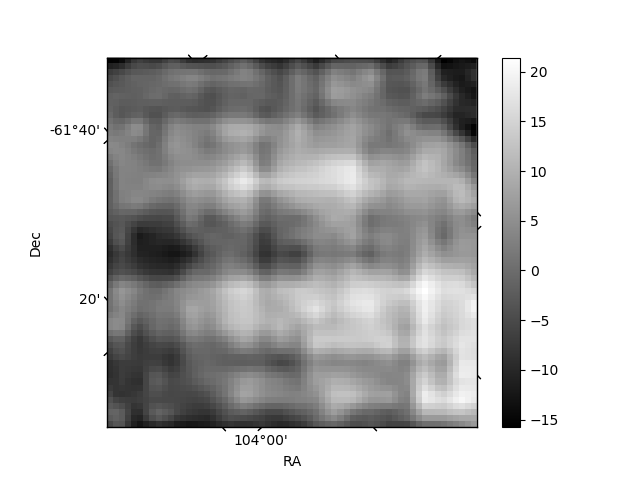
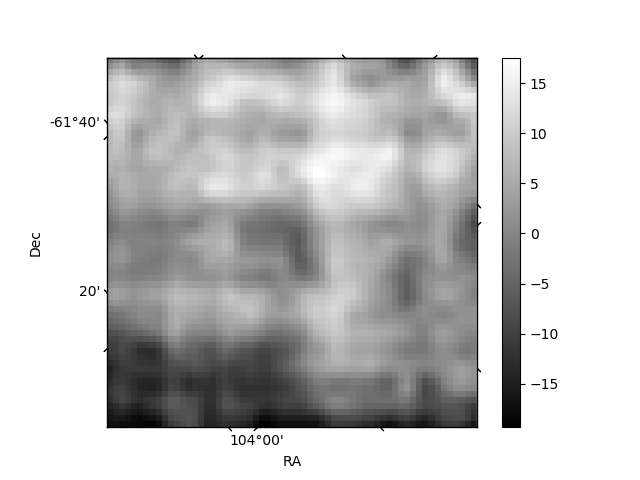
Histogram calculated using DETX and DETY for each event in the final _common_clean file
| Quadrant A | 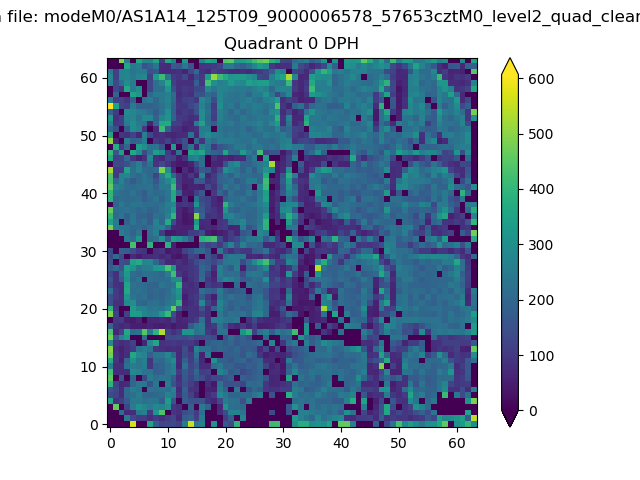 |
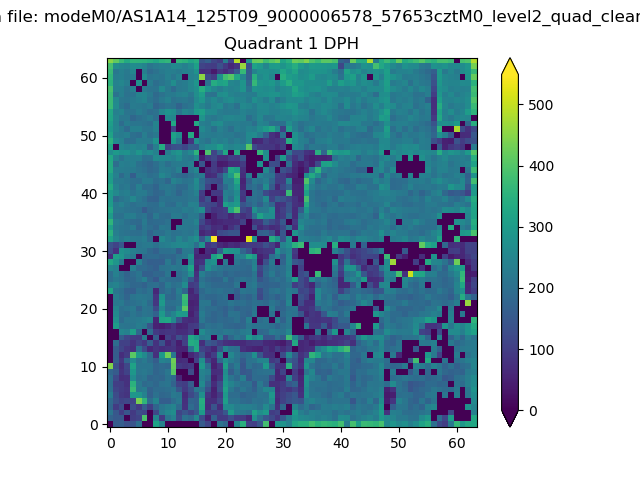 |
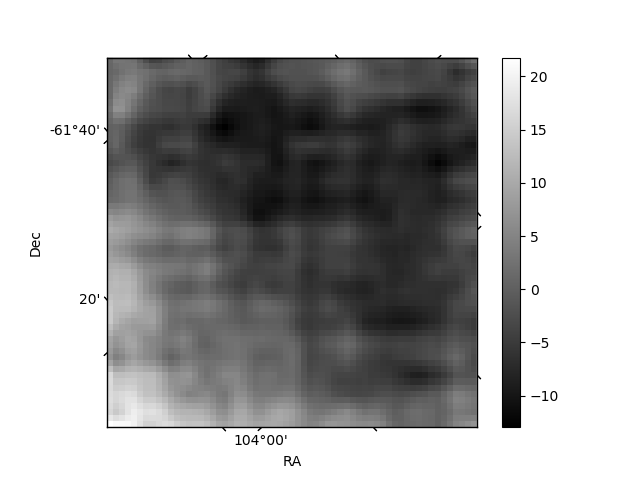
Quadrant B |
|---|---|---|---|
| Quadrant D | 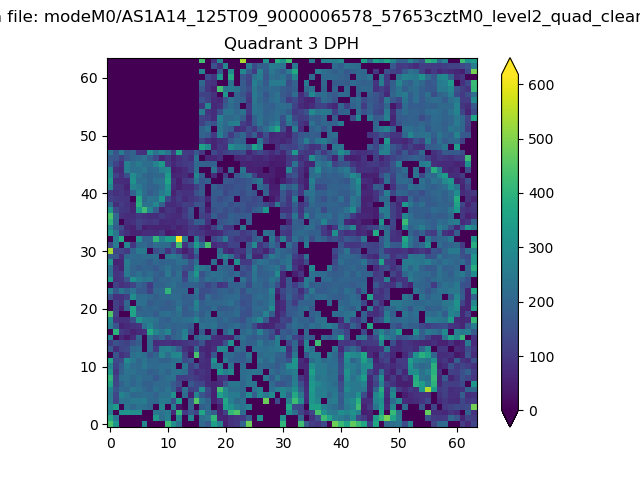 |
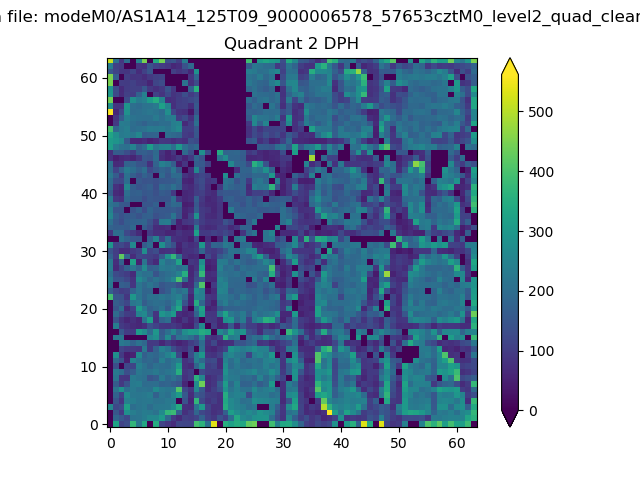 |
Quadrant C |
| Plot type | Count rate plots | Images |
|---|---|---|
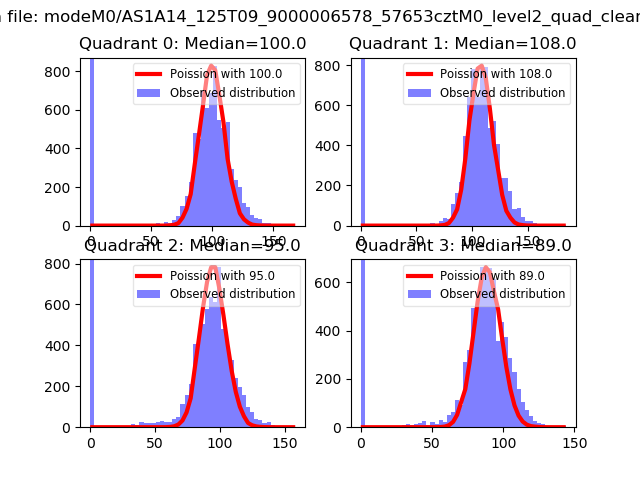
| Comparison with Poisson distribution Blue bars denote a histogram of data divided into 1 sec bins. Red curve is a Poisson curve with rate = median count rate of data. |
 |
 |
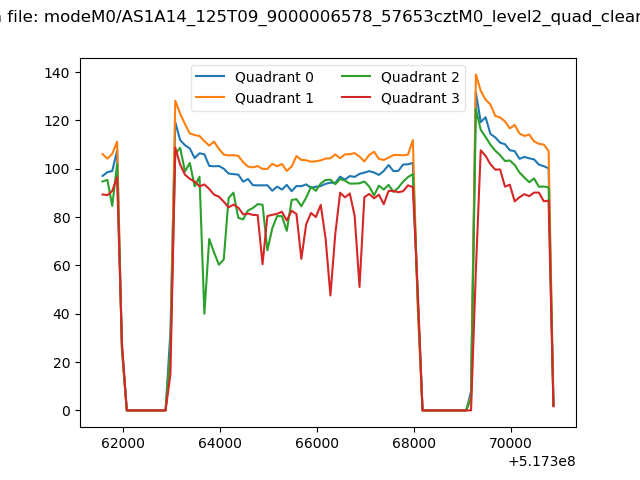
| Quadrant-wise count rates Data is divided into 100 sec bins |
 |
|
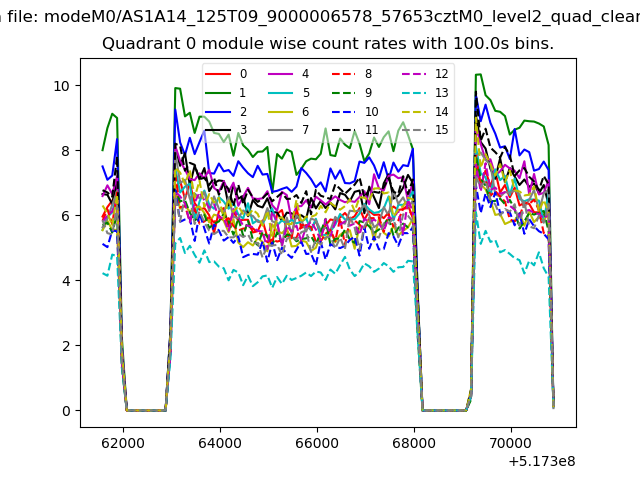
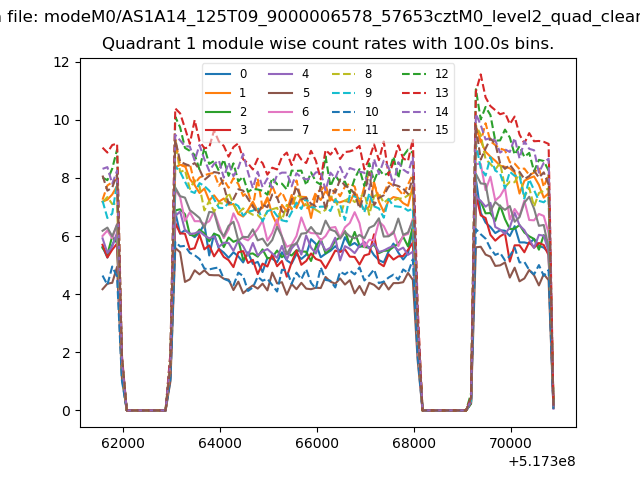
| Module-wise count rates for Quadrant A Data is divided into 100 sec bins |
 |
 |
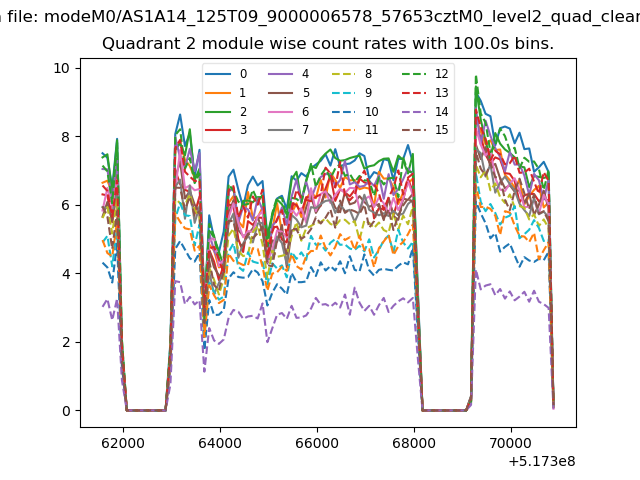
| Module-wise count rates for Quadrant B Data is divided into 100 sec bins |
 |
 |
| Module-wise count rates for Quadrant C Data is divided into 100 sec bins |
 |
 |
| Module-wise count rates for Quadrant D Data is divided into 100 sec bins |
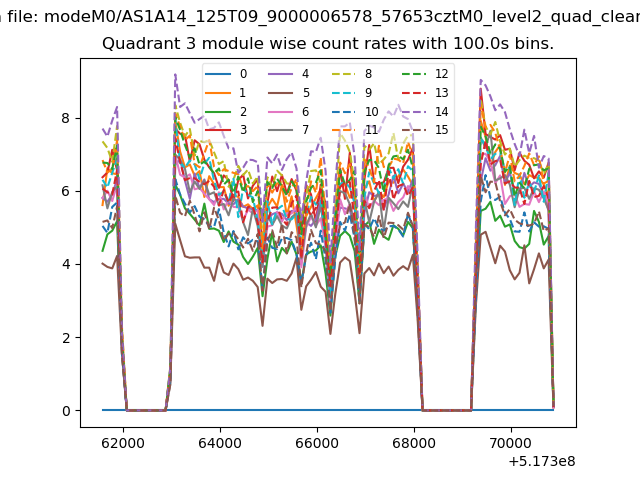 |
 |
| Parameter | Plot |
|---|---|
| CZT HV Monitor | 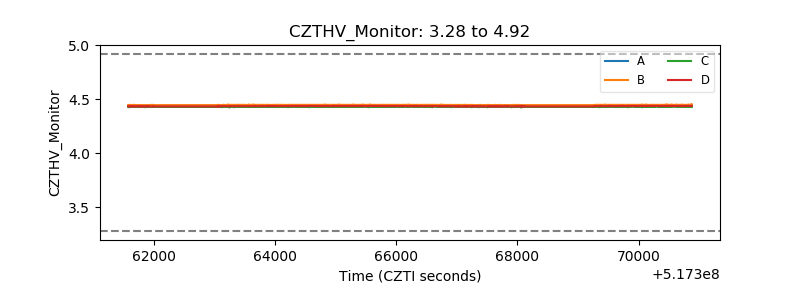 |
| D_VDD | 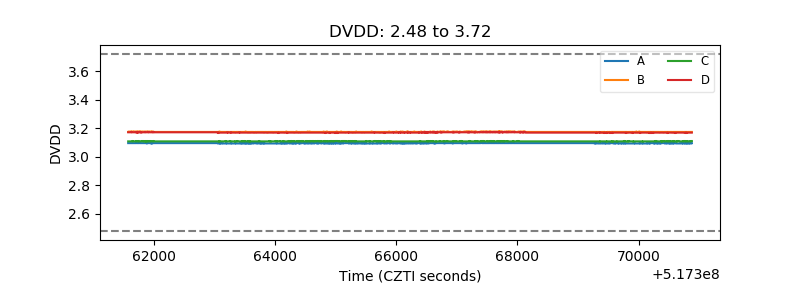 |
| Temperature 1 |  |
| Veto HV Monitor | 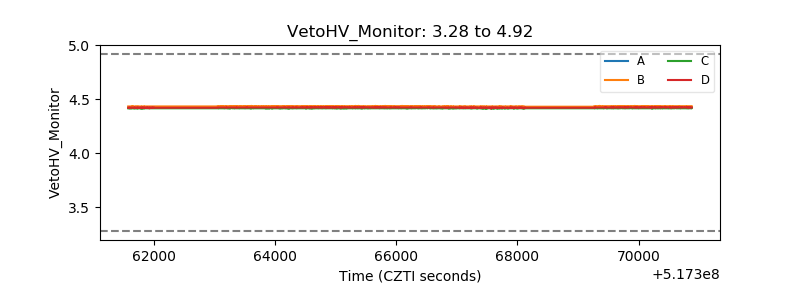 |
| Veto LLD | 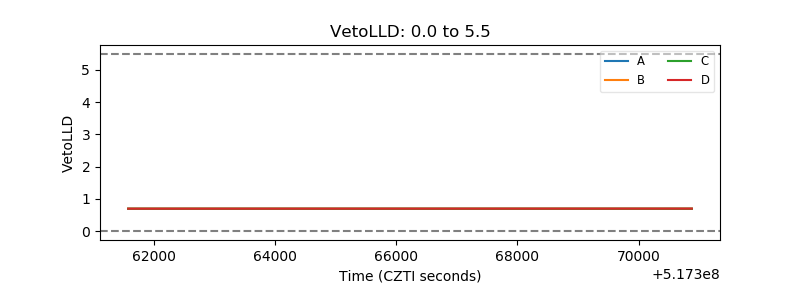 |
| Alpha Counter | 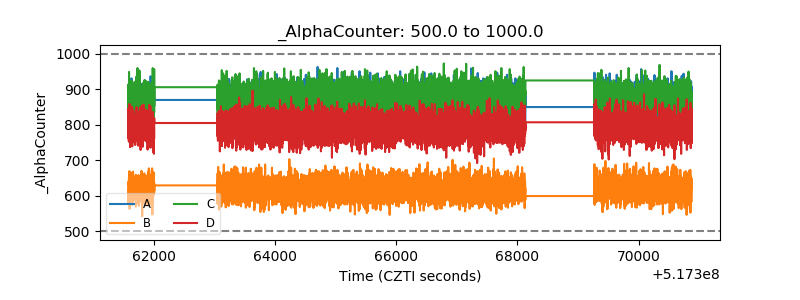 |
| _CPM_Rate | 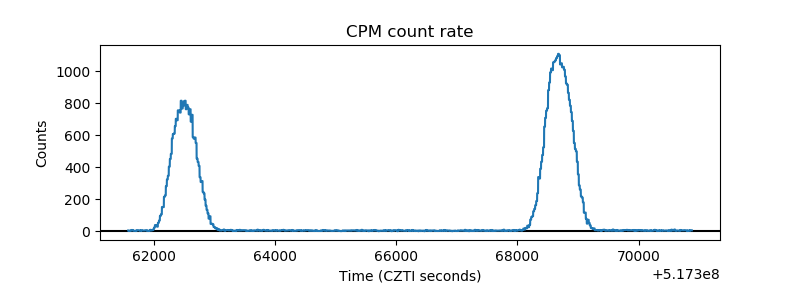 |
| CZT Counter | 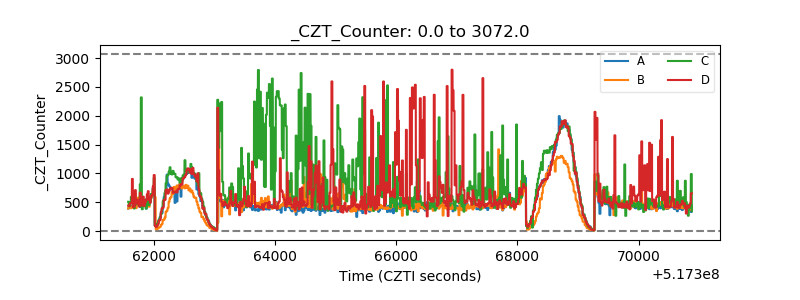 |
| +2.5 Volts monitor |  |
| +5 Volts monitor |  |
| _ROLL_ROT | 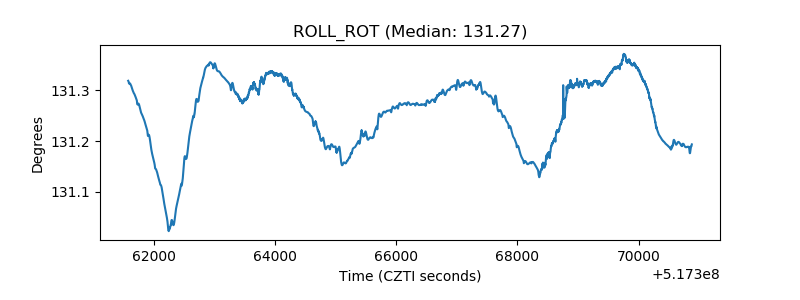 |
| _Roll_DEC | 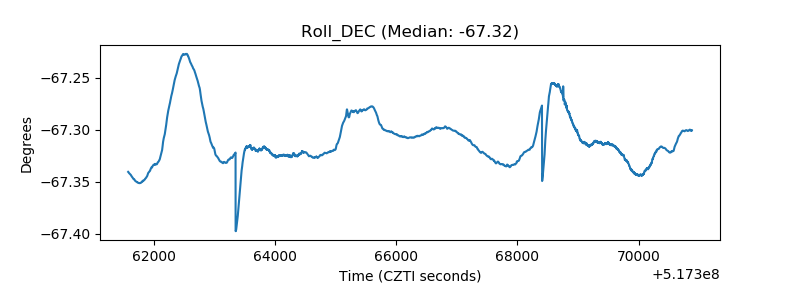 |
| _Roll_RA | 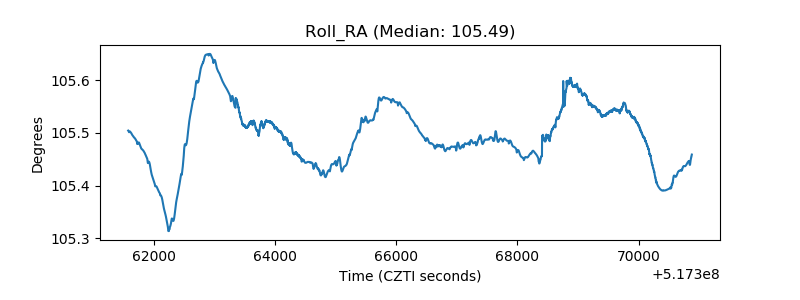 |
| Veto Counter | 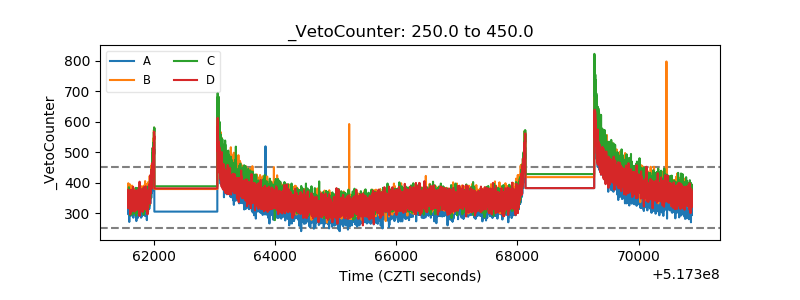 |