| Param | Original file | Final file |
|---|---|---|
| Filename | modeM0/AS1A14_125T09_9000006578_57655cztM0_level2.fits | modeM0/AS1A14_125T09_9000006578_57655cztM0_level2_quad_clean.evt |
| Size (bytes) | 390,522,240 | 98,570,880 |
| Size | 372.4 MB | 94.0 MB |
| Events in quadrant A | 2,986,775 | 652,743 |
| Events in quadrant B | 2,993,782 | 705,528 |
| Events in quadrant C | 3,713,426 | 622,477 |
| Events in quadrant D | 4,274,559 | 567,425 |
| Mode M9 | |||
|---|---|---|---|
| Quadrant | BADHDUFLAG | Total packets | Discarded packets |
| A | 0 | 12 | 0 |
| B | 0 | 12 | 0 |
| C | 0 | 12 | 0 |
| D | 0 | 12 | 0 |
| Mode SS | |||
|---|---|---|---|
| Quadrant | BADHDUFLAG | Total packets | Discarded packets |
| A | 0 | 126 | 0 |
| B | 0 | 126 | 0 |
| C | 0 | 126 | 0 |
| D | 0 | 126 | 0 |
| Mode M0 | |||
|---|---|---|---|
| Quadrant | BADHDUFLAG | Total packets | Discarded packets |
| A | 0 | 13307 | 1 |
| B | 0 | 13148 | 1 |
| C | 0 | 15299 | 1 |
| D | 0 | 16988 | 1 |
| Quadrant | Total seconds | Saturated seconds | Saturation percentage |
|---|---|---|---|
| A | 6263 | 60 | 0.958007% |
| B | 6263 | 73 | 1.165576% |
| C | 6263 | 122 | 1.947948% |
| D | 6262 | 281 | 4.487384% |
Noise dominated data is calculated using 1-second bins in cleaned event files. If a bin has >2000 counts, and if more than 50% of those come from <1% of pixels, then it is considered to be noise-dominated and hence unusable.
| Quadrant | # 1 sec bins | Bins with >0 counts | Bins with >2000 counts | High rate bins dominated by noise | Noise dominated (total time) | Noise dominated (detector-on time) | Marked lightcurve |
|---|---|---|---|---|---|---|---|
| A | 7488 | 6264 | 20 | 20 | 0.27% | 0.32% | 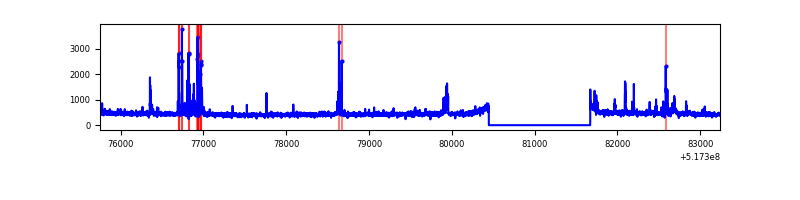 |
| B | 7488 | 6264 | 5 | 5 | 0.07% | 0.08% | 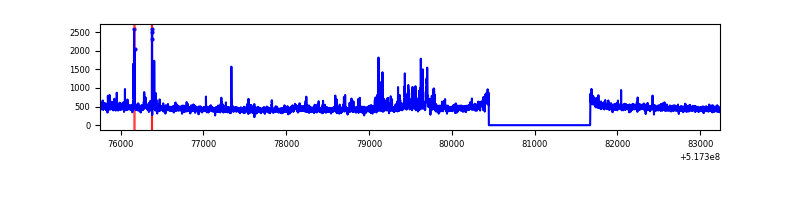 |
| C | 7488 | 6264 | 76 | 76 | 1.01% | 1.21% | 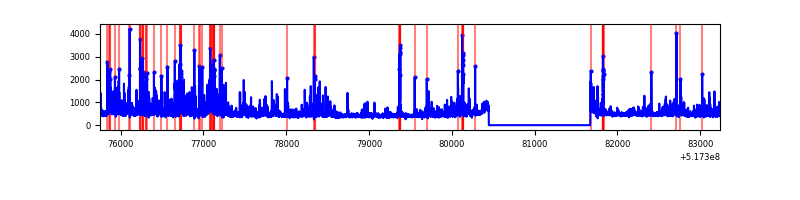 |
| D | 7487 | 6263 | 267 | 267 | 3.57% | 4.26% | 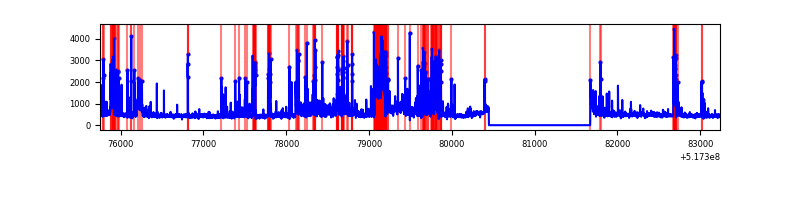 |
Top three noisy pixels from each quadrant. If the there are fewer than three noisy pixels in the level2.evt file, extra rows are filled as -1
| Pixel properties | Quadrant properties | ||||||
|---|---|---|---|---|---|---|---|
| Quadrant | DetID | PixID | Counts | Sigma | Mean | Median | Sigma |
| A | 7 | 223 | 239744 | 1369.84 | 705 | 685 | 174.5 |
| A | 4 | 3 | 19048 | 105.22 | 705 | 685 | 174.5 |
| A | 3 | 137 | 8184 | 42.97 | 705 | 685 | 174.5 |
| B | 5 | 185 | 99500 | 676.83 | 700 | 675 | 146.0 |
| B | 0 | 213 | 44927 | 303.07 | 700 | 675 | 146.0 |
| B | 5 | 172 | 42341 | 285.36 | 700 | 675 | 146.0 |
| C | 15 | 224 | 767477 | 4089.91 | 690 | 685 | 187.5 |
| C | 14 | 254 | 114339 | 606.2 | 690 | 685 | 187.5 |
| C | 6 | 223 | 73337 | 387.51 | 690 | 685 | 187.5 |
| D | 8 | 240 | 769832 | 4003.36 | 677 | 644 | 192.1 |
| D | 3 | 12 | 287697 | 1494.01 | 677 | 644 | 192.1 |
| D | 8 | 160 | 128512 | 665.51 | 677 | 644 | 192.1 |
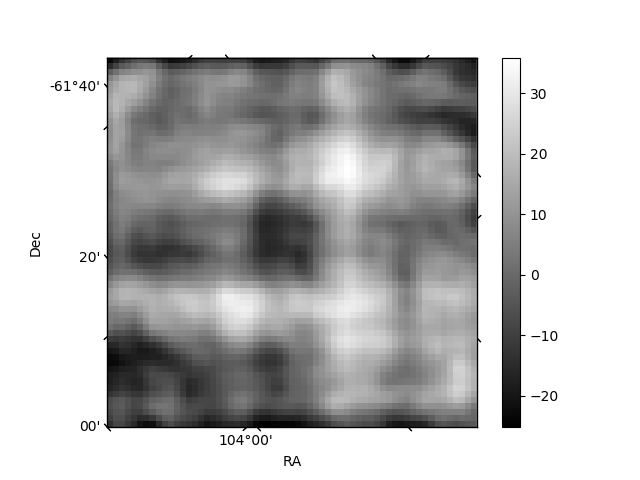
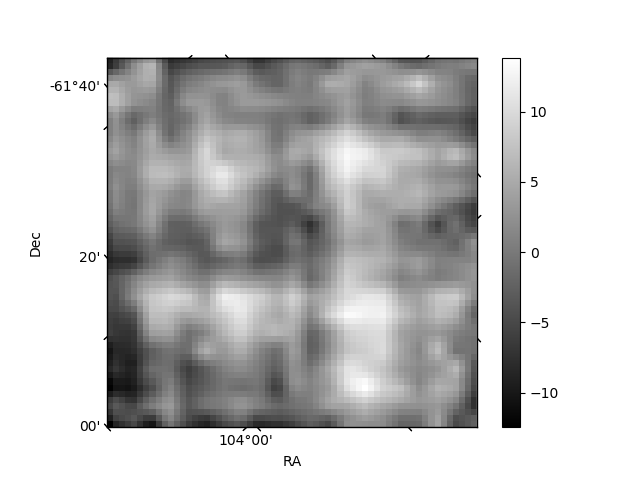
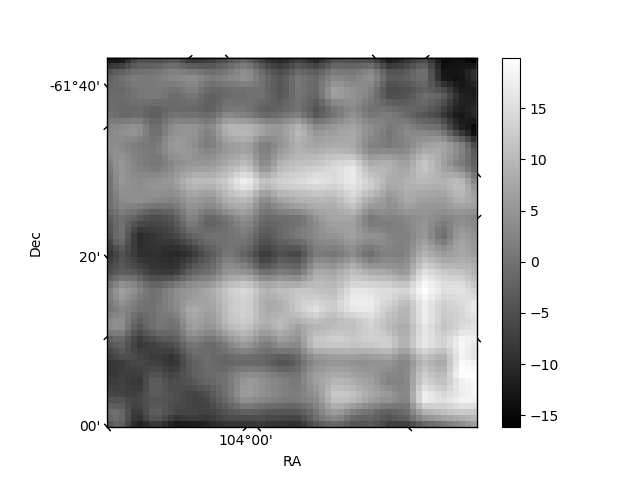
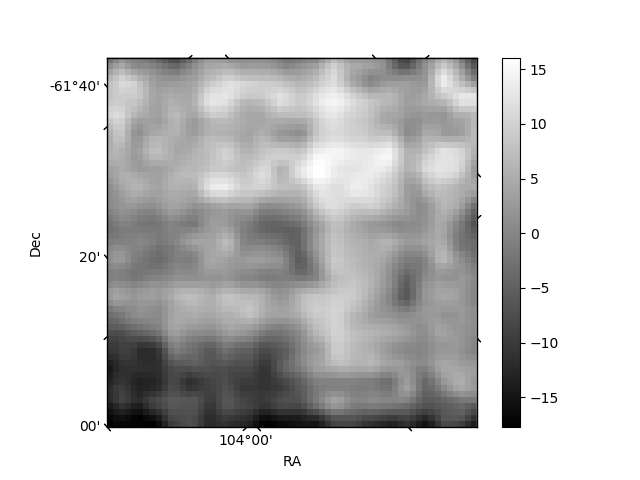
Histogram calculated using DETX and DETY for each event in the final _common_clean file
| Quadrant A | 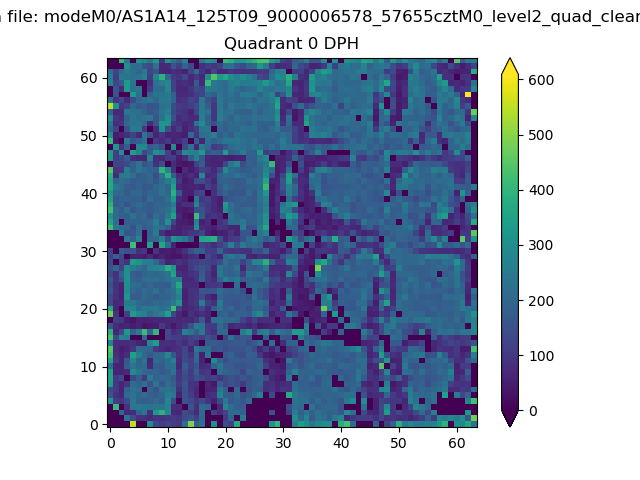 |
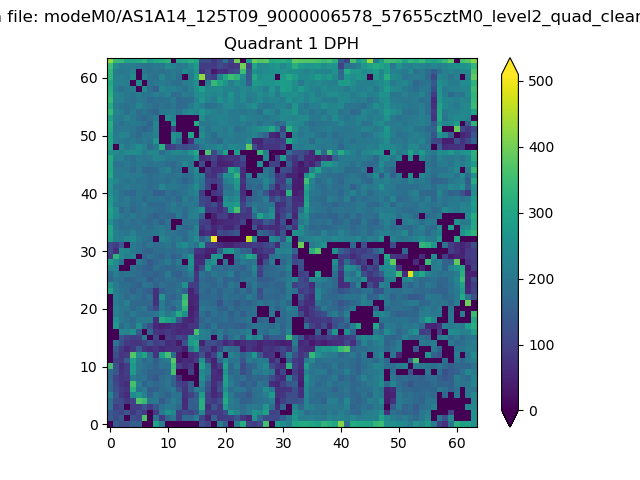 |
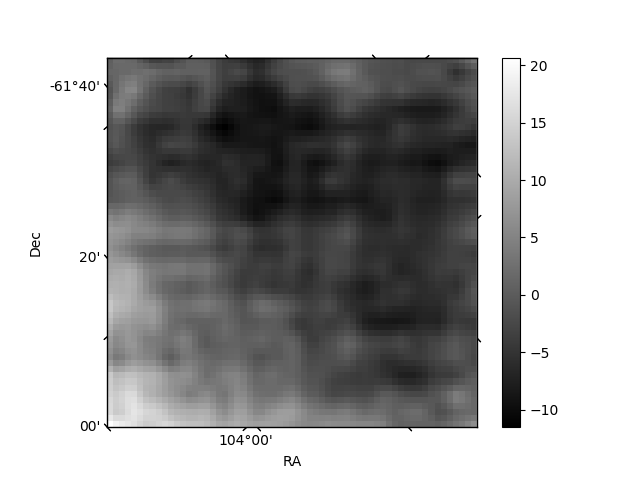
Quadrant B |
|---|---|---|---|
| Quadrant D | 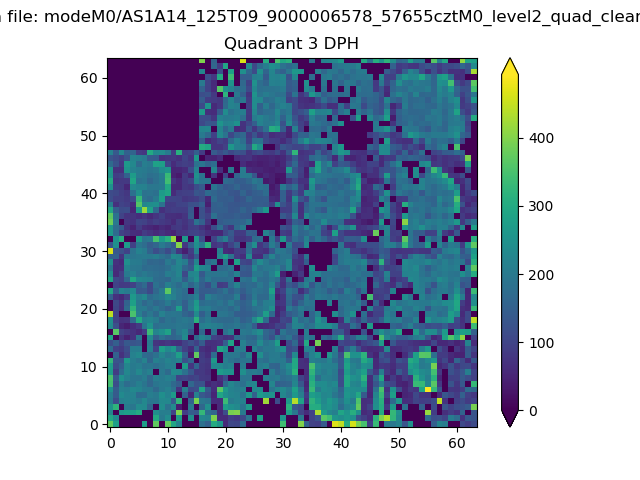 |
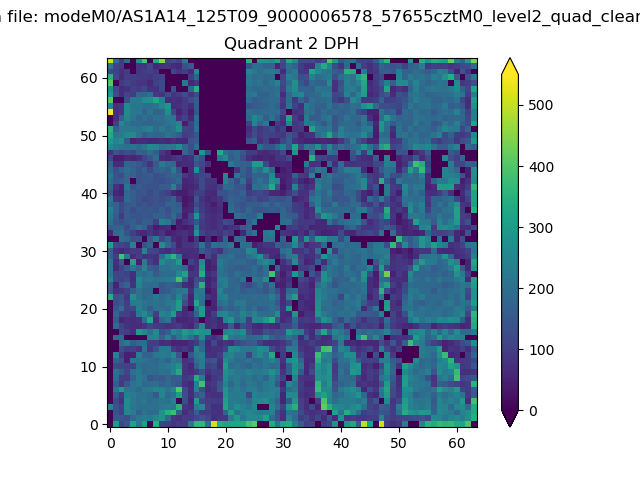 |
Quadrant C |
| Plot type | Count rate plots | Images |
|---|---|---|
| Comparison with Poisson distribution Blue bars denote a histogram of data divided into 1 sec bins. Red curve is a Poisson curve with rate = median count rate of data. |
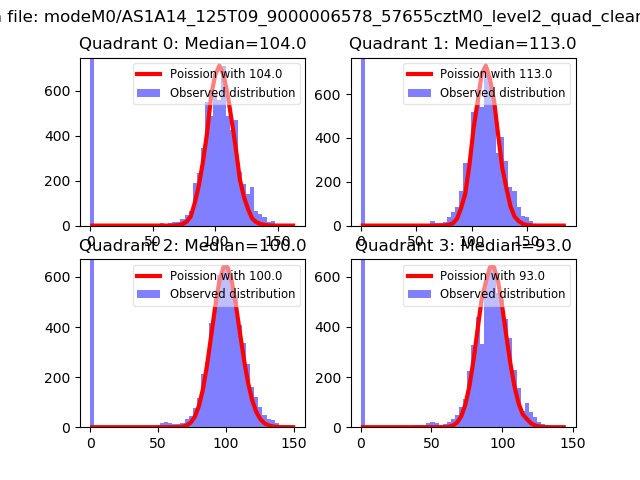 |
 |
| Quadrant-wise count rates Data is divided into 100 sec bins |
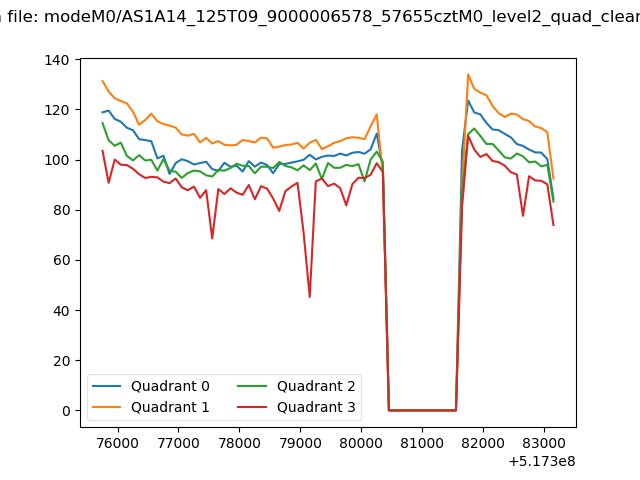 |
|
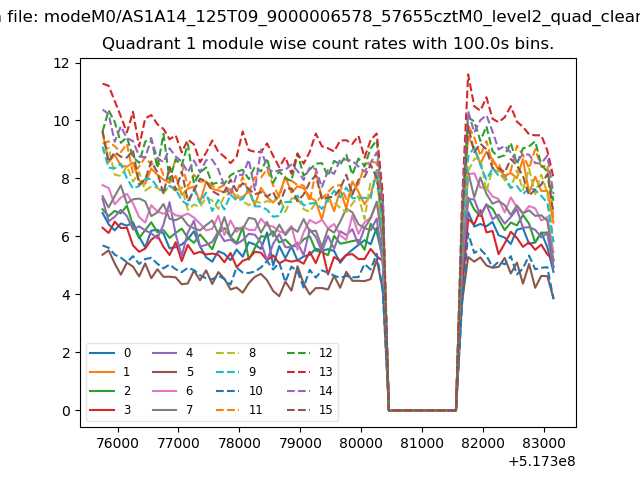
| Module-wise count rates for Quadrant A Data is divided into 100 sec bins |
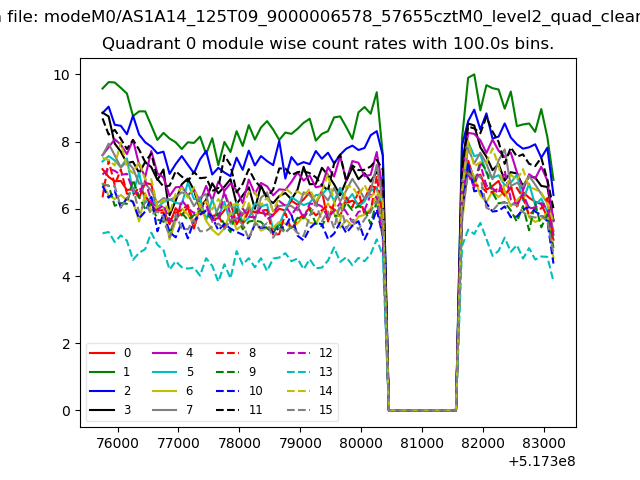 |
 |
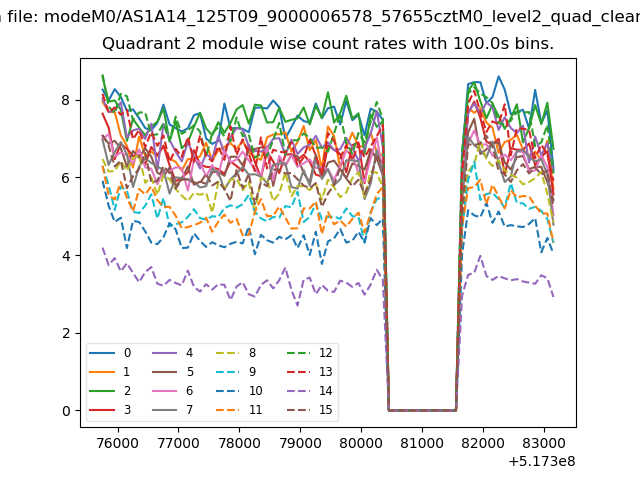
| Module-wise count rates for Quadrant B Data is divided into 100 sec bins |
 |
 |
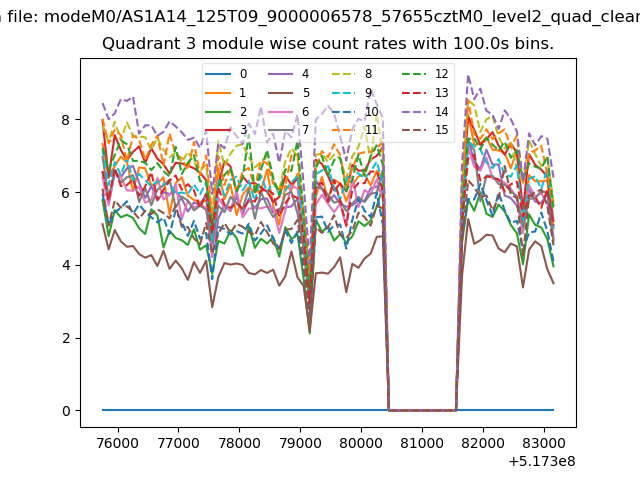
| Module-wise count rates for Quadrant C Data is divided into 100 sec bins |
 |
 |
| Module-wise count rates for Quadrant D Data is divided into 100 sec bins |
 |
 |
| Parameter | Plot |
|---|---|
| CZT HV Monitor | 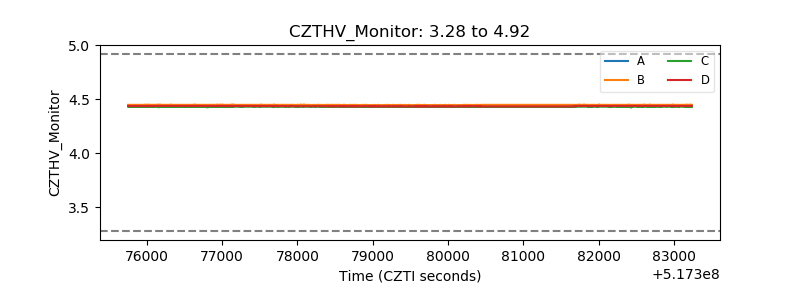 |
| D_VDD | 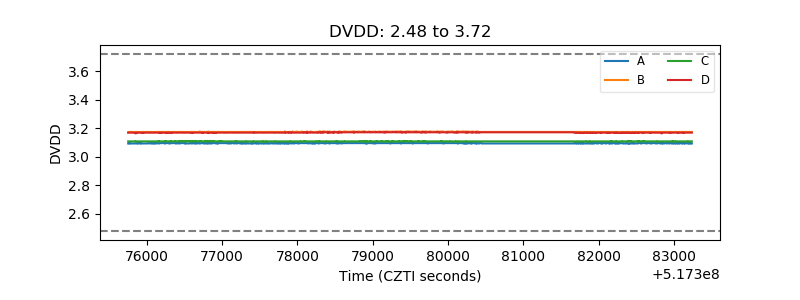 |
| Temperature 1 | 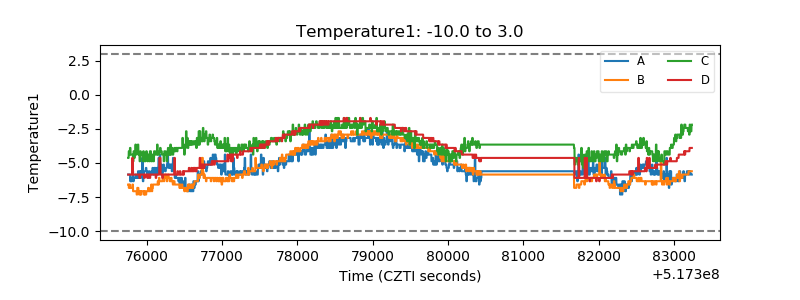 |
| Veto HV Monitor | 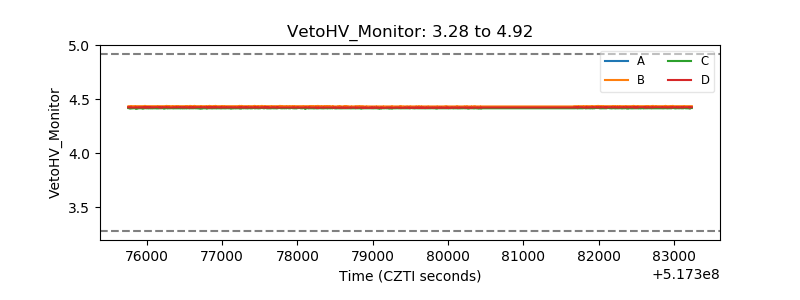 |
| Veto LLD | 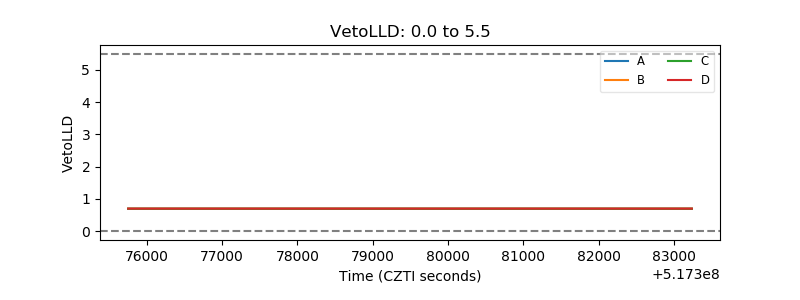 |
| Alpha Counter | 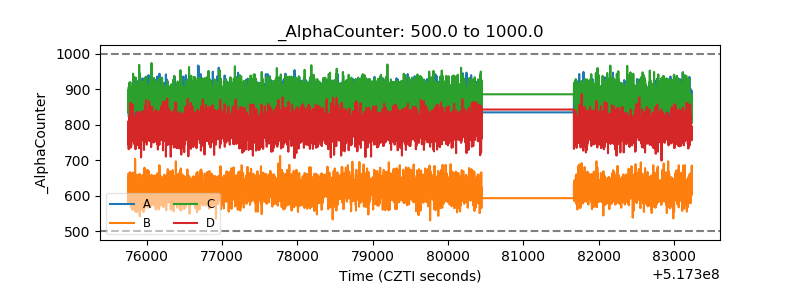 |
| _CPM_Rate | 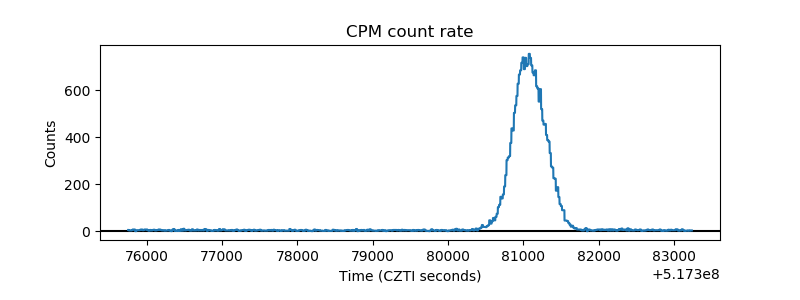 |
| CZT Counter | 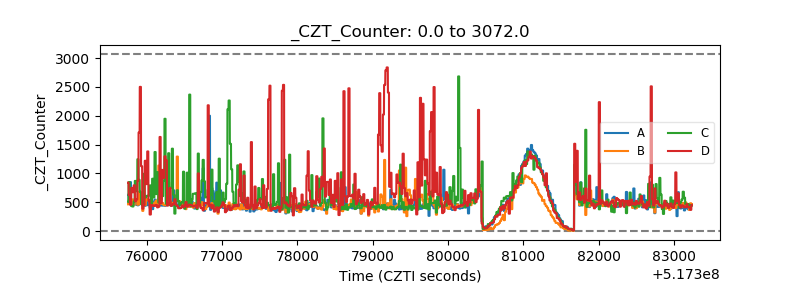 |
| +2.5 Volts monitor | 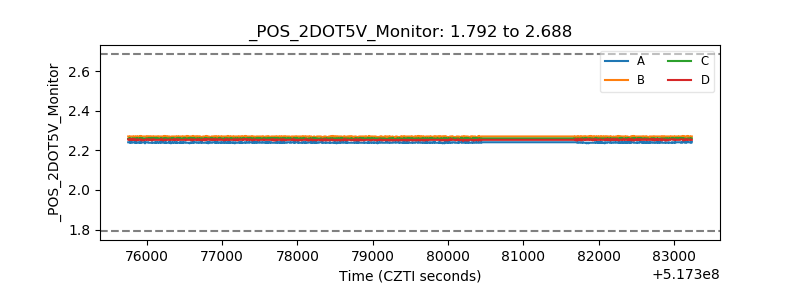 |
| +5 Volts monitor | 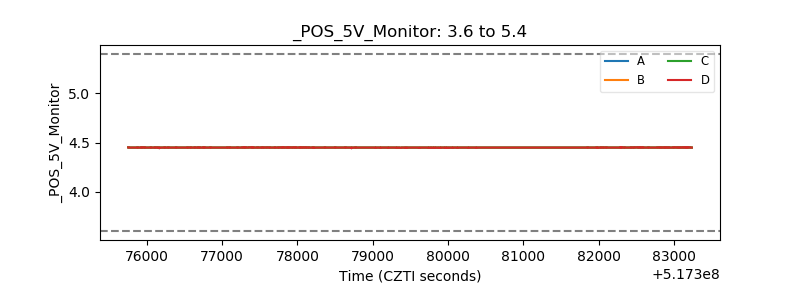 |
| _ROLL_ROT | 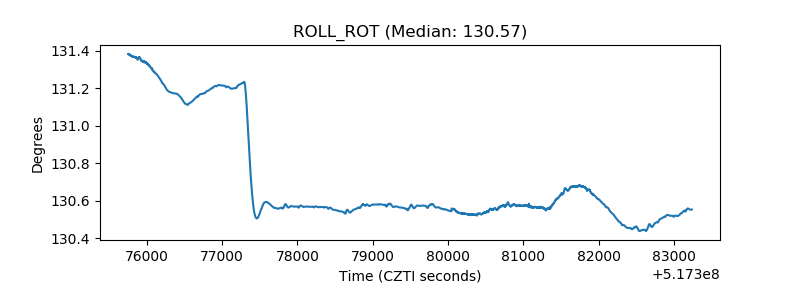 |
| _Roll_DEC | 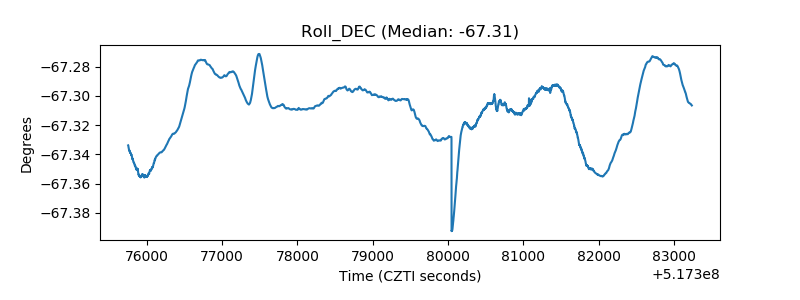 |
| _Roll_RA | 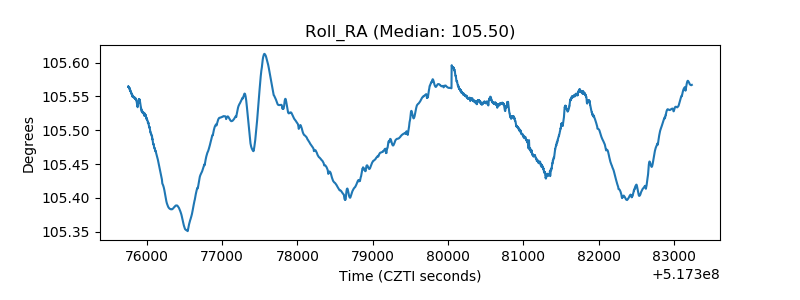 |
| Veto Counter | 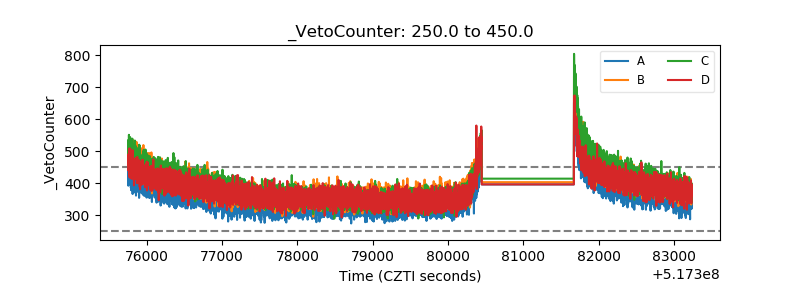 |