| Param | Original file | Final file |
|---|---|---|
| Filename | modeM0/AS1A14_125T09_9000006578_57656cztM0_level2.fits | modeM0/AS1A14_125T09_9000006578_57656cztM0_level2_quad_clean.evt |
| Size (bytes) | 355,734,720 | 91,264,320 |
| Size | 339.3 MB | 87.0 MB |
| Events in quadrant A | 2,776,684 | 600,264 |
| Events in quadrant B | 2,939,929 | 648,533 |
| Events in quadrant C | 3,595,347 | 568,864 |
| Events in quadrant D | 3,395,090 | 532,211 |
| Mode M9 | |||
|---|---|---|---|
| Quadrant | BADHDUFLAG | Total packets | Discarded packets |
| A | 0 | 12 | 0 |
| B | 0 | 12 | 0 |
| C | 0 | 12 | 0 |
| D | 0 | 12 | 0 |
| Mode SS | |||
|---|---|---|---|
| Quadrant | BADHDUFLAG | Total packets | Discarded packets |
| A | 0 | 120 | 0 |
| B | 0 | 120 | 0 |
| C | 0 | 120 | 0 |
| D | 0 | 120 | 0 |
| Mode M0 | |||
|---|---|---|---|
| Quadrant | BADHDUFLAG | Total packets | Discarded packets |
| A | 0 | 12527 | 1 |
| B | 0 | 12875 | 1 |
| C | 0 | 14763 | 1 |
| D | 0 | 14043 | 1 |
| Quadrant | Total seconds | Saturated seconds | Saturation percentage |
|---|---|---|---|
| A | 5921 | 47 | 0.793785% |
| B | 5921 | 81 | 1.368012% |
| C | 5921 | 158 | 2.668468% |
| D | 5922 | 115 | 1.941912% |
Noise dominated data is calculated using 1-second bins in cleaned event files. If a bin has >2000 counts, and if more than 50% of those come from <1% of pixels, then it is considered to be noise-dominated and hence unusable.
| Quadrant | # 1 sec bins | Bins with >0 counts | Bins with >2000 counts | High rate bins dominated by noise | Noise dominated (total time) | Noise dominated (detector-on time) | Marked lightcurve |
|---|---|---|---|---|---|---|---|
| A | 7076 | 5922 | 12 | 12 | 0.17% | 0.20% | 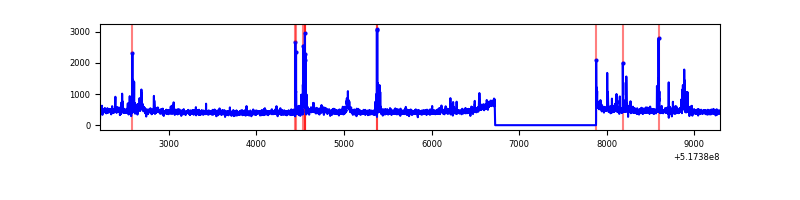 |
| B | 7076 | 5922 | 18 | 18 | 0.25% | 0.30% | 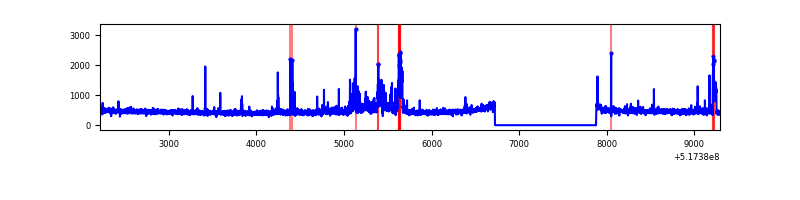 |
| C | 7076 | 5922 | 95 | 95 | 1.34% | 1.60% | 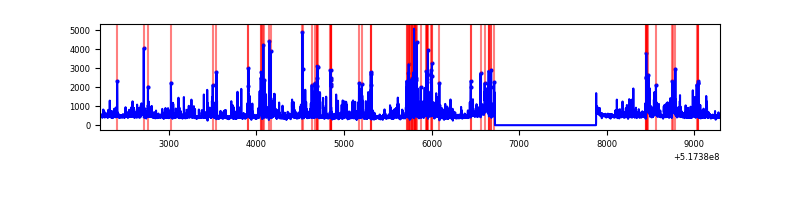 |
| D | 7077 | 5923 | 68 | 68 | 0.96% | 1.15% | 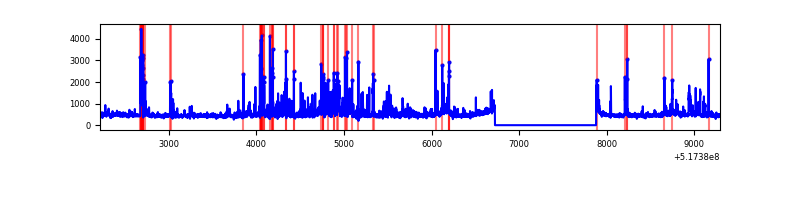 |
Top three noisy pixels from each quadrant. If the there are fewer than three noisy pixels in the level2.evt file, extra rows are filled as -1
| Pixel properties | Quadrant properties | ||||||
|---|---|---|---|---|---|---|---|
| Quadrant | DetID | PixID | Counts | Sigma | Mean | Median | Sigma |
| A | 7 | 223 | 163025 | 1009.55 | 657 | 642 | 160.8 |
| A | 4 | 3 | 51407 | 315.61 | 657 | 642 | 160.8 |
| A | 13 | 248 | 9776 | 56.79 | 657 | 642 | 160.8 |
| B | 5 | 185 | 243458 | 1764.99 | 651 | 626 | 137.6 |
| B | 5 | 172 | 62947 | 452.97 | 651 | 626 | 137.6 |
| B | 10 | 247 | 30092 | 214.17 | 651 | 626 | 137.6 |
| C | 15 | 224 | 848000 | 4886.67 | 639 | 634 | 173.4 |
| C | 6 | 223 | 165830 | 952.67 | 639 | 634 | 173.4 |
| C | 14 | 254 | 31153 | 176.0 | 639 | 634 | 173.4 |
| D | 8 | 240 | 311286 | 1732.25 | 637 | 609 | 179.3 |
| D | 2 | 120 | 121708 | 675.22 | 637 | 609 | 179.3 |
| D | 11 | 224 | 120525 | 668.62 | 637 | 609 | 179.3 |
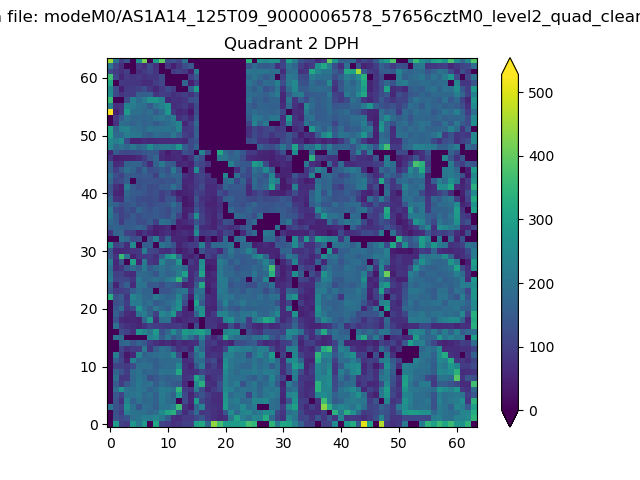
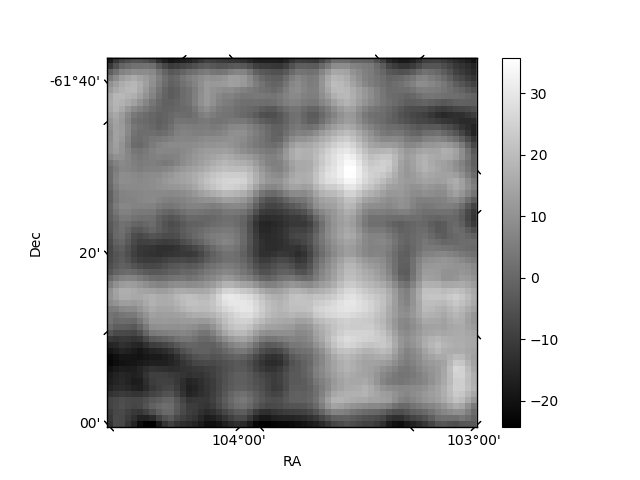
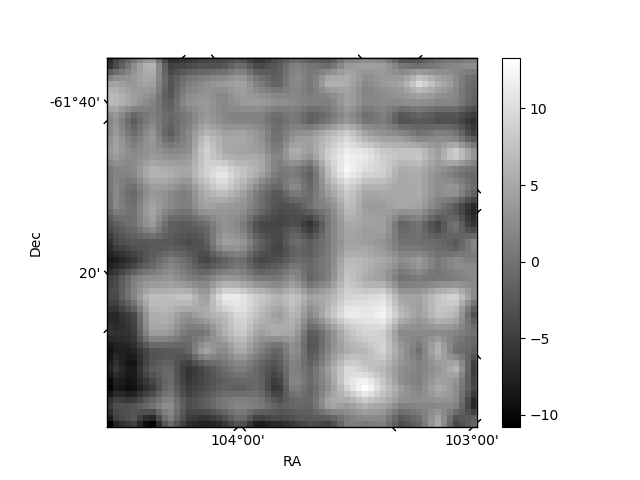
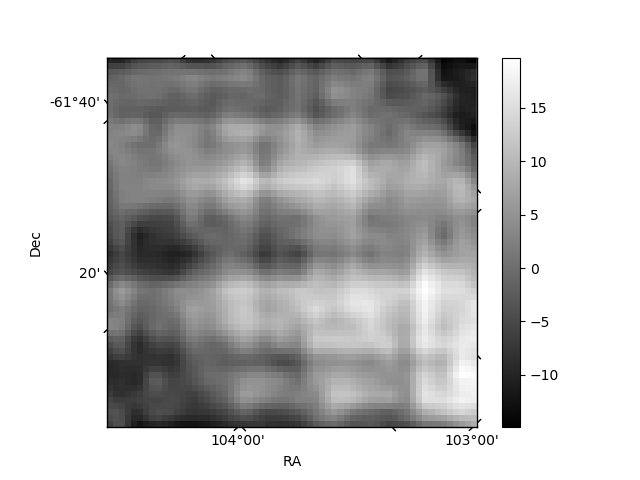
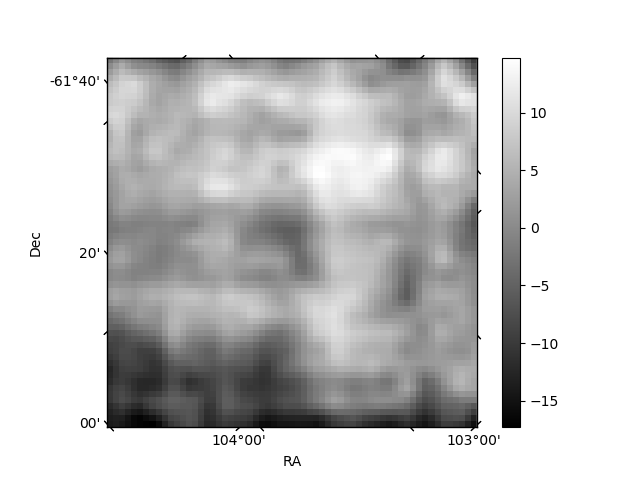
Histogram calculated using DETX and DETY for each event in the final _common_clean file
| Quadrant A | 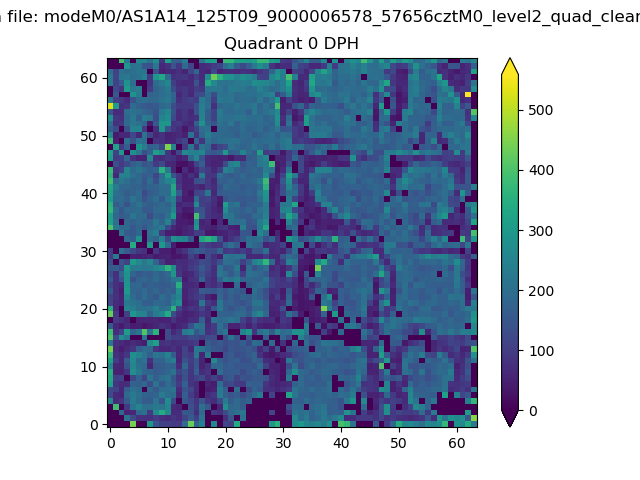 |
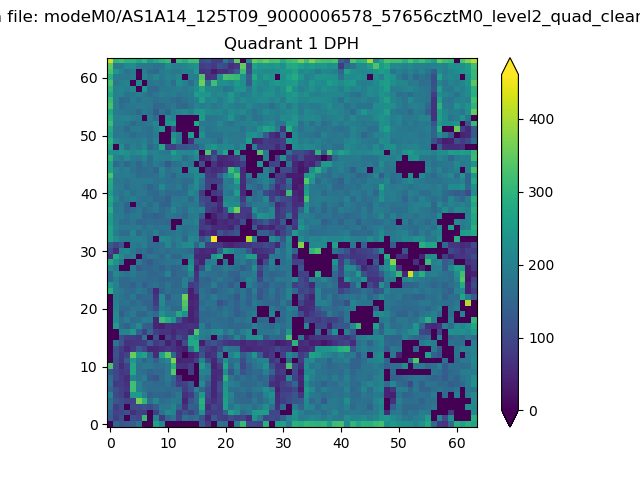 |
Quadrant B |
|---|---|---|---|
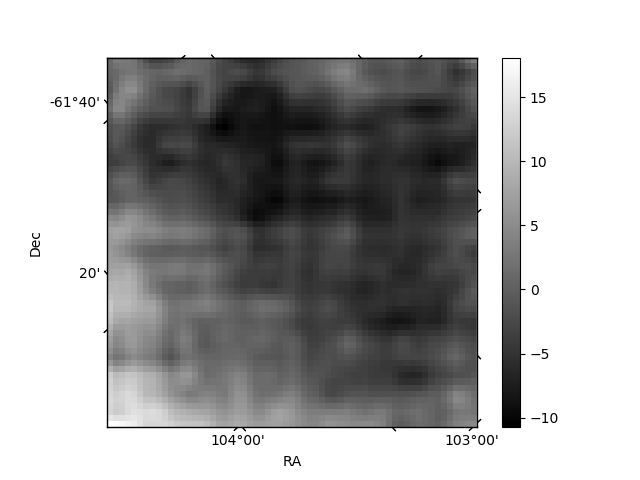
| Quadrant D | 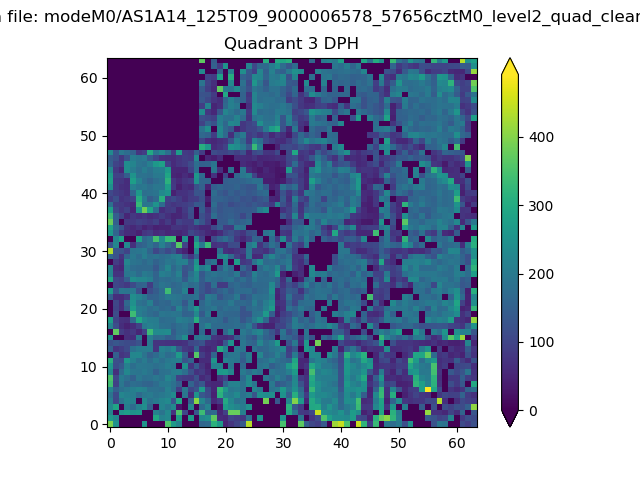 |
 |
Quadrant C |
| Plot type | Count rate plots | Images |
|---|---|---|
| Comparison with Poisson distribution Blue bars denote a histogram of data divided into 1 sec bins. Red curve is a Poisson curve with rate = median count rate of data. |
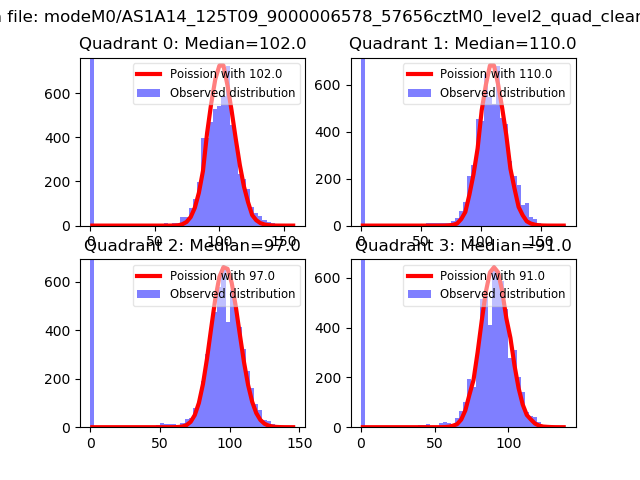 |
 |
| Quadrant-wise count rates Data is divided into 100 sec bins |
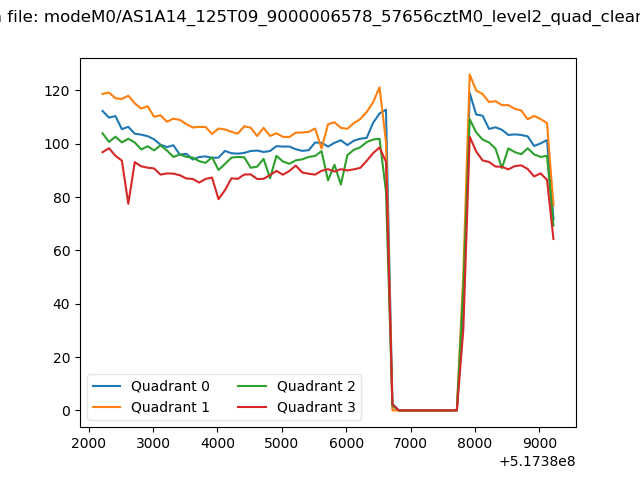 |
|
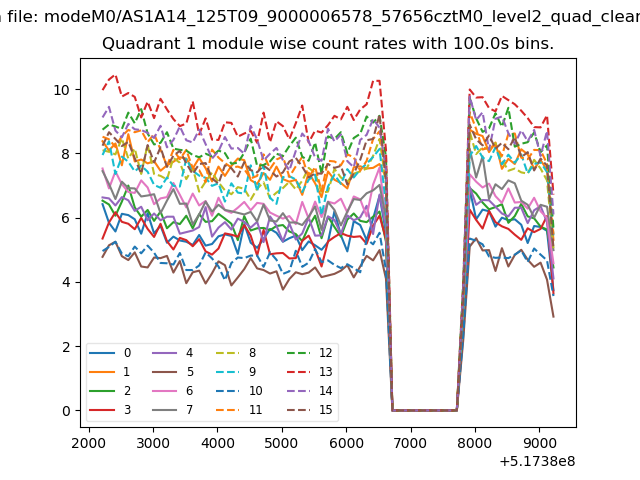
| Module-wise count rates for Quadrant A Data is divided into 100 sec bins |
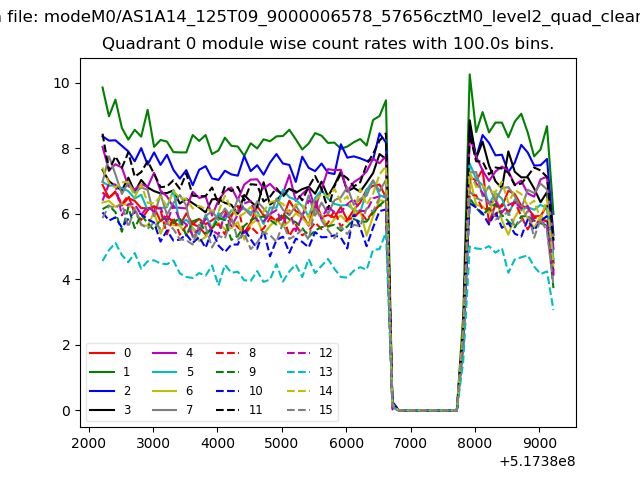 |
 |
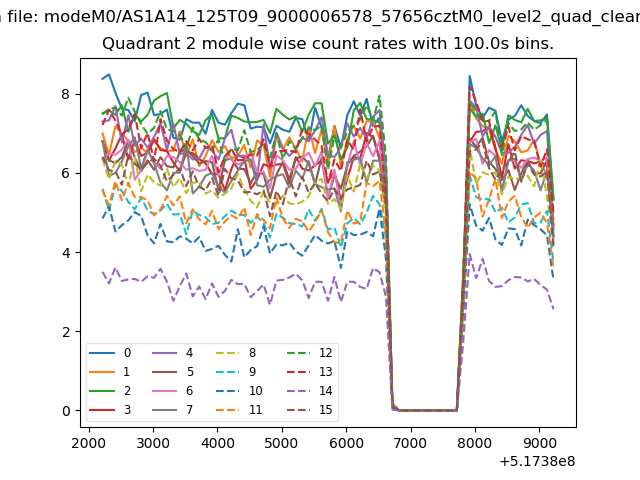
| Module-wise count rates for Quadrant B Data is divided into 100 sec bins |
 |
 |
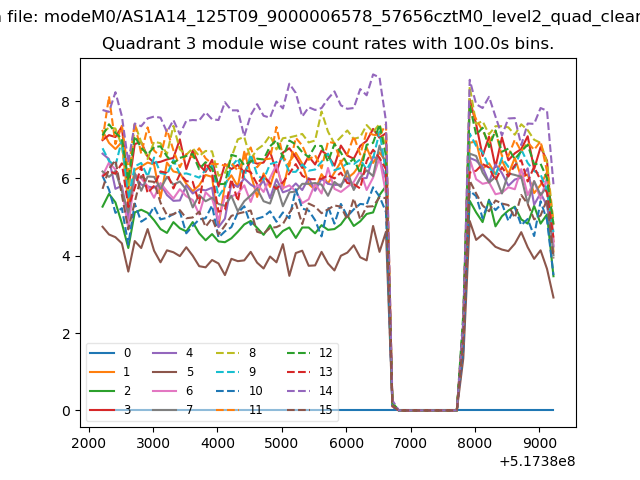
| Module-wise count rates for Quadrant C Data is divided into 100 sec bins |
 |
 |
| Module-wise count rates for Quadrant D Data is divided into 100 sec bins |
 |
 |
| Parameter | Plot |
|---|---|
| CZT HV Monitor | 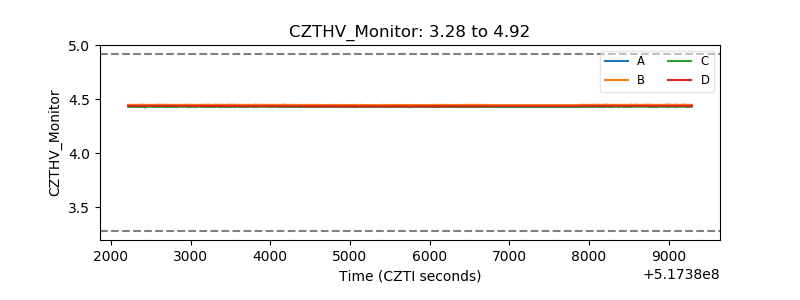 |
| D_VDD | 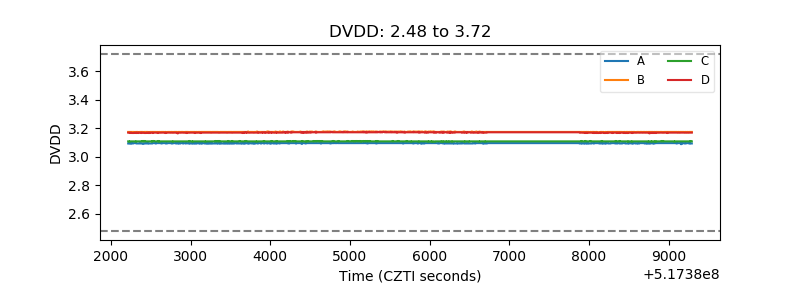 |
| Temperature 1 | 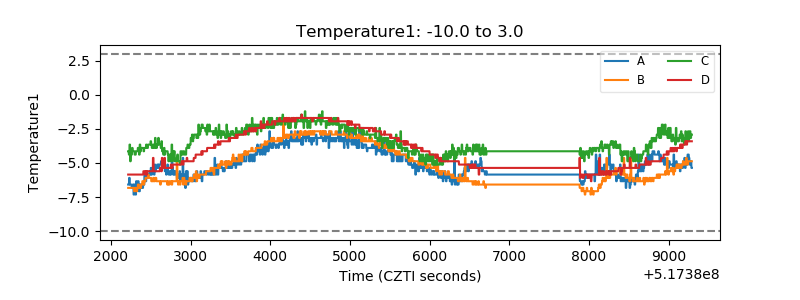 |
| Veto HV Monitor | 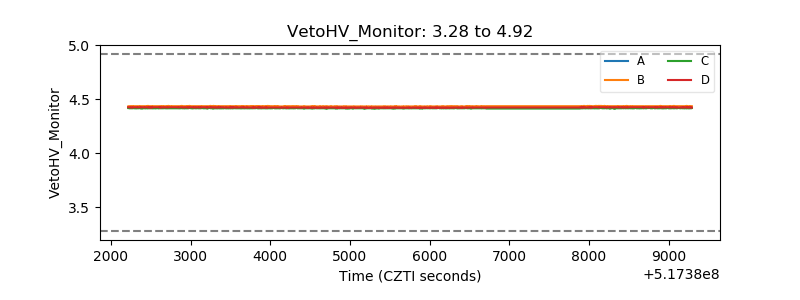 |
| Veto LLD | 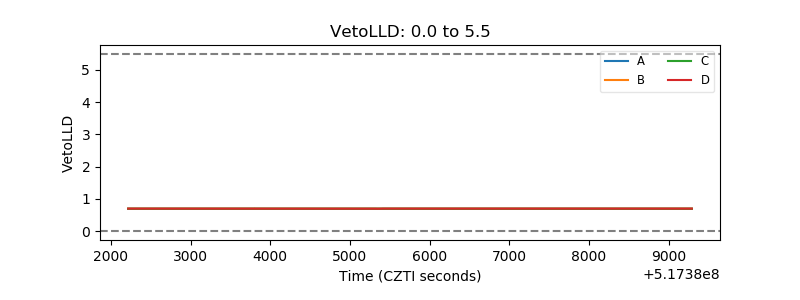 |
| Alpha Counter | 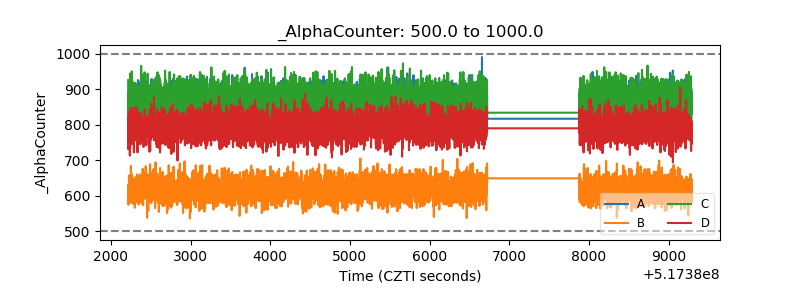 |
| _CPM_Rate | 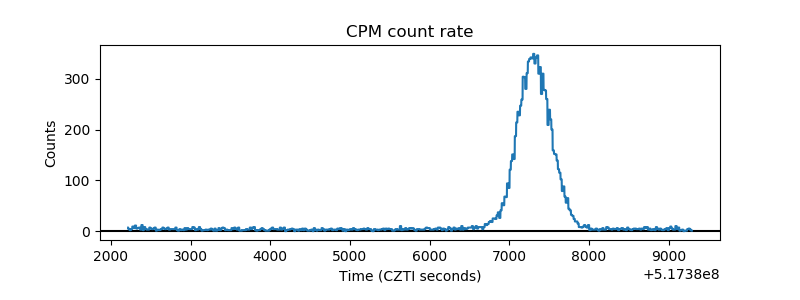 |
| CZT Counter | 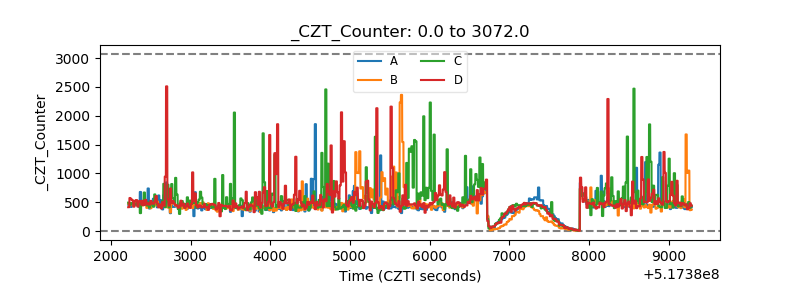 |
| +2.5 Volts monitor | 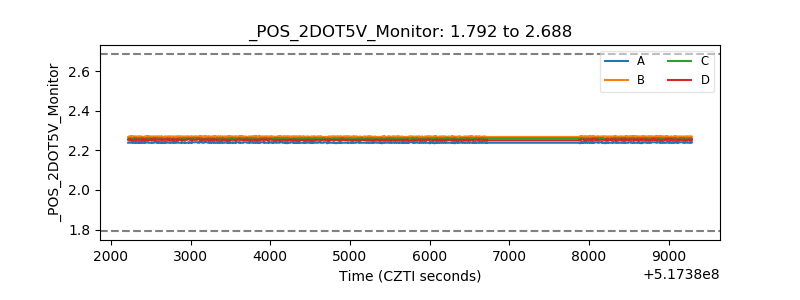 |
| +5 Volts monitor |  |
| _ROLL_ROT | 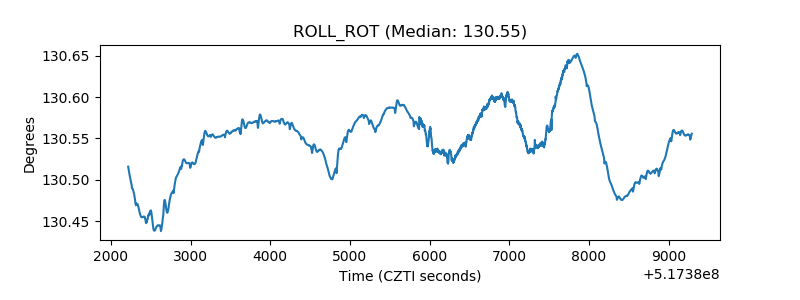 |
| _Roll_DEC | 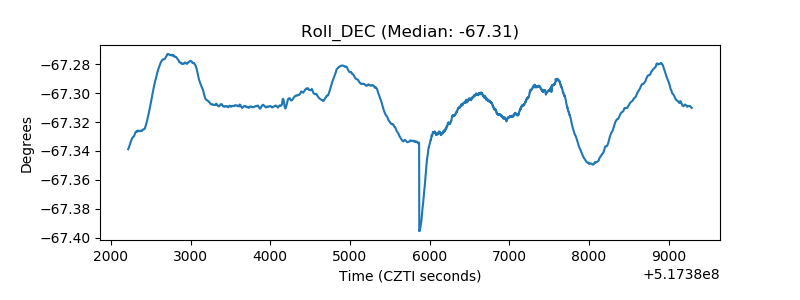 |
| _Roll_RA | 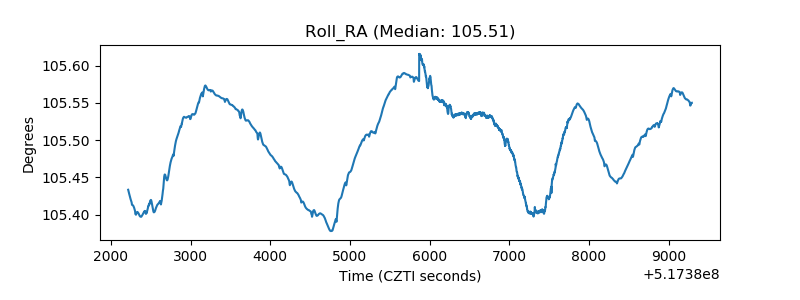 |
| Veto Counter | 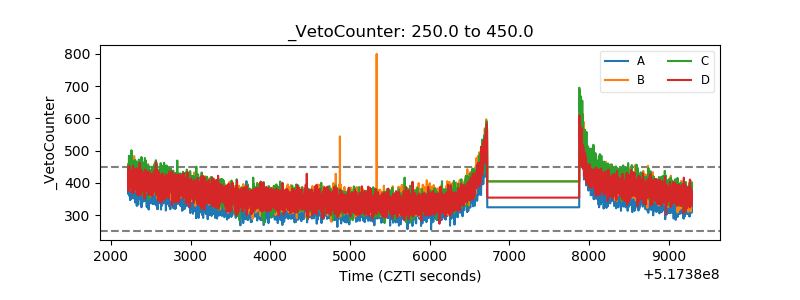 |