| Param | Original file | Final file |
|---|---|---|
| Filename | modeM0/AS1A14_125T09_9000006578_57657cztM0_level2.fits | modeM0/AS1A14_125T09_9000006578_57657cztM0_level2_quad_clean.evt |
| Size (bytes) | 439,672,320 | 100,730,880 |
| Size | 419.3 MB | 96.1 MB |
| Events in quadrant A | 3,347,177 | 667,888 |
| Events in quadrant B | 3,219,475 | 716,727 |
| Events in quadrant C | 4,070,308 | 637,787 |
| Events in quadrant D | 5,112,492 | 557,051 |
| Mode M9 | |||
|---|---|---|---|
| Quadrant | BADHDUFLAG | Total packets | Discarded packets |
| A | 0 | 13 | 0 |
| B | 0 | 14 | 0 |
| C | 0 | 14 | 0 |
| D | 0 | 14 | 0 |
| Mode SS | |||
|---|---|---|---|
| Quadrant | BADHDUFLAG | Total packets | Discarded packets |
| A | 0 | 136 | 0 |
| B | 0 | 136 | 0 |
| C | 0 | 136 | 0 |
| D | 0 | 136 | 0 |
| Mode M0 | |||
|---|---|---|---|
| Quadrant | BADHDUFLAG | Total packets | Discarded packets |
| A | 0 | 14860 | 2 |
| B | 0 | 14323 | 2 |
| C | 0 | 16893 | 2 |
| D | 0 | 19860 | 2 |
| Quadrant | Total seconds | Saturated seconds | Saturation percentage |
|---|---|---|---|
| A | 6761 | 104 | 1.538234% |
| B | 6760 | 116 | 1.715976% |
| C | 6760 | 157 | 2.322485% |
| D | 6760 | 596 | 8.816568% |
Noise dominated data is calculated using 1-second bins in cleaned event files. If a bin has >2000 counts, and if more than 50% of those come from <1% of pixels, then it is considered to be noise-dominated and hence unusable.
| Quadrant | # 1 sec bins | Bins with >0 counts | Bins with >2000 counts | High rate bins dominated by noise | Noise dominated (total time) | Noise dominated (detector-on time) | Marked lightcurve |
|---|---|---|---|---|---|---|---|
| A | 7696 | 6762 | 36 | 36 | 0.47% | 0.53% | 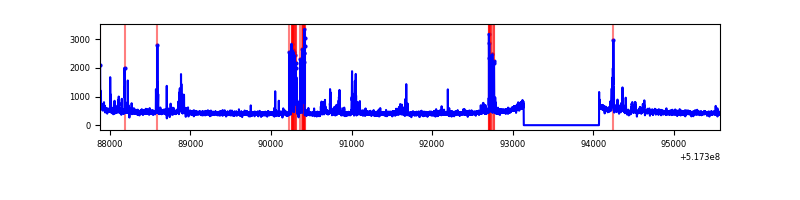 |
| B | 7695 | 6761 | 23 | 23 | 0.30% | 0.34% | 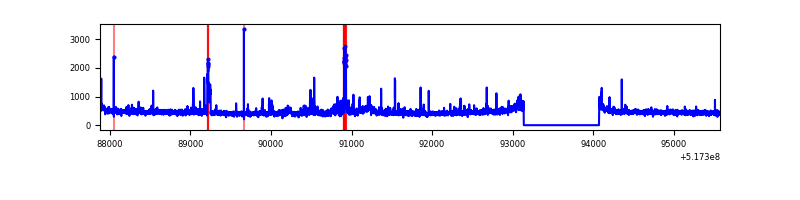 |
| C | 7695 | 6761 | 74 | 74 | 0.96% | 1.09% | 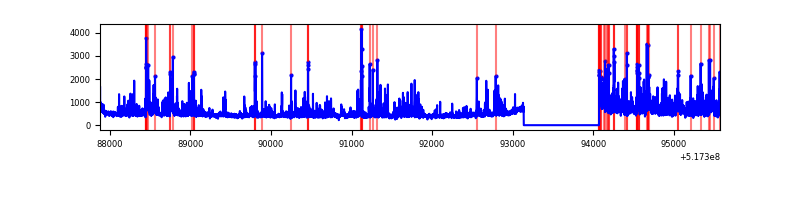 |
| D | 7695 | 6761 | 492 | 492 | 6.39% | 7.28% | 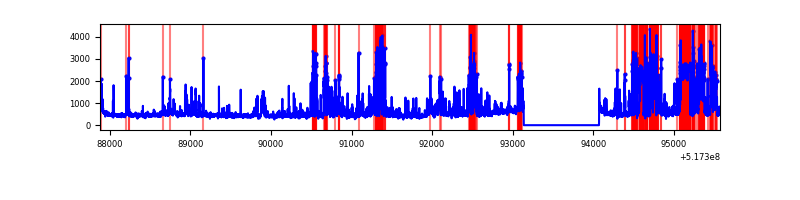 |
Top three noisy pixels from each quadrant. If the there are fewer than three noisy pixels in the level2.evt file, extra rows are filled as -1
| Pixel properties | Quadrant properties | ||||||
|---|---|---|---|---|---|---|---|
| Quadrant | DetID | PixID | Counts | Sigma | Mean | Median | Sigma |
| A | 7 | 223 | 322014 | 1762.2 | 748 | 730 | 182.3 |
| A | 4 | 3 | 124884 | 680.97 | 748 | 730 | 182.3 |
| A | 13 | 254 | 9687 | 49.13 | 748 | 730 | 182.3 |
| B | 5 | 185 | 146978 | 929.44 | 738 | 709 | 157.4 |
| B | 5 | 172 | 68916 | 433.41 | 738 | 709 | 157.4 |
| B | 0 | 171 | 20004 | 122.61 | 738 | 709 | 157.4 |
| C | 15 | 224 | 807910 | 4104.28 | 725 | 721 | 196.7 |
| C | 12 | 254 | 260754 | 1322.18 | 725 | 721 | 196.7 |
| C | 12 | 2 | 85129 | 429.19 | 725 | 721 | 196.7 |
| D | 8 | 240 | 1242799 | 6393.12 | 695 | 665 | 194.3 |
| D | 3 | 12 | 257406 | 1321.42 | 695 | 665 | 194.3 |
| D | 7 | 253 | 197391 | 1012.53 | 695 | 665 | 194.3 |
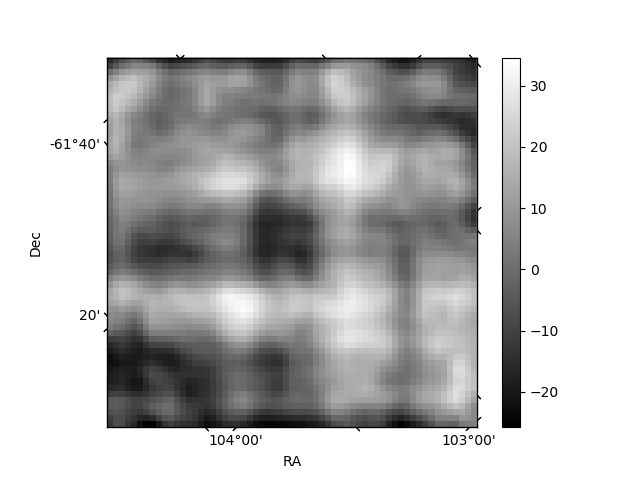
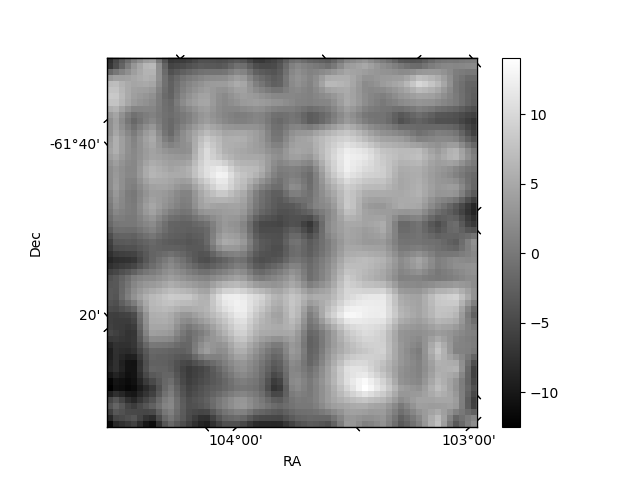
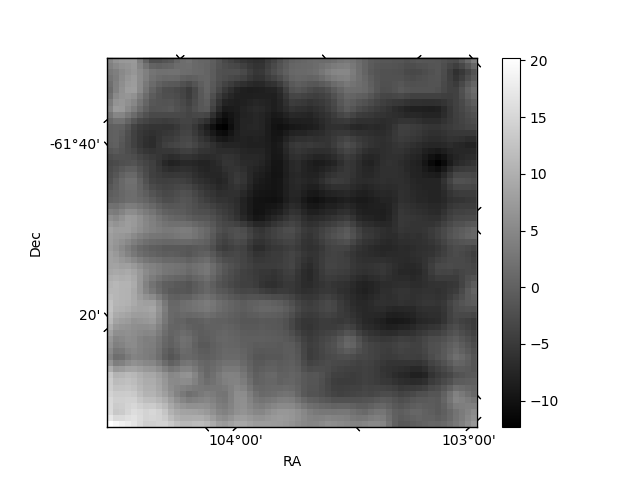
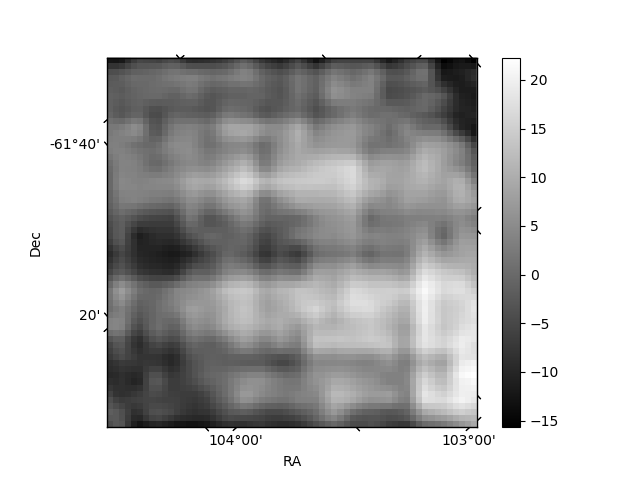
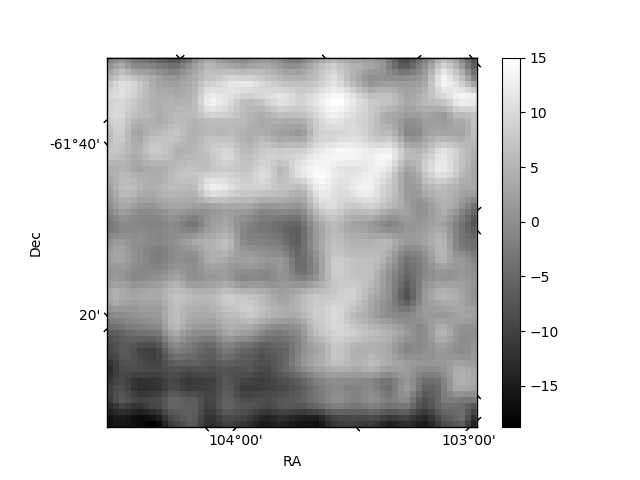
Histogram calculated using DETX and DETY for each event in the final _common_clean file
| Quadrant A | 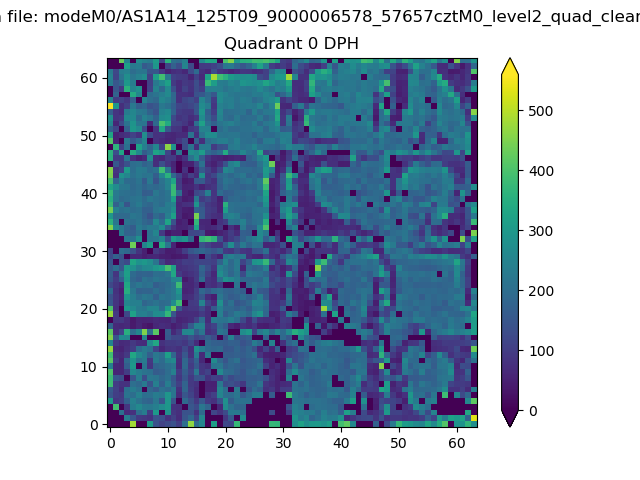 |
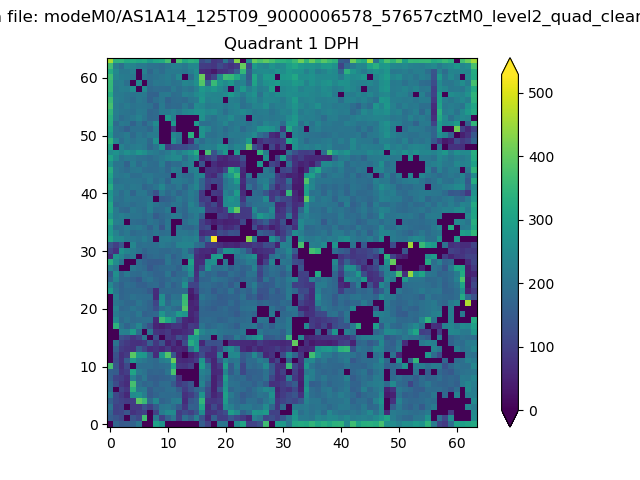 |
Quadrant B |
|---|---|---|---|
| Quadrant D | 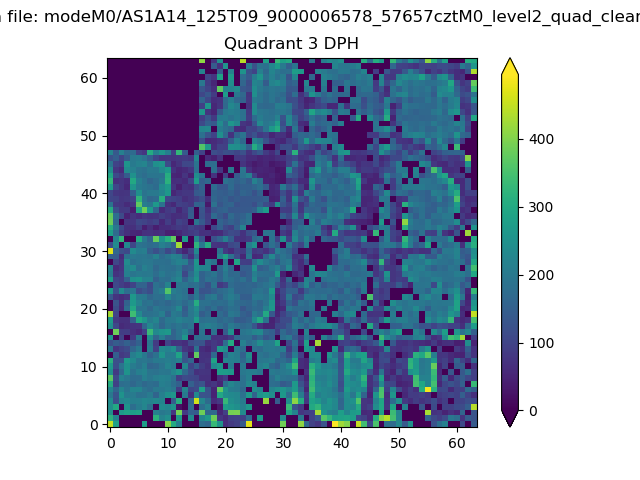 |
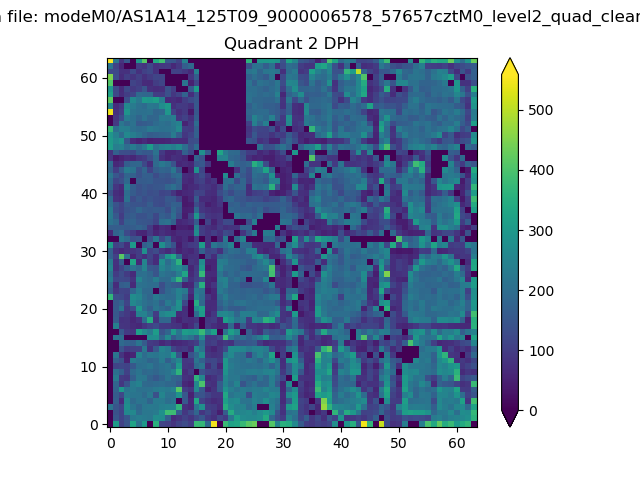 |
Quadrant C |
| Plot type | Count rate plots | Images |
|---|---|---|
| Comparison with Poisson distribution Blue bars denote a histogram of data divided into 1 sec bins. Red curve is a Poisson curve with rate = median count rate of data. |
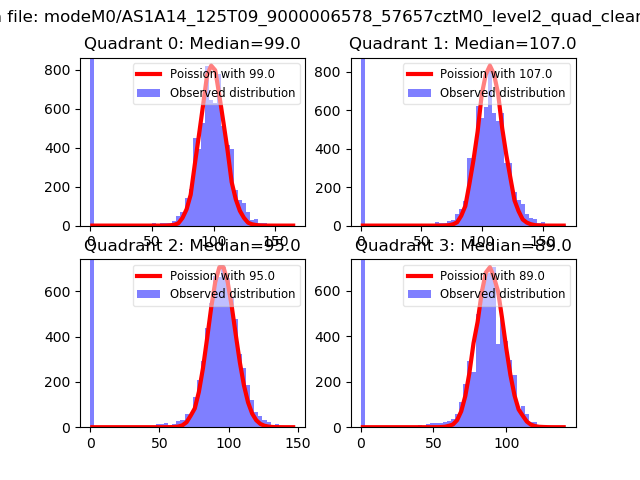 |
 |
| Quadrant-wise count rates Data is divided into 100 sec bins |
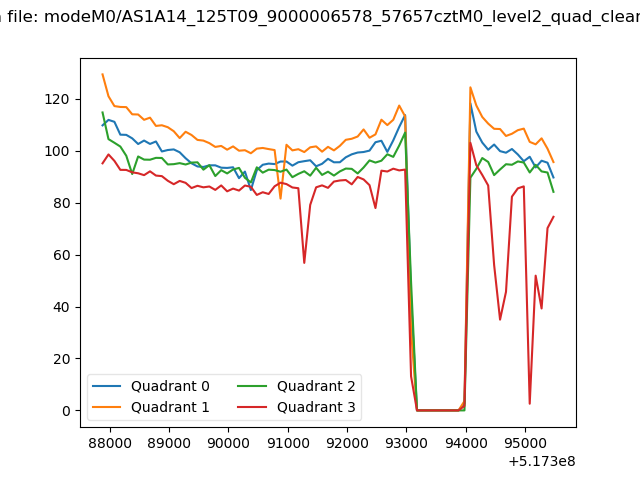 |
|
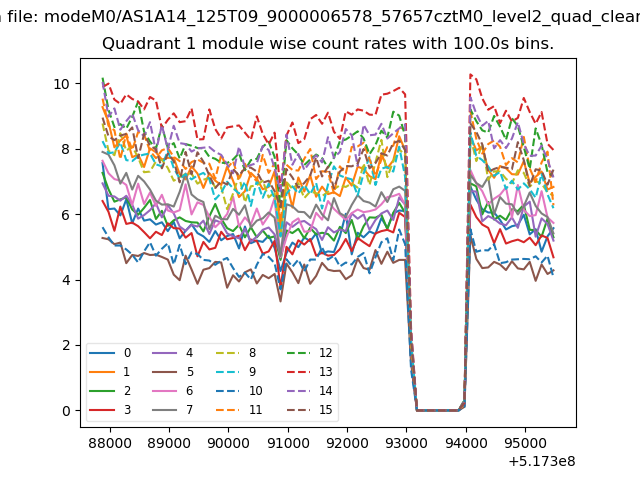
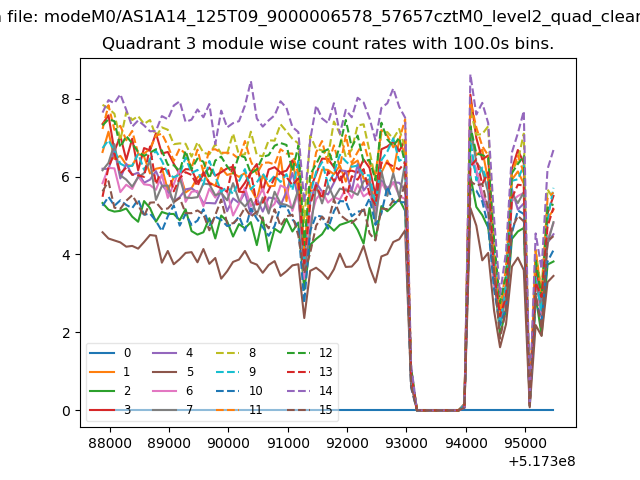
| Module-wise count rates for Quadrant A Data is divided into 100 sec bins |
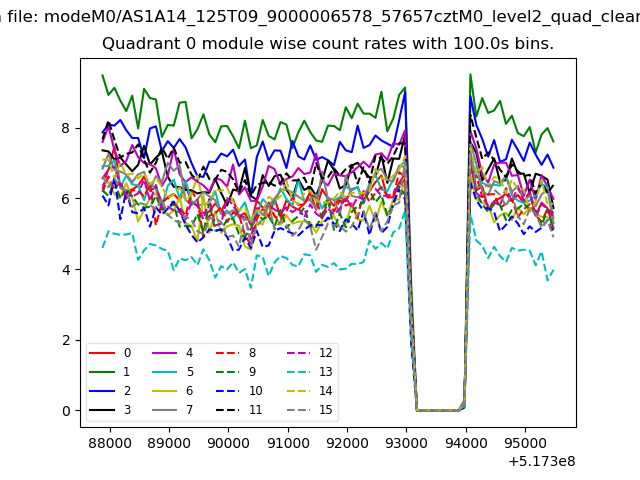 |
 |
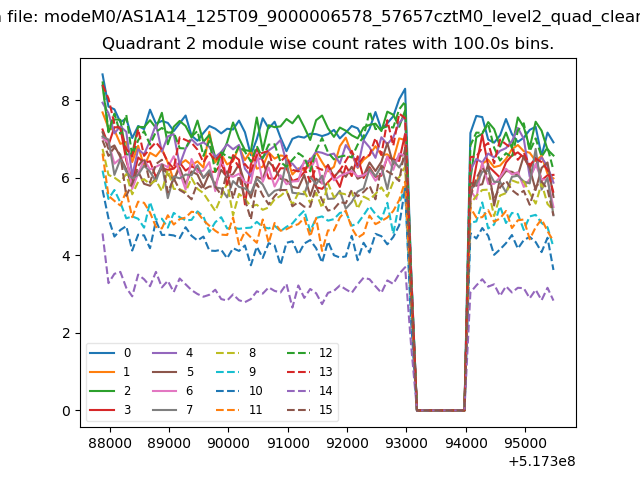
| Module-wise count rates for Quadrant B Data is divided into 100 sec bins |
 |
 |
| Module-wise count rates for Quadrant C Data is divided into 100 sec bins |
 |
 |
| Module-wise count rates for Quadrant D Data is divided into 100 sec bins |
 |
 |
| Parameter | Plot |
|---|---|
| CZT HV Monitor | 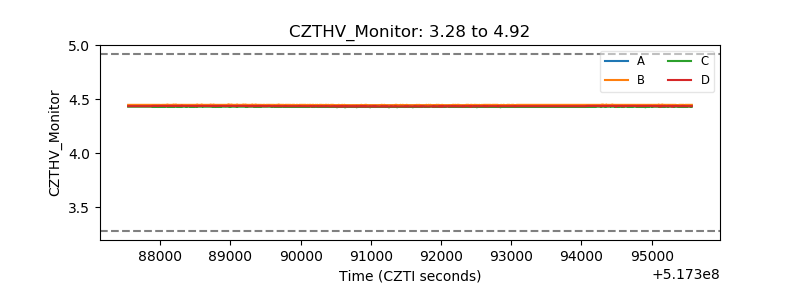 |
| D_VDD | 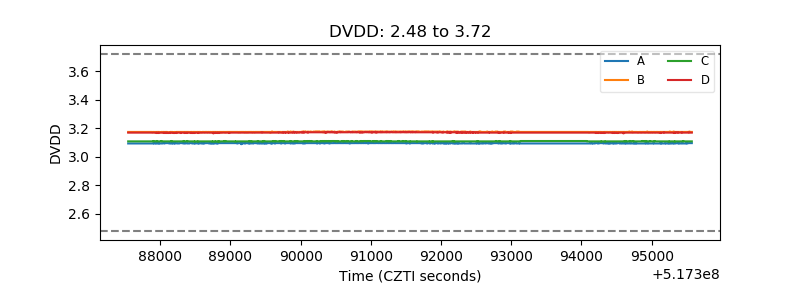 |
| Temperature 1 | 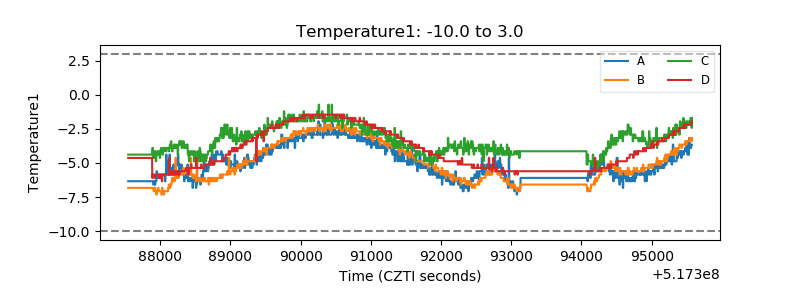 |
| Veto HV Monitor | 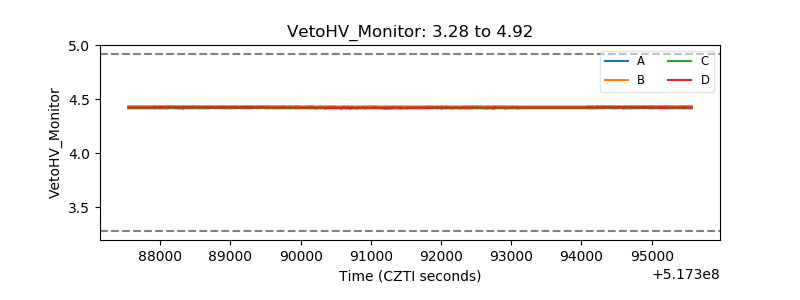 |
| Veto LLD | 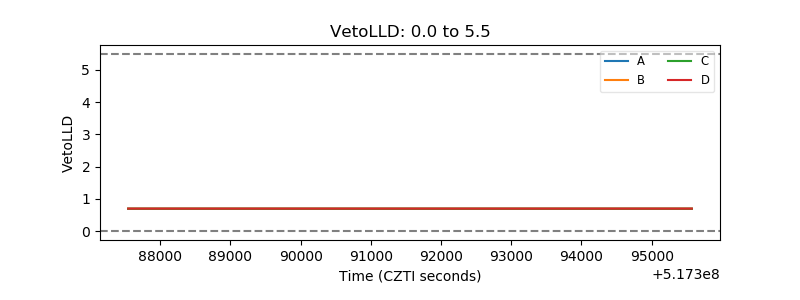 |
| Alpha Counter | 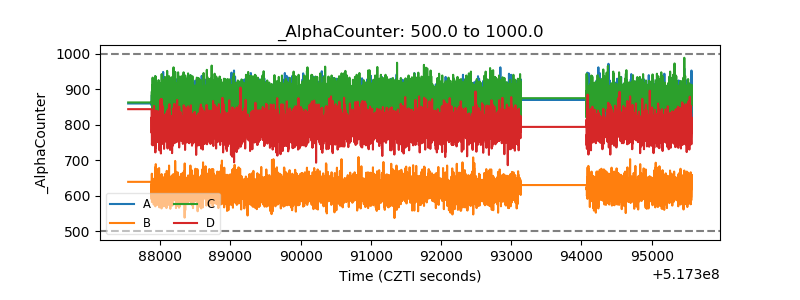 |
| _CPM_Rate | 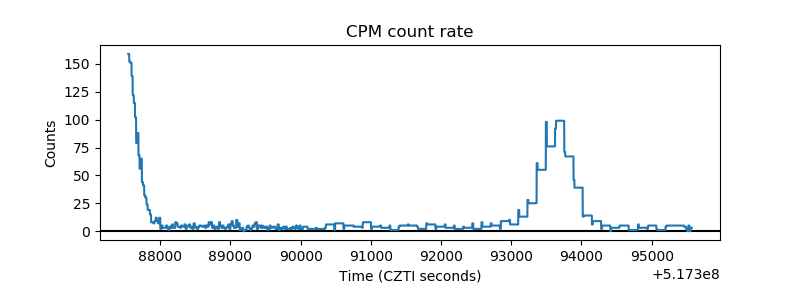 |
| CZT Counter | 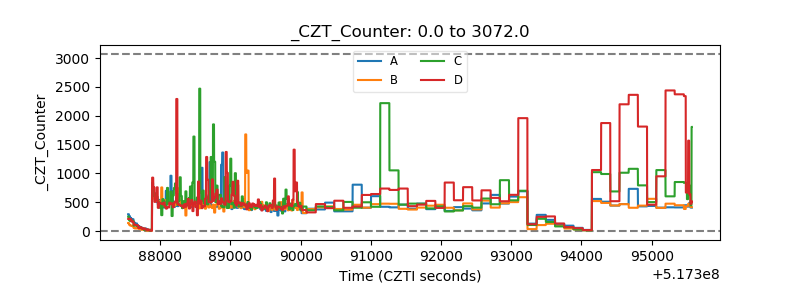 |
| +2.5 Volts monitor | 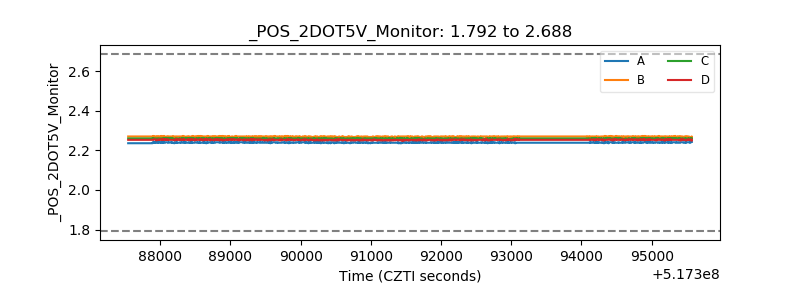 |
| +5 Volts monitor |  |
| _ROLL_ROT | 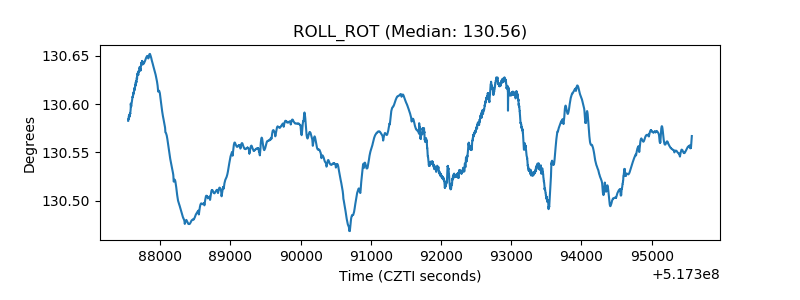 |
| _Roll_DEC | 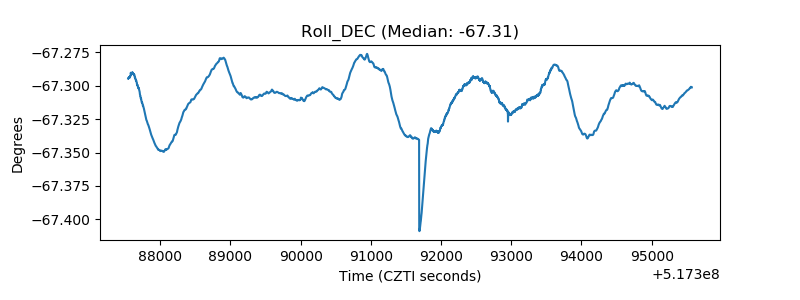 |
| _Roll_RA | 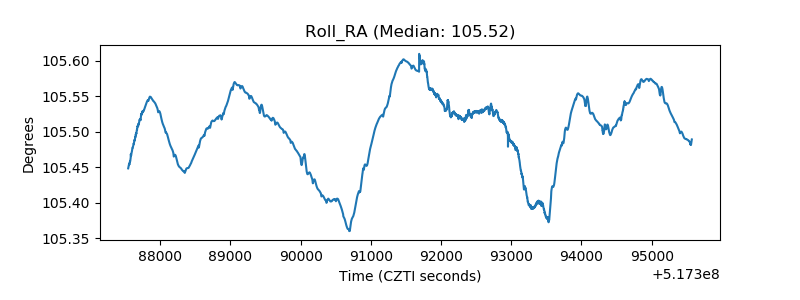 |
| Veto Counter | 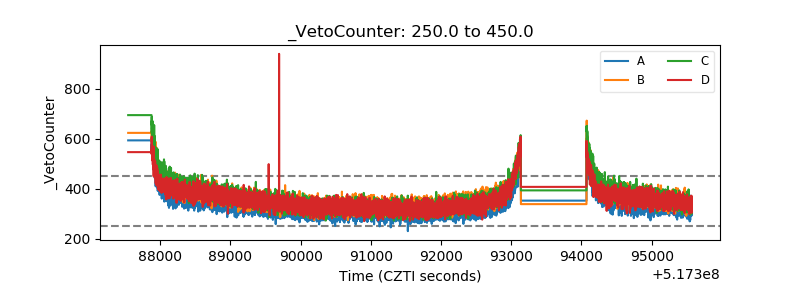 |