| Param | Original file | Final file |
|---|---|---|
| Filename | modeM0/AS1A14_125T09_9000006578_57659cztM0_level2.fits | modeM0/AS1A14_125T09_9000006578_57659cztM0_level2_quad_clean.evt |
| Size (bytes) | 436,705,920 | 104,996,160 |
| Size | 416.5 MB | 100.1 MB |
| Events in quadrant A | 3,053,657 | 689,599 |
| Events in quadrant B | 3,215,031 | 741,880 |
| Events in quadrant C | 4,217,197 | 656,552 |
| Events in quadrant D | 5,119,564 | 589,954 |
| Mode SS | |||
|---|---|---|---|
| Quadrant | BADHDUFLAG | Total packets | Discarded packets |
| A | 0 | 144 | 0 |
| B | 0 | 144 | 0 |
| C | 0 | 144 | 0 |
| D | 0 | 144 | 0 |
| Mode M0 | |||
|---|---|---|---|
| Quadrant | BADHDUFLAG | Total packets | Discarded packets |
| A | 0 | 14546 | 0 |
| B | 0 | 14812 | 1 |
| C | 0 | 17728 | 0 |
| D | 0 | 20087 | 0 |
| Quadrant | Total seconds | Saturated seconds | Saturation percentage |
|---|---|---|---|
| A | 7199 | 9 | 0.125017% |
| B | 7199 | 21 | 0.291707% |
| C | 7199 | 121 | 1.680789% |
| D | 7199 | 424 | 5.889707% |
Noise dominated data is calculated using 1-second bins in cleaned event files. If a bin has >2000 counts, and if more than 50% of those come from <1% of pixels, then it is considered to be noise-dominated and hence unusable.
| Quadrant | # 1 sec bins | Bins with >0 counts | Bins with >2000 counts | High rate bins dominated by noise | Noise dominated (total time) | Noise dominated (detector-on time) | Marked lightcurve |
|---|---|---|---|---|---|---|---|
| A | 7199 | 7199 | 0 | 0 | 0.00% | 0.00% | 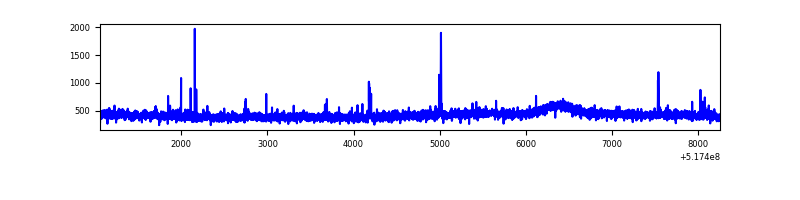 |
| B | 7199 | 7199 | 9 | 9 | 0.13% | 0.13% | 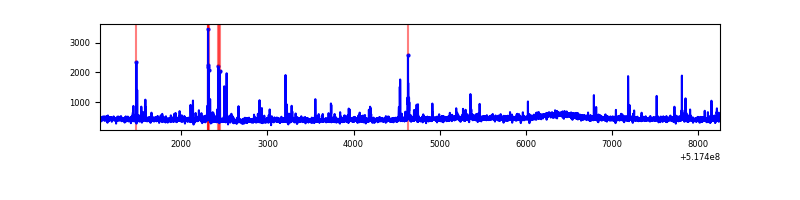 |
| C | 7199 | 7199 | 93 | 93 | 1.29% | 1.29% | 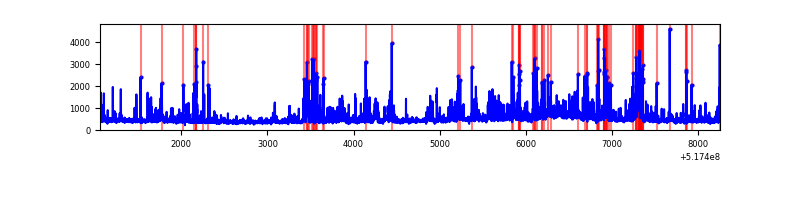 |
| D | 7199 | 7199 | 380 | 380 | 5.28% | 5.28% | 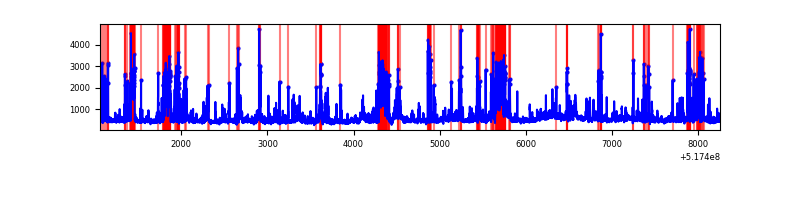 |
Top three noisy pixels from each quadrant. If the there are fewer than three noisy pixels in the level2.evt file, extra rows are filled as -1
| Pixel properties | Quadrant properties | ||||||
|---|---|---|---|---|---|---|---|
| Quadrant | DetID | PixID | Counts | Sigma | Mean | Median | Sigma |
| A | 7 | 223 | 22551 | 114.49 | 776 | 755 | 190.4 |
| A | 13 | 248 | 20544 | 103.94 | 776 | 755 | 190.4 |
| A | 3 | 137 | 9568 | 46.29 | 776 | 755 | 190.4 |
| B | 10 | 247 | 48934 | 295.2 | 767 | 739 | 163.3 |
| B | 12 | 111 | 20075 | 118.44 | 767 | 739 | 163.3 |
| B | 11 | 111 | 19079 | 112.34 | 767 | 739 | 163.3 |
| C | 15 | 224 | 795970 | 3925.05 | 748 | 741 | 202.6 |
| C | 12 | 254 | 141493 | 694.72 | 748 | 741 | 202.6 |
| C | 8 | 7 | 125959 | 618.04 | 748 | 741 | 202.6 |
| D | 8 | 240 | 635647 | 3057.06 | 735 | 701 | 207.7 |
| D | 3 | 12 | 320762 | 1540.99 | 735 | 701 | 207.7 |
| D | 2 | 249 | 285098 | 1369.28 | 735 | 701 | 207.7 |
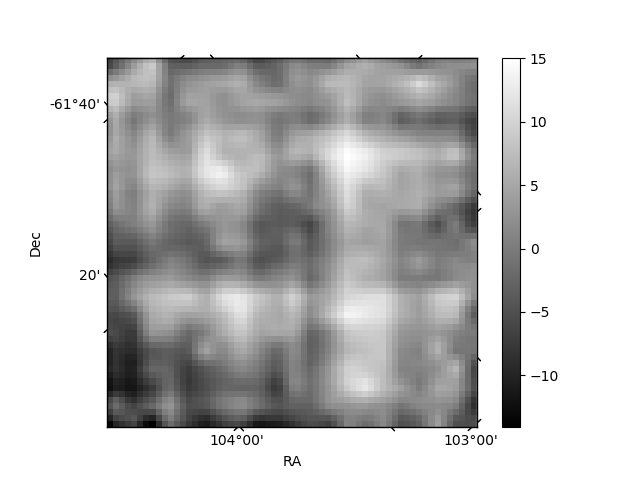
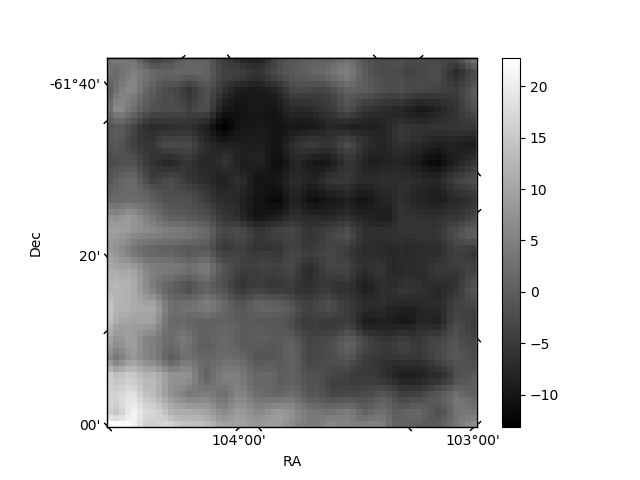
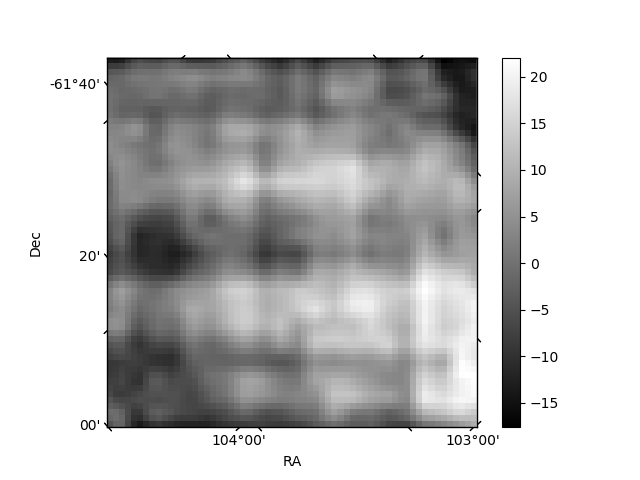
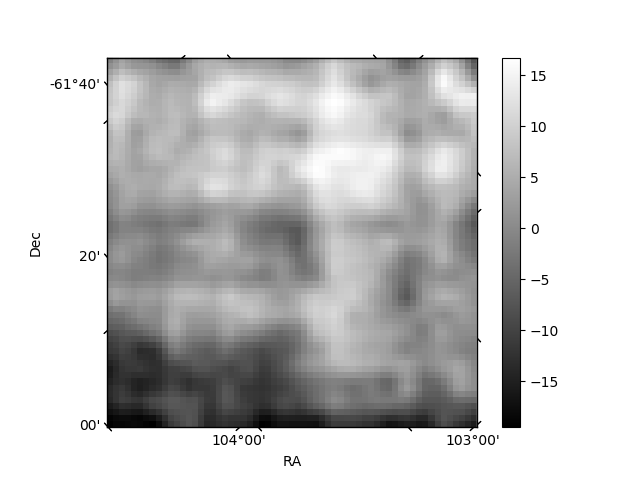
Histogram calculated using DETX and DETY for each event in the final _common_clean file
| Quadrant A | 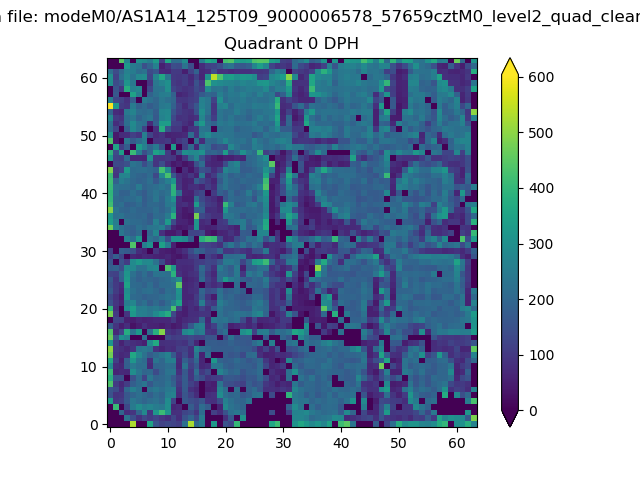 |
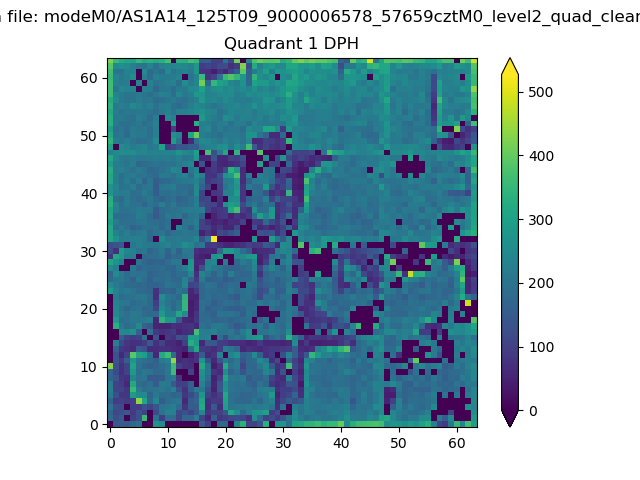 |
Quadrant B |
|---|---|---|---|
| Quadrant D | 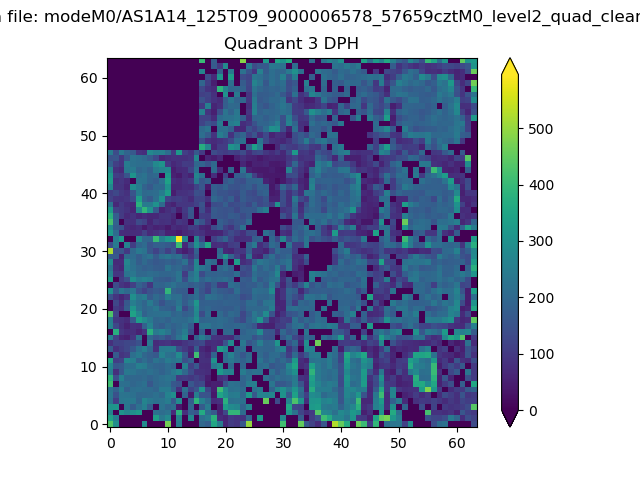 |
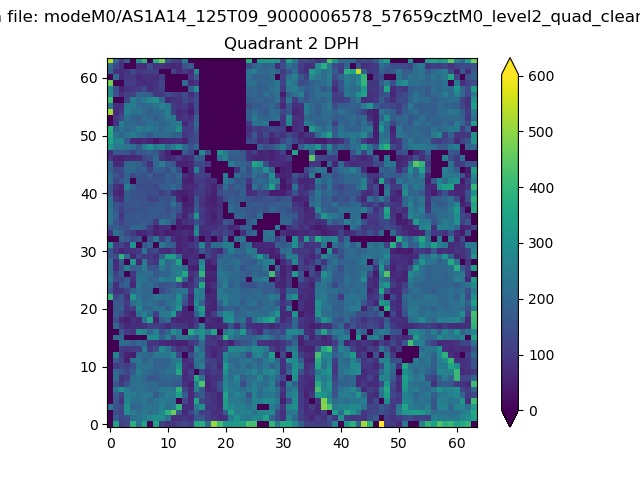 |
Quadrant C |
| Plot type | Count rate plots | Images |
|---|---|---|
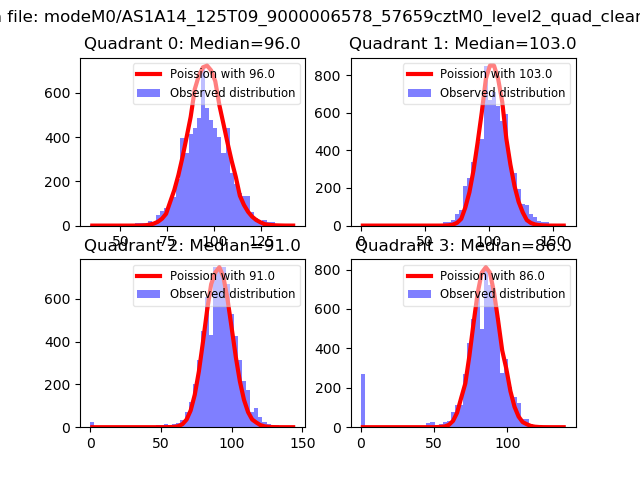
| Comparison with Poisson distribution Blue bars denote a histogram of data divided into 1 sec bins. Red curve is a Poisson curve with rate = median count rate of data. |
 |
 |
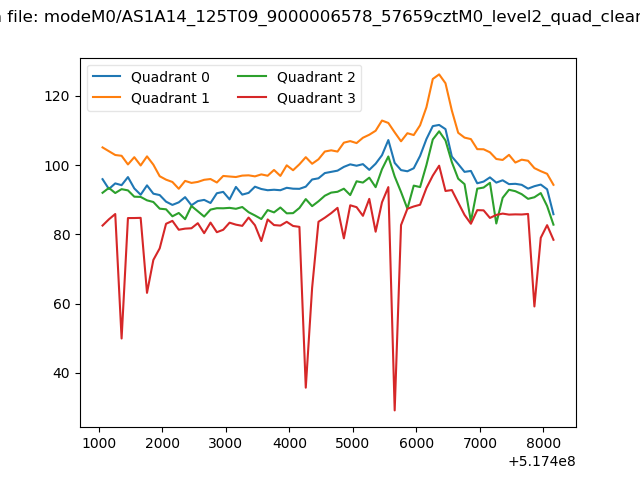
| Quadrant-wise count rates Data is divided into 100 sec bins |
 |
|
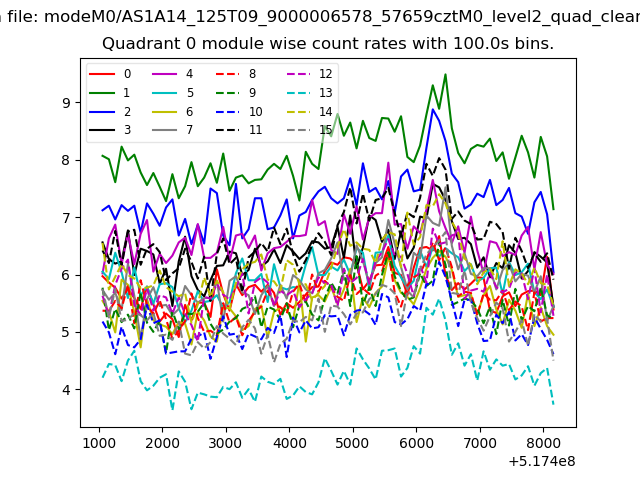
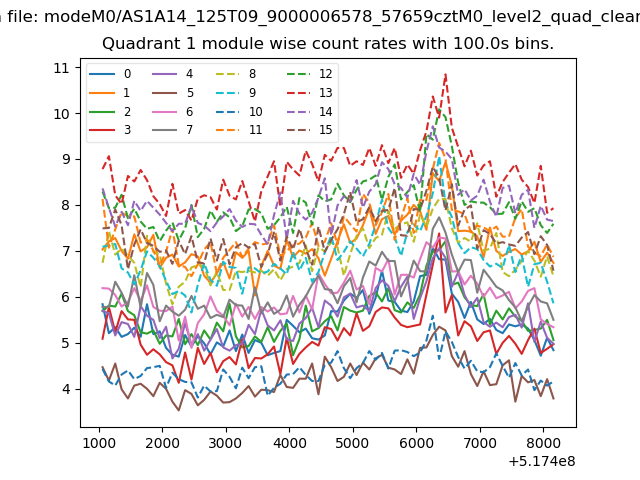
| Module-wise count rates for Quadrant A Data is divided into 100 sec bins |
 |
 |
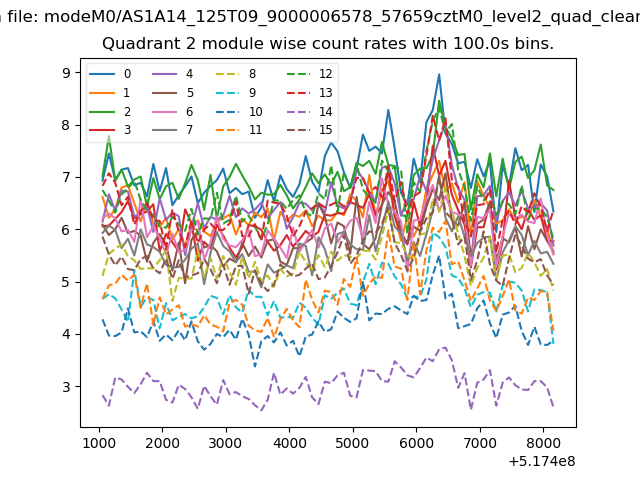
| Module-wise count rates for Quadrant B Data is divided into 100 sec bins |
 |
 |
| Module-wise count rates for Quadrant C Data is divided into 100 sec bins |
 |
 |
| Module-wise count rates for Quadrant D Data is divided into 100 sec bins |
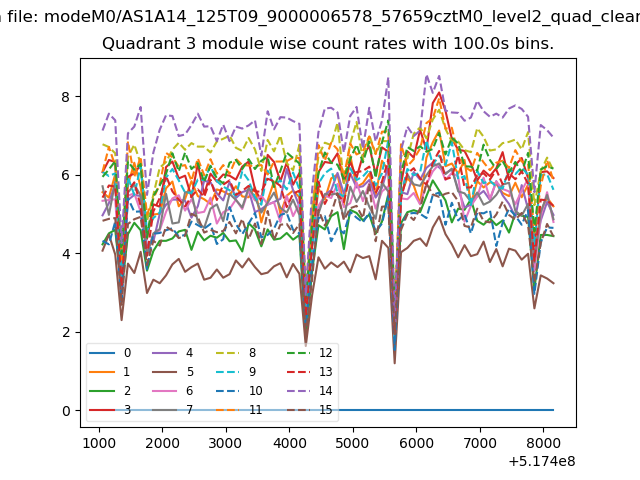 |
 |
| Parameter | Plot |
|---|---|
| CZT HV Monitor | 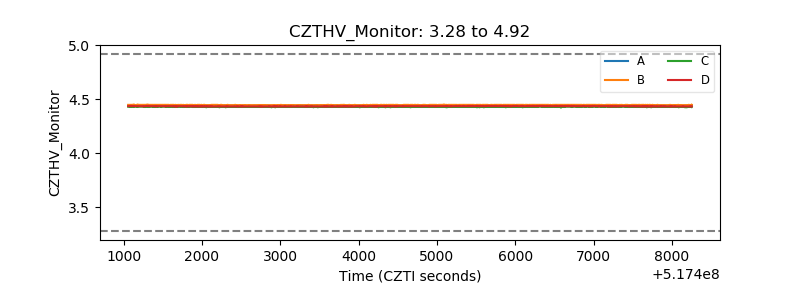 |
| D_VDD | 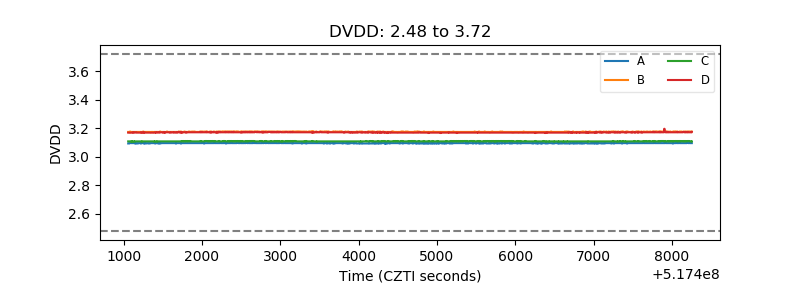 |
| Temperature 1 | 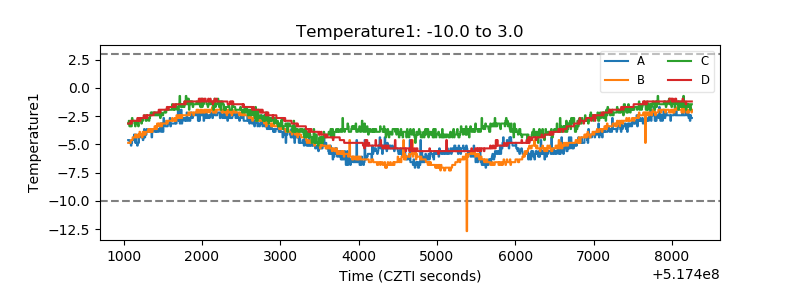 |
| Veto HV Monitor |  |
| Veto LLD | 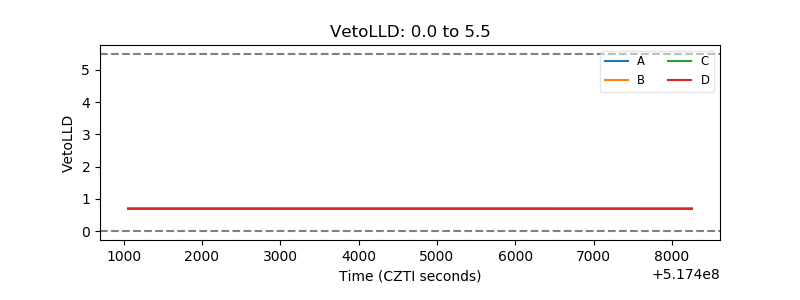 |
| Alpha Counter | 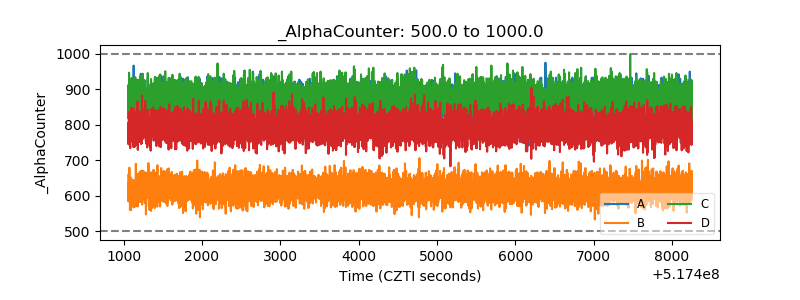 |
| _CPM_Rate | 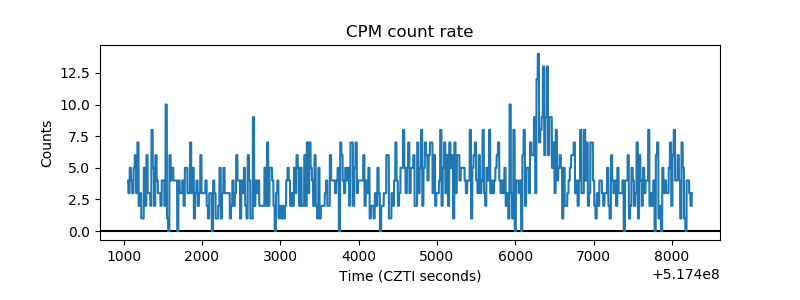 |
| CZT Counter | 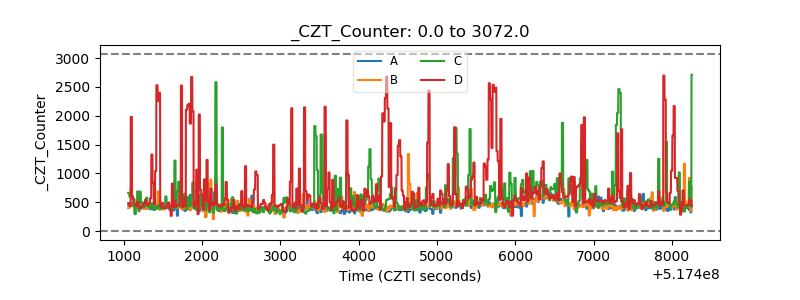 |
| +2.5 Volts monitor |  |
| +5 Volts monitor |  |
| _ROLL_ROT | 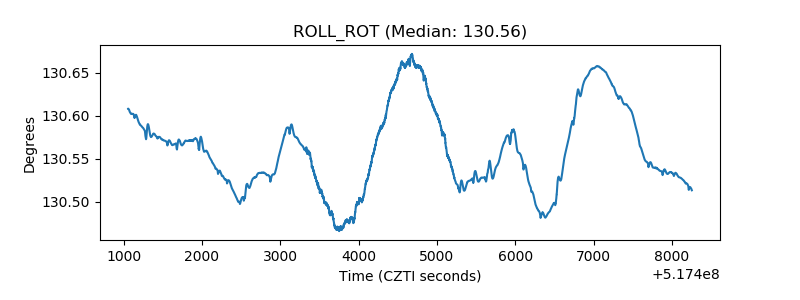 |
| _Roll_DEC | 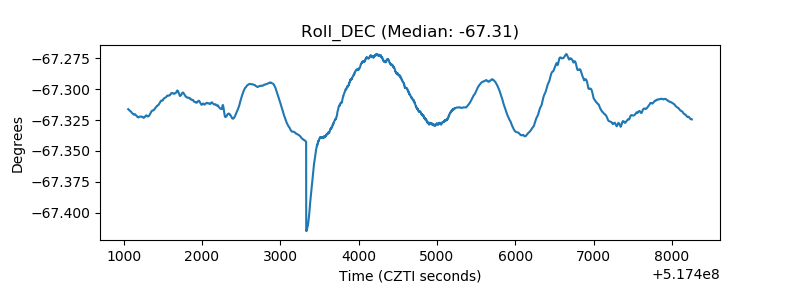 |
| _Roll_RA | 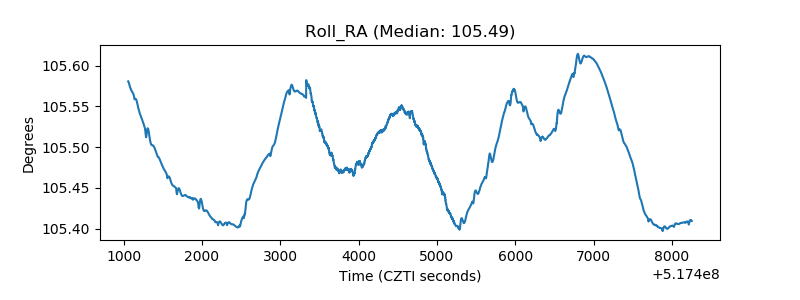 |
| Veto Counter | 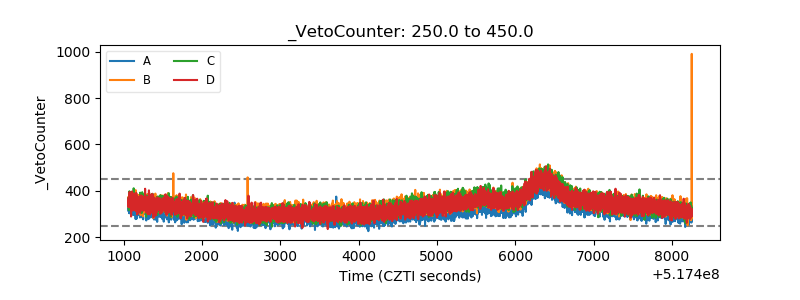 |