| Param | Original file | Final file |
|---|---|---|
| Filename | modeM0/AS1A14_125T09_9000006578_57660cztM0_level2.fits | modeM0/AS1A14_125T09_9000006578_57660cztM0_level2_quad_clean.evt |
| Size (bytes) | 473,555,520 | 105,704,640 |
| Size | 451.6 MB | 100.8 MB |
| Events in quadrant A | 3,072,325 | 697,229 |
| Events in quadrant B | 3,403,884 | 747,155 |
| Events in quadrant C | 5,657,950 | 637,156 |
| Events in quadrant D | 4,825,428 | 608,737 |
| Mode SS | |||
|---|---|---|---|
| Quadrant | BADHDUFLAG | Total packets | Discarded packets |
| A | 0 | 146 | 0 |
| B | 0 | 146 | 0 |
| C | 0 | 146 | 0 |
| D | 0 | 146 | 0 |
| Mode M0 | |||
|---|---|---|---|
| Quadrant | BADHDUFLAG | Total packets | Discarded packets |
| A | 0 | 14730 | 0 |
| B | 0 | 15417 | 0 |
| C | 0 | 21904 | 0 |
| D | 0 | 19157 | 0 |
| Quadrant | Total seconds | Saturated seconds | Saturation percentage |
|---|---|---|---|
| A | 7332 | 5 | 0.068194% |
| B | 7332 | 31 | 0.422804% |
| C | 7333 | 457 | 6.232101% |
| D | 7333 | 280 | 3.818355% |
Noise dominated data is calculated using 1-second bins in cleaned event files. If a bin has >2000 counts, and if more than 50% of those come from <1% of pixels, then it is considered to be noise-dominated and hence unusable.
| Quadrant | # 1 sec bins | Bins with >0 counts | Bins with >2000 counts | High rate bins dominated by noise | Noise dominated (total time) | Noise dominated (detector-on time) | Marked lightcurve |
|---|---|---|---|---|---|---|---|
| A | 7332 | 7332 | 0 | 0 | 0.00% | 0.00% | 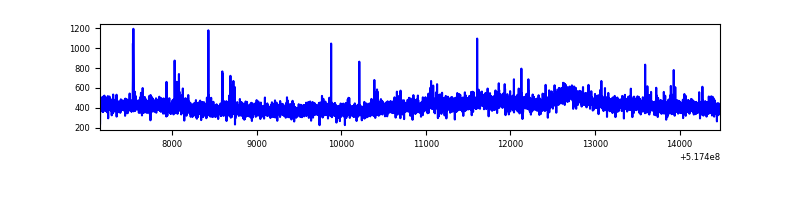 |
| B | 7332 | 7332 | 14 | 14 | 0.19% | 0.19% | 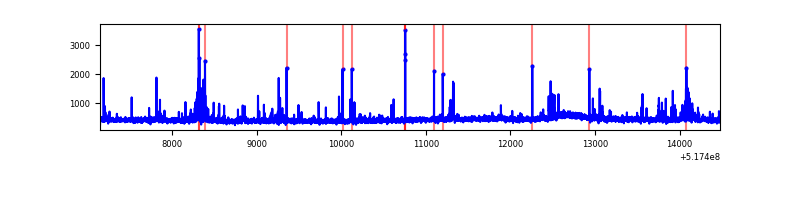 |
| C | 7333 | 7333 | 401 | 401 | 5.47% | 5.47% | 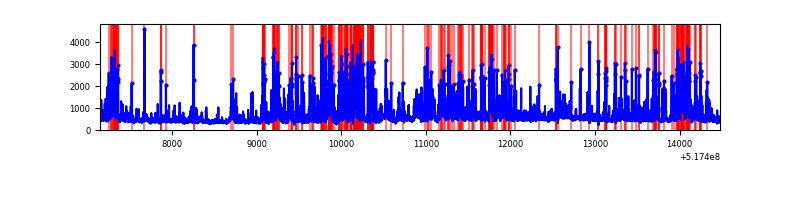 |
| D | 7333 | 7333 | 273 | 273 | 3.72% | 3.72% | 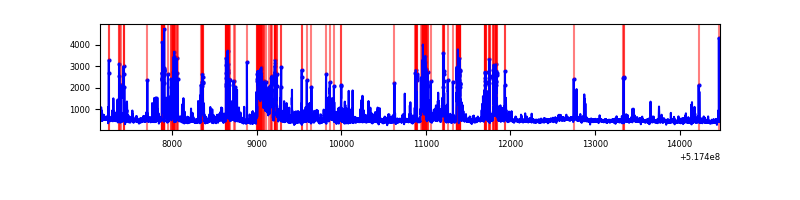 |
Top three noisy pixels from each quadrant. If the there are fewer than three noisy pixels in the level2.evt file, extra rows are filled as -1
| Pixel properties | Quadrant properties | ||||||
|---|---|---|---|---|---|---|---|
| Quadrant | DetID | PixID | Counts | Sigma | Mean | Median | Sigma |
| A | 13 | 248 | 14655 | 71.72 | 785 | 767 | 193.6 |
| A | 3 | 137 | 9695 | 46.11 | 785 | 767 | 193.6 |
| A | 13 | 254 | 9582 | 45.52 | 785 | 767 | 193.6 |
| B | 10 | 247 | 99672 | 597.83 | 774 | 746 | 165.5 |
| B | 0 | 245 | 84281 | 504.82 | 774 | 746 | 165.5 |
| B | 4 | 201 | 35715 | 211.33 | 774 | 746 | 165.5 |
| C | 15 | 224 | 1247251 | 6132.77 | 743 | 736 | 203.3 |
| C | 12 | 254 | 393218 | 1930.98 | 743 | 736 | 203.3 |
| C | 14 | 254 | 319112 | 1566.39 | 743 | 736 | 203.3 |
| D | 8 | 240 | 653120 | 3100.55 | 749 | 714 | 210.4 |
| D | 6 | 29 | 344567 | 1634.16 | 749 | 714 | 210.4 |
| D | 3 | 12 | 227975 | 1080.05 | 749 | 714 | 210.4 |
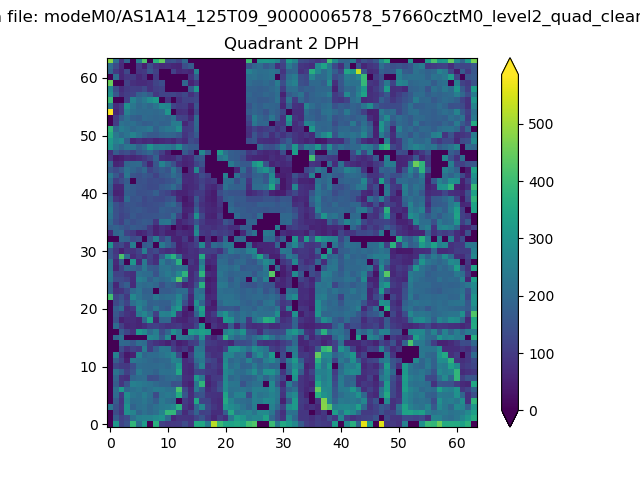
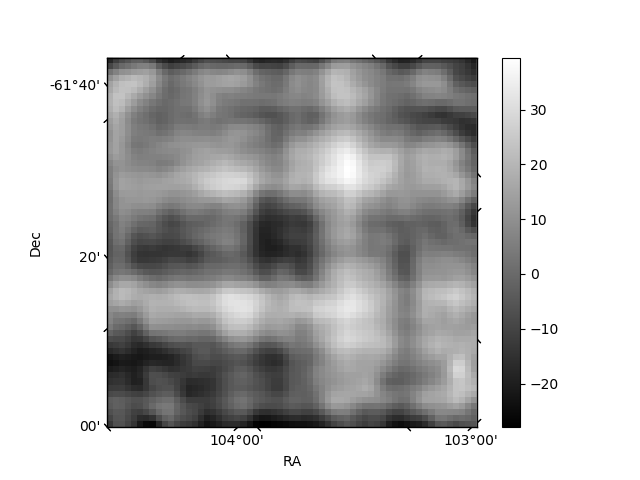
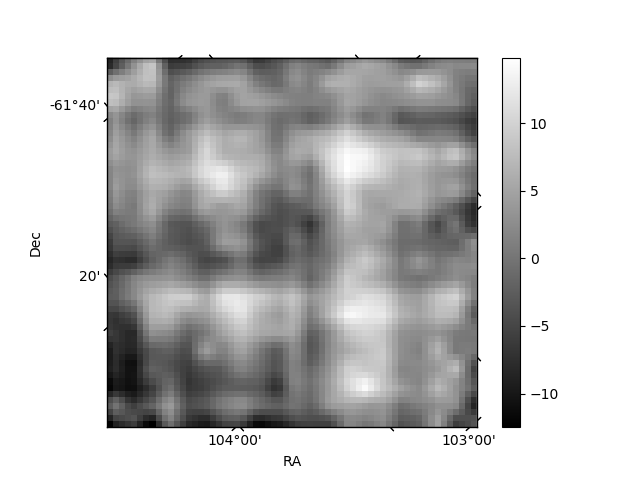
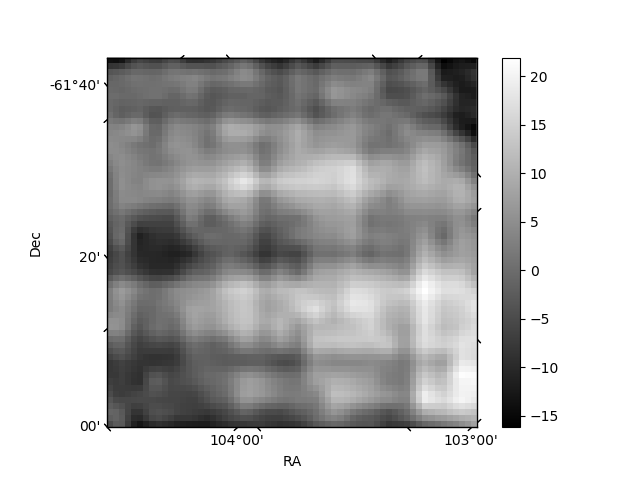
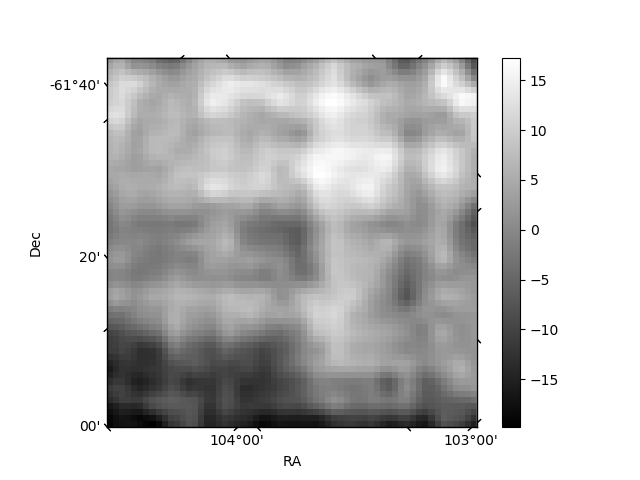
Histogram calculated using DETX and DETY for each event in the final _common_clean file
| Quadrant A | 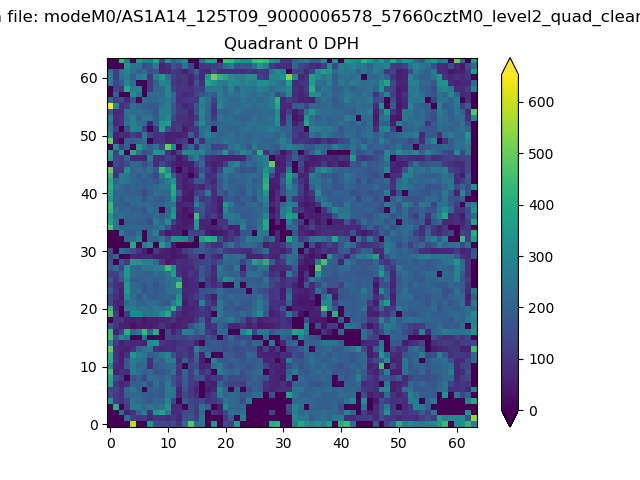 |
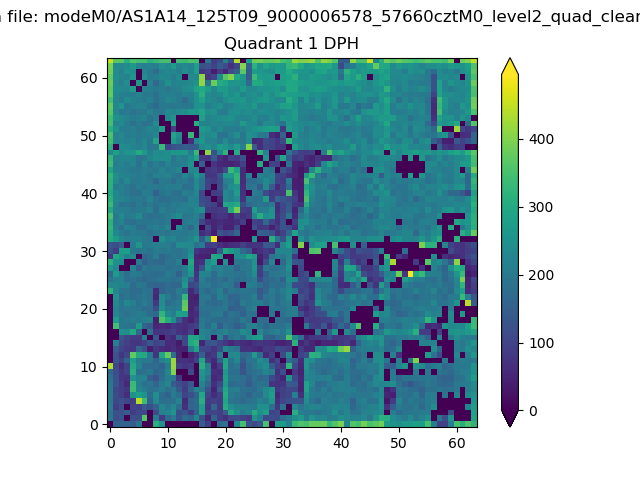 |
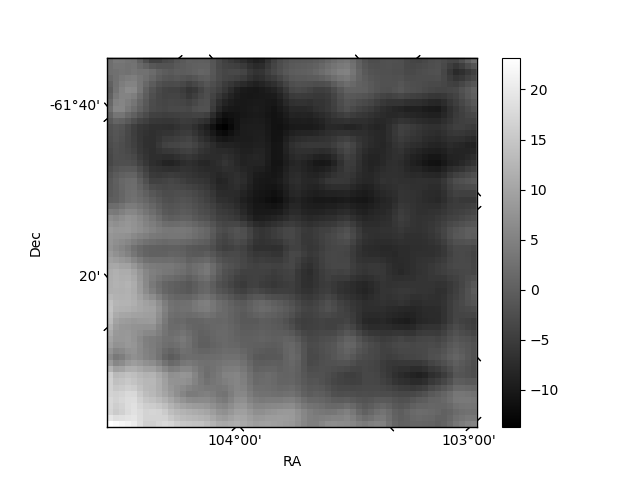
Quadrant B |
|---|---|---|---|
| Quadrant D | 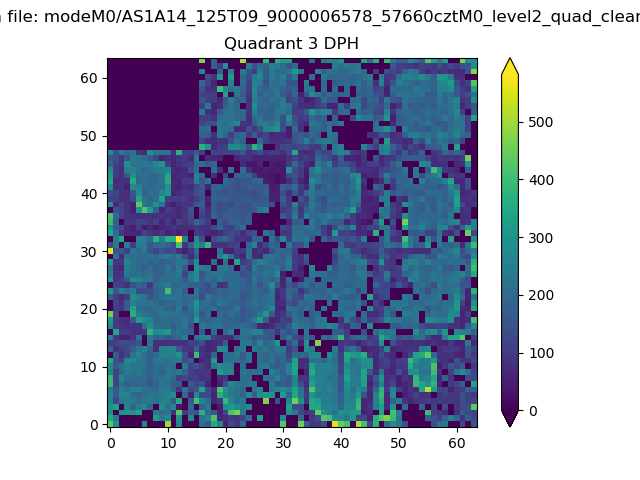 |
 |
Quadrant C |
| Plot type | Count rate plots | Images |
|---|---|---|
| Comparison with Poisson distribution Blue bars denote a histogram of data divided into 1 sec bins. Red curve is a Poisson curve with rate = median count rate of data. |
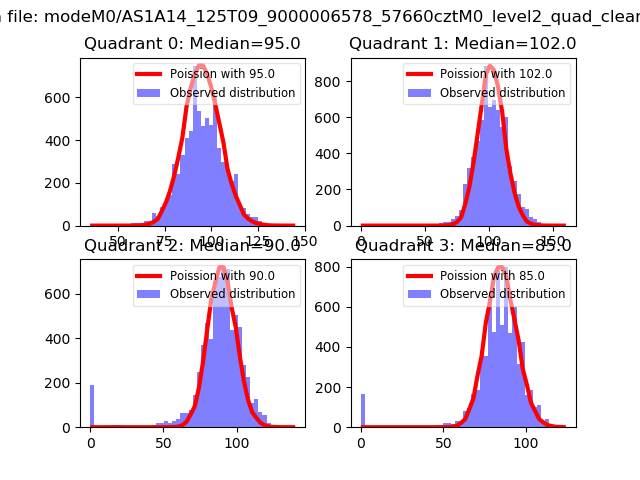 |
 |
| Quadrant-wise count rates Data is divided into 100 sec bins |
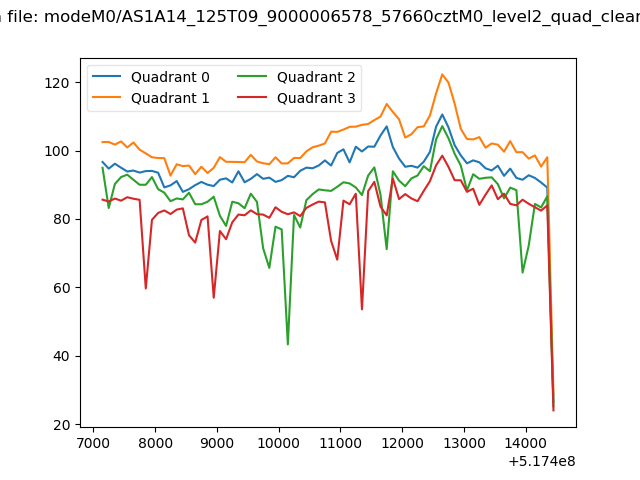 |
|
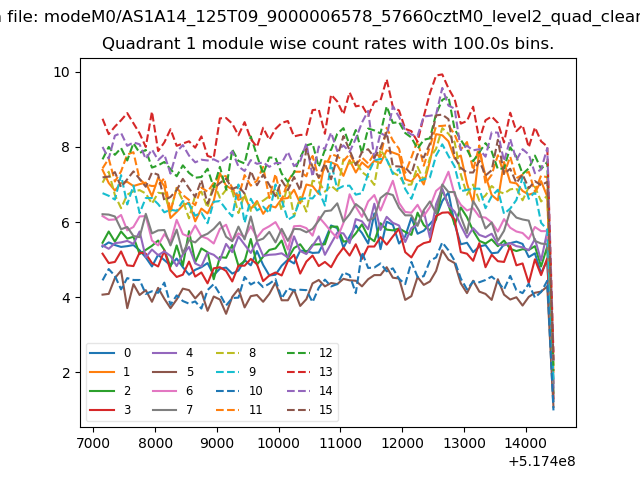
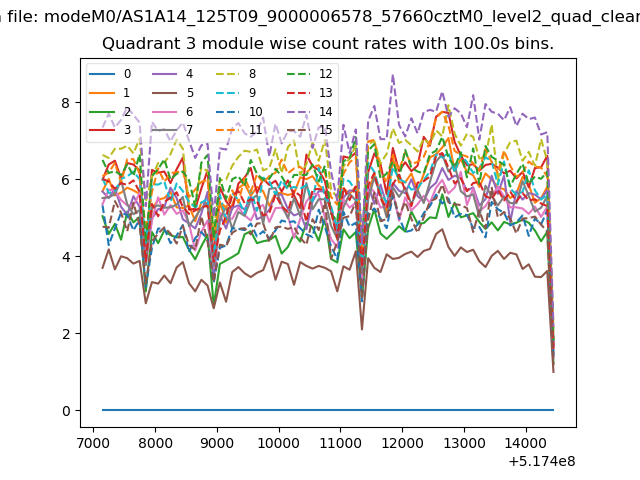
| Module-wise count rates for Quadrant A Data is divided into 100 sec bins |
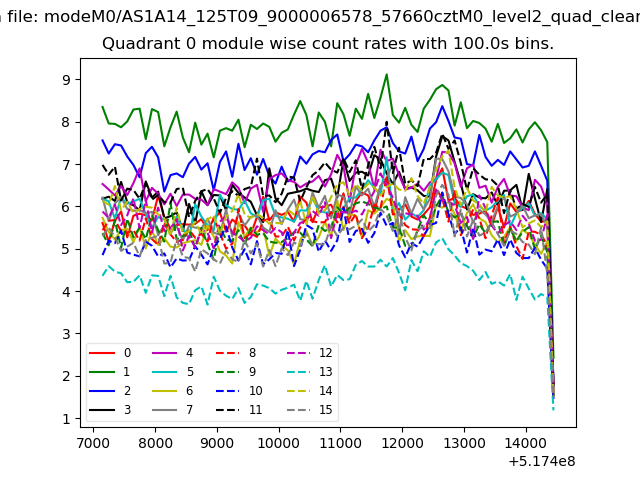 |
 |
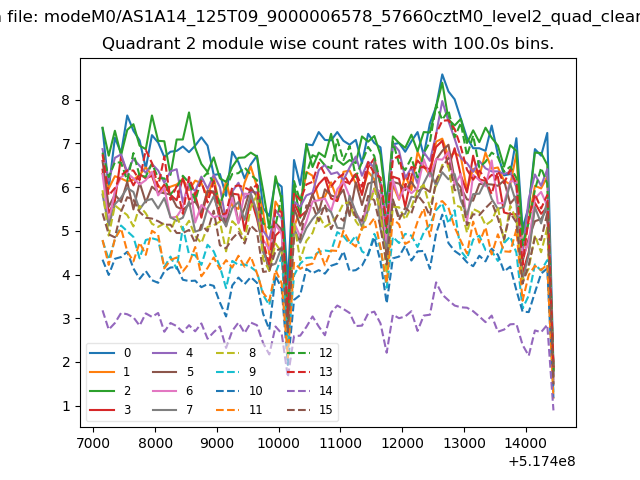
| Module-wise count rates for Quadrant B Data is divided into 100 sec bins |
 |
 |
| Module-wise count rates for Quadrant C Data is divided into 100 sec bins |
 |
 |
| Module-wise count rates for Quadrant D Data is divided into 100 sec bins |
 |
 |
| Parameter | Plot |
|---|---|
| CZT HV Monitor |  |
| D_VDD | 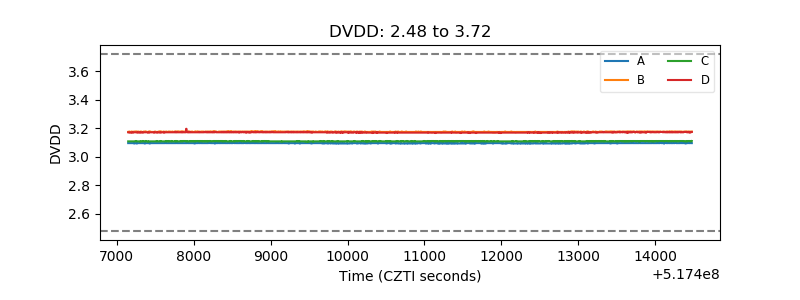 |
| Temperature 1 | 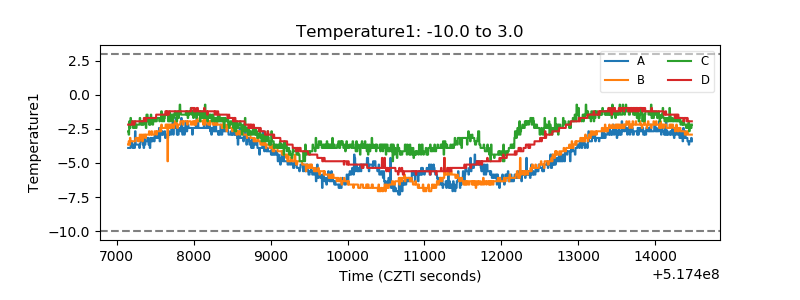 |
| Veto HV Monitor | 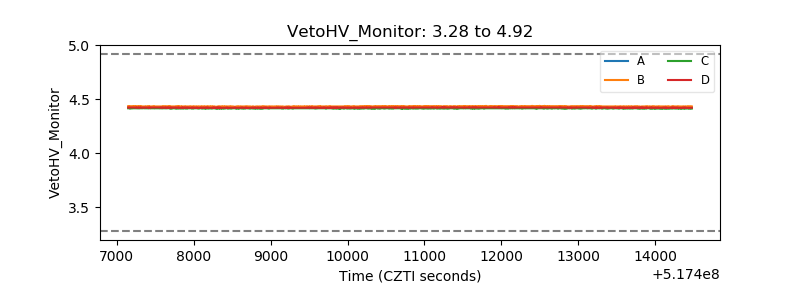 |
| Veto LLD | 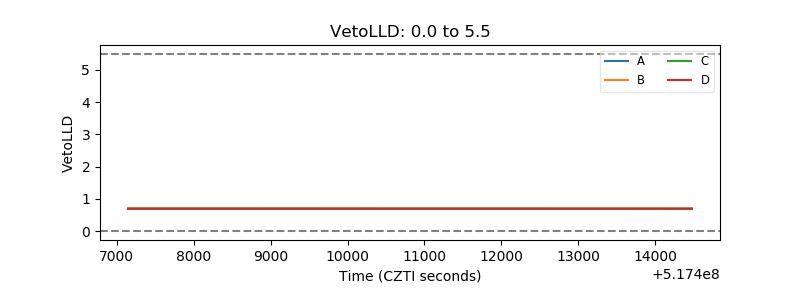 |
| Alpha Counter | 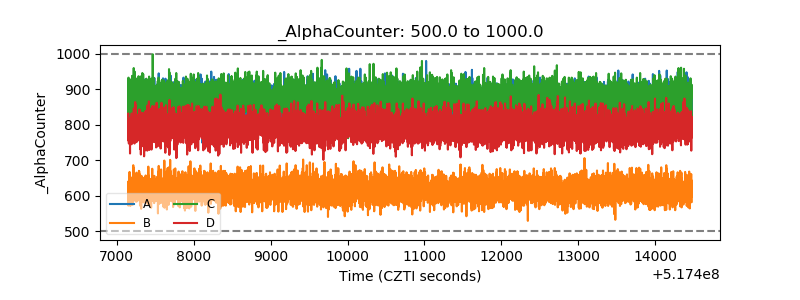 |
| _CPM_Rate | 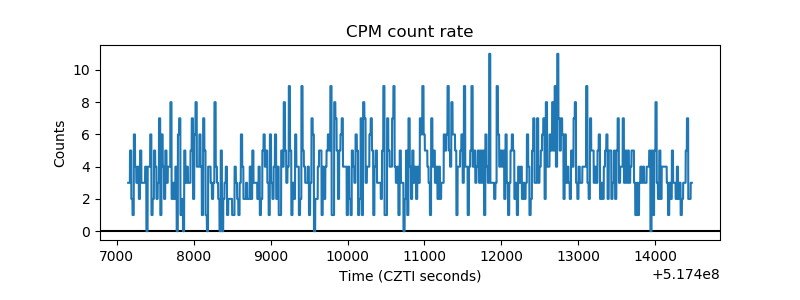 |
| CZT Counter | 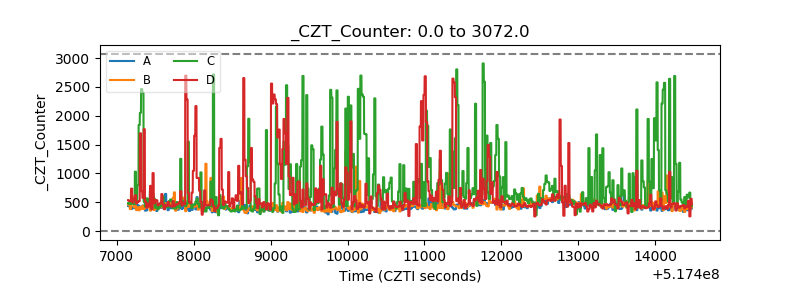 |
| +2.5 Volts monitor | 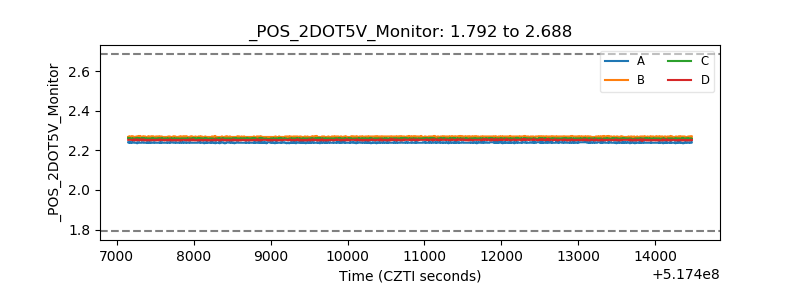 |
| +5 Volts monitor | 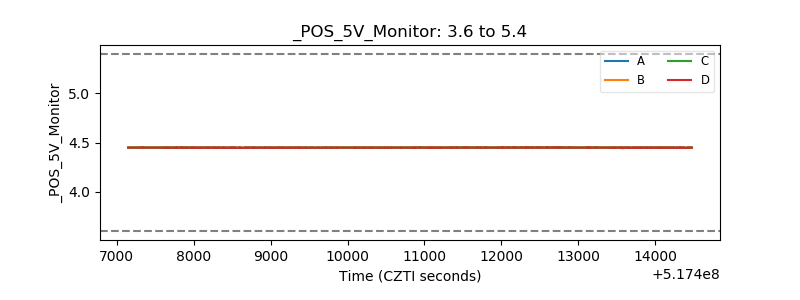 |
| _ROLL_ROT | 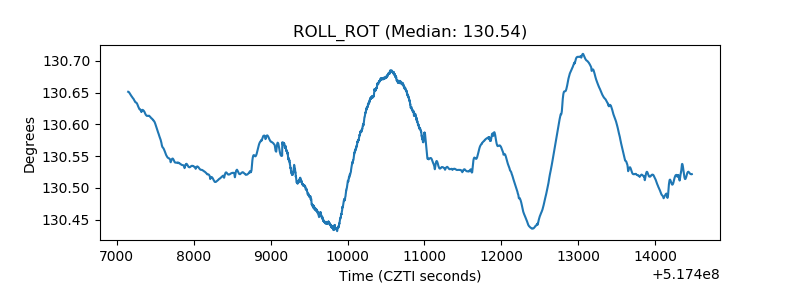 |
| _Roll_DEC | 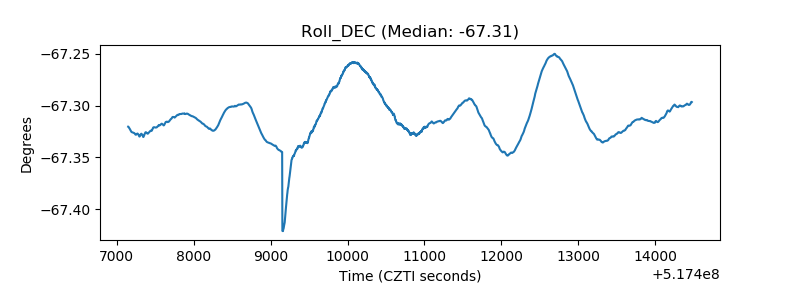 |
| _Roll_RA | 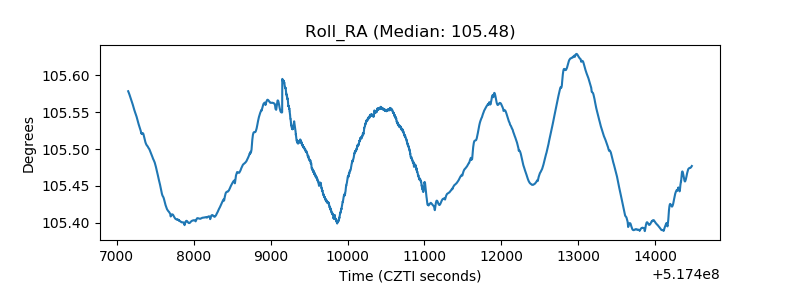 |
| Veto Counter | 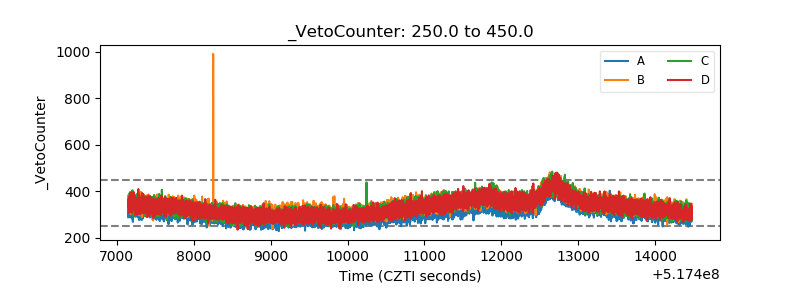 |