| Param | Original file | Final file |
|---|---|---|
| Filename | modeM0/AS1A14_125T09_9000006578_57661cztM0_level2.fits | modeM0/AS1A14_125T09_9000006578_57661cztM0_level2_quad_clean.evt |
| Size (bytes) | 483,471,360 | 109,235,520 |
| Size | 461.1 MB | 104.2 MB |
| Events in quadrant A | 3,228,490 | 718,399 |
| Events in quadrant B | 3,866,142 | 765,991 |
| Events in quadrant C | 5,351,008 | 664,925 |
| Events in quadrant D | 4,866,450 | 635,015 |
| Mode SS | |||
|---|---|---|---|
| Quadrant | BADHDUFLAG | Total packets | Discarded packets |
| A | 0 | 150 | 0 |
| B | 0 | 150 | 0 |
| C | 0 | 150 | 0 |
| D | 0 | 150 | 0 |
| Mode M0 | |||
|---|---|---|---|
| Quadrant | BADHDUFLAG | Total packets | Discarded packets |
| A | 0 | 15407 | 0 |
| B | 0 | 16821 | 0 |
| C | 0 | 21176 | 0 |
| D | 0 | 19738 | 0 |
| Quadrant | Total seconds | Saturated seconds | Saturation percentage |
|---|---|---|---|
| A | 7522 | 35 | 0.465302% |
| B | 7522 | 96 | 1.276256% |
| C | 7522 | 340 | 4.520074% |
| D | 7522 | 247 | 3.283701% |
Noise dominated data is calculated using 1-second bins in cleaned event files. If a bin has >2000 counts, and if more than 50% of those come from <1% of pixels, then it is considered to be noise-dominated and hence unusable.
| Quadrant | # 1 sec bins | Bins with >0 counts | Bins with >2000 counts | High rate bins dominated by noise | Noise dominated (total time) | Noise dominated (detector-on time) | Marked lightcurve |
|---|---|---|---|---|---|---|---|
| A | 7522 | 7522 | 7 | 7 | 0.09% | 0.09% | 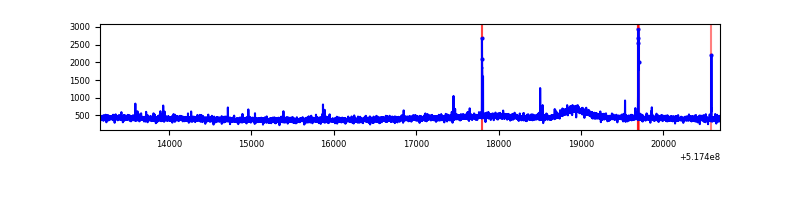 |
| B | 7522 | 7522 | 38 | 38 | 0.51% | 0.51% | 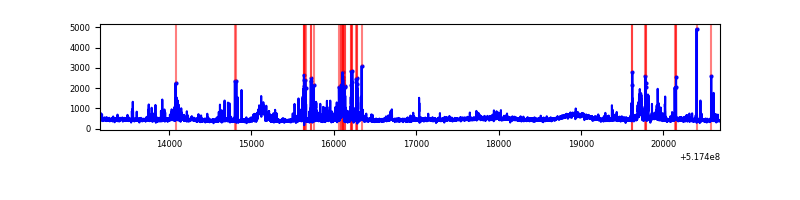 |
| C | 7522 | 7522 | 270 | 270 | 3.59% | 3.59% | 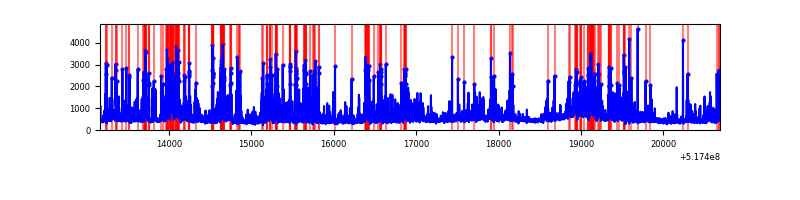 |
| D | 7522 | 7522 | 203 | 203 | 2.70% | 2.70% | 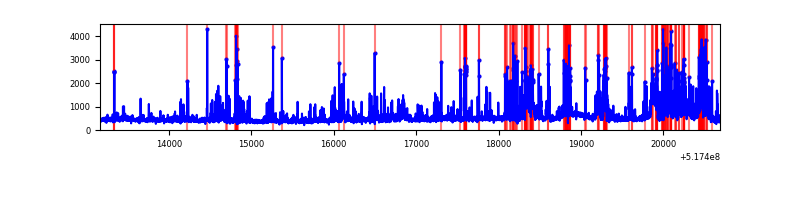 |
Top three noisy pixels from each quadrant. If the there are fewer than three noisy pixels in the level2.evt file, extra rows are filled as -1
| Pixel properties | Quadrant properties | ||||||
|---|---|---|---|---|---|---|---|
| Quadrant | DetID | PixID | Counts | Sigma | Mean | Median | Sigma |
| A | 10 | 251 | 27750 | 132.77 | 819 | 796 | 203.0 |
| A | 14 | 254 | 17441 | 81.99 | 819 | 796 | 203.0 |
| A | 3 | 137 | 10209 | 46.37 | 819 | 796 | 203.0 |
| B | 5 | 172 | 147770 | 846.65 | 807 | 775 | 173.6 |
| B | 10 | 247 | 140956 | 807.41 | 807 | 775 | 173.6 |
| B | 5 | 185 | 126289 | 722.93 | 807 | 775 | 173.6 |
| C | 15 | 224 | 1316560 | 6233.58 | 776 | 771 | 211.1 |
| C | 15 | 198 | 372666 | 1761.86 | 776 | 771 | 211.1 |
| C | 12 | 254 | 172110 | 811.72 | 776 | 771 | 211.1 |
| D | 8 | 240 | 717366 | 3256.71 | 783 | 748 | 220.0 |
| D | 7 | 253 | 296856 | 1345.68 | 783 | 748 | 220.0 |
| D | 3 | 12 | 196884 | 891.35 | 783 | 748 | 220.0 |
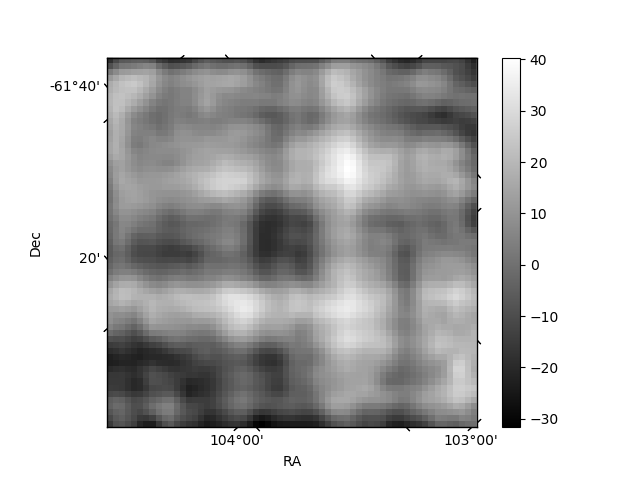
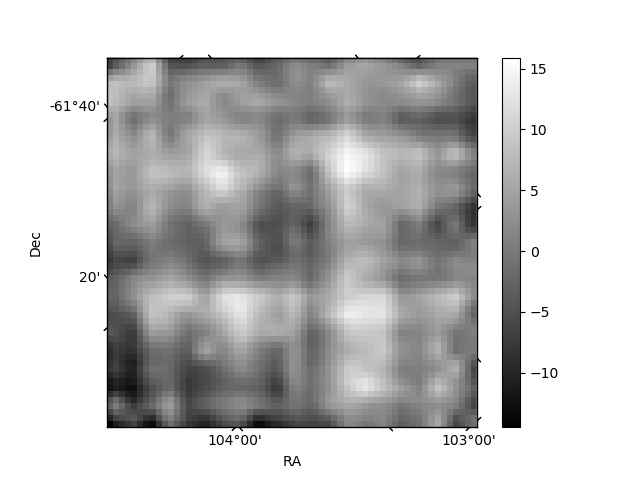
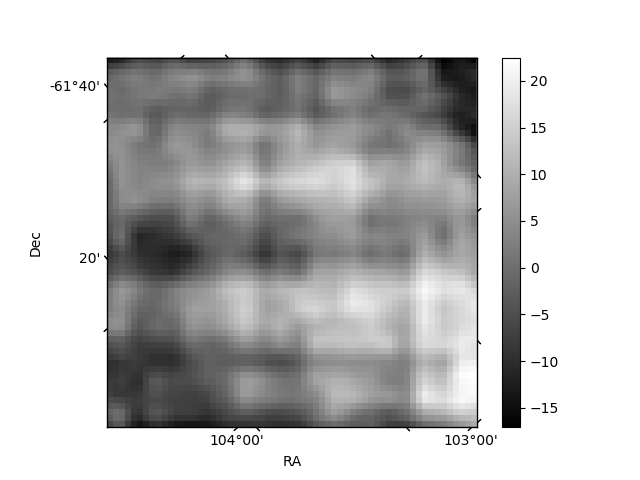
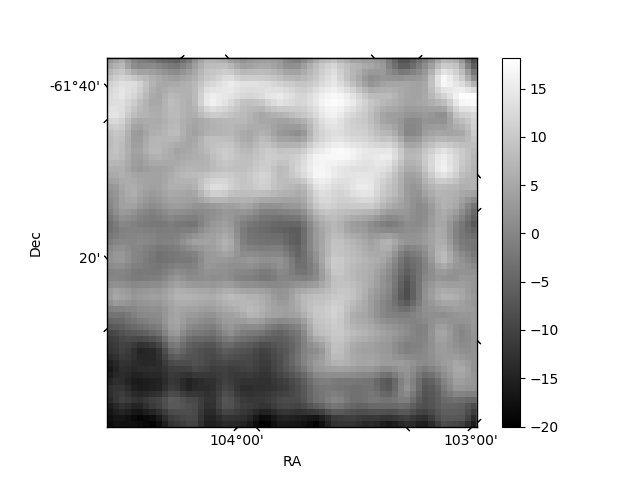
Histogram calculated using DETX and DETY for each event in the final _common_clean file
| Quadrant A | 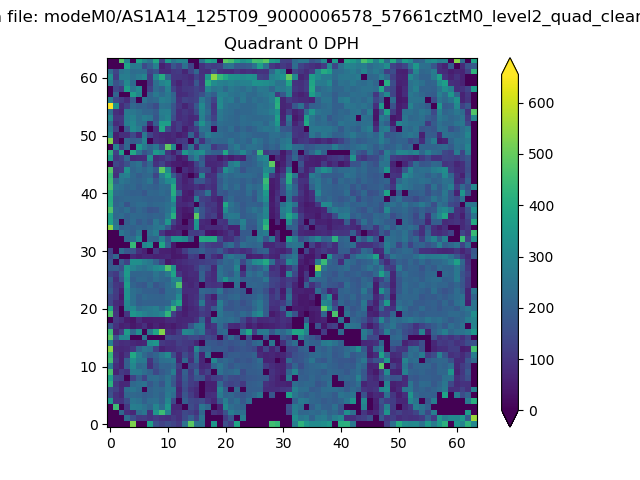 |
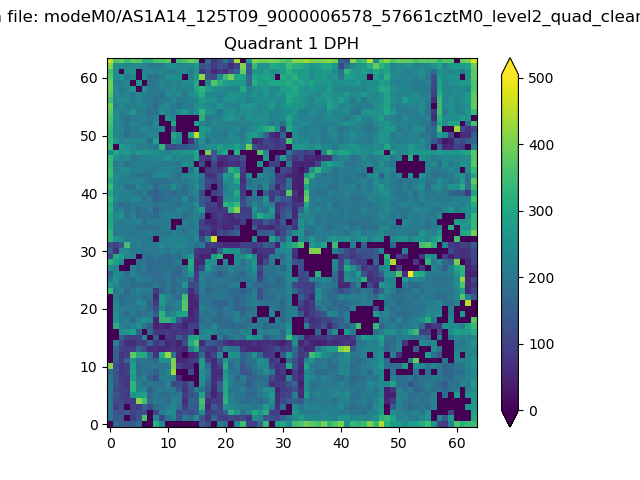 |
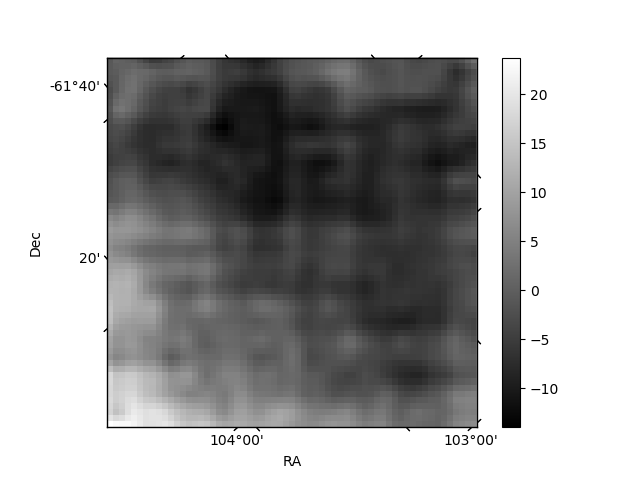
Quadrant B |
|---|---|---|---|
| Quadrant D | 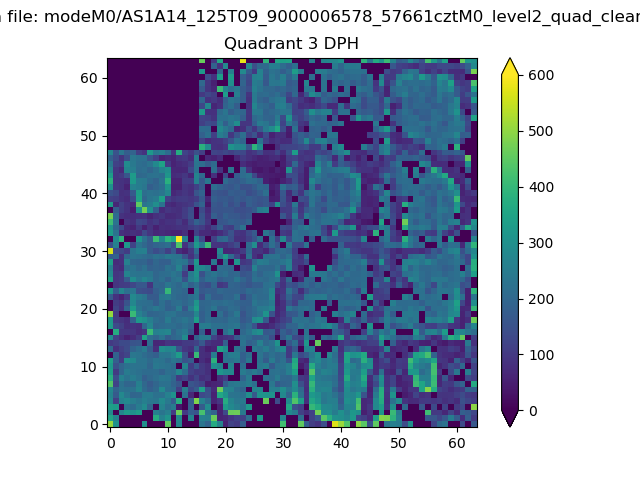 |
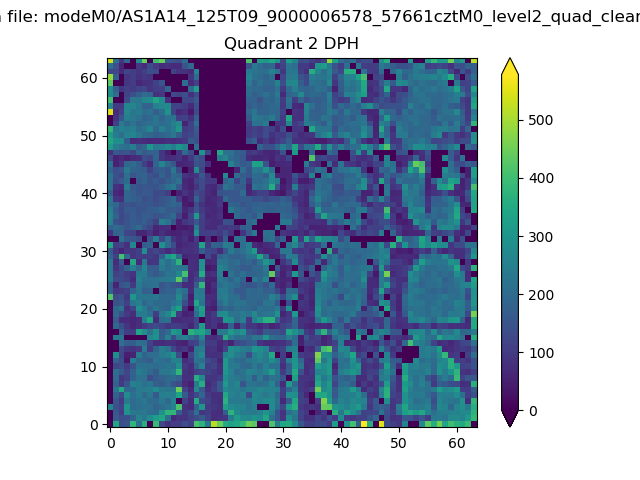 |
Quadrant C |
| Plot type | Count rate plots | Images |
|---|---|---|
| Comparison with Poisson distribution Blue bars denote a histogram of data divided into 1 sec bins. Red curve is a Poisson curve with rate = median count rate of data. |
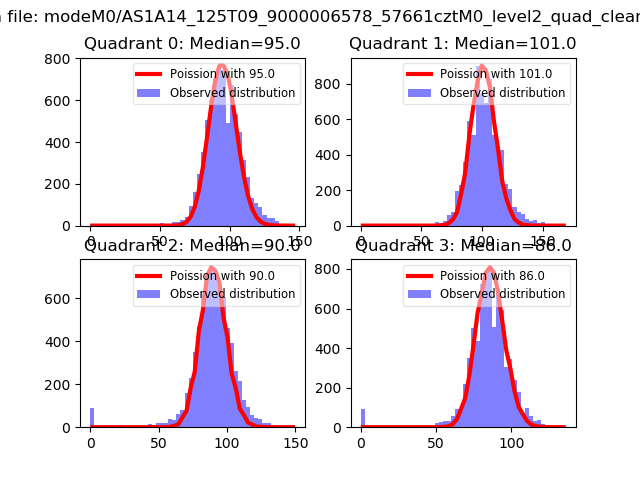 |
 |
| Quadrant-wise count rates Data is divided into 100 sec bins |
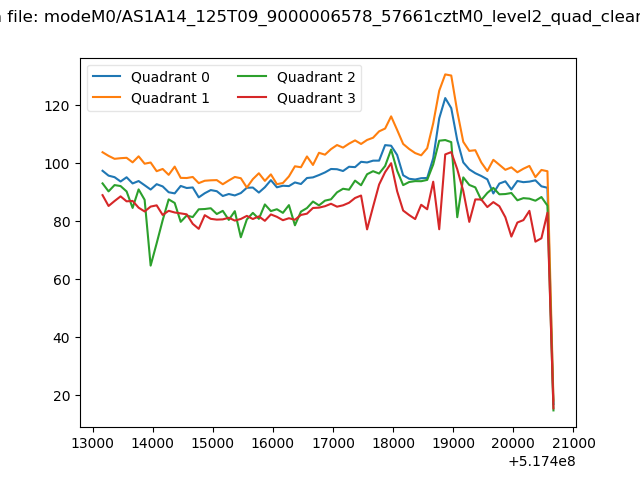 |
|
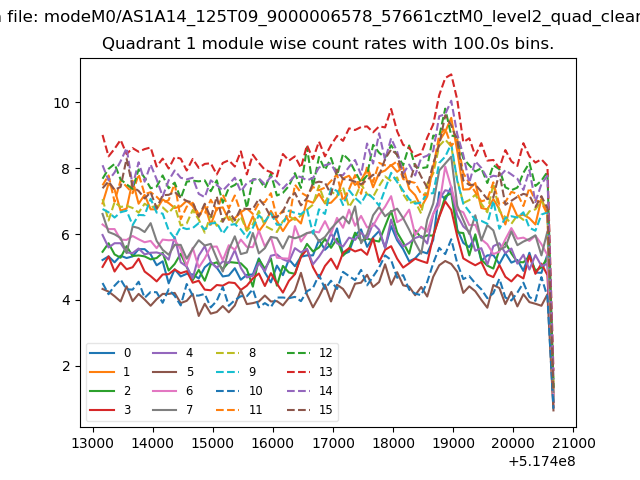
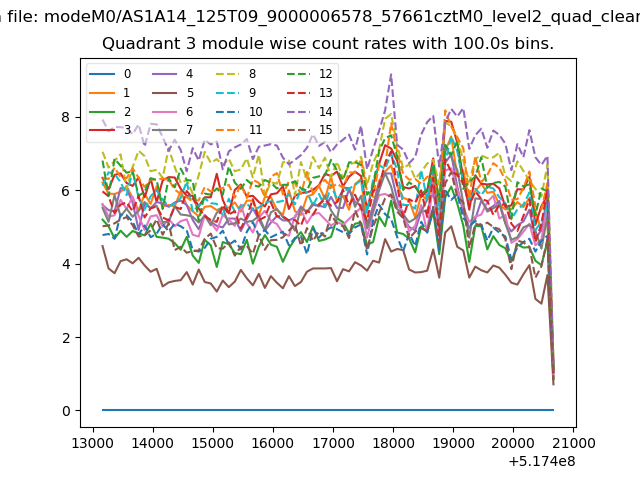
| Module-wise count rates for Quadrant A Data is divided into 100 sec bins |
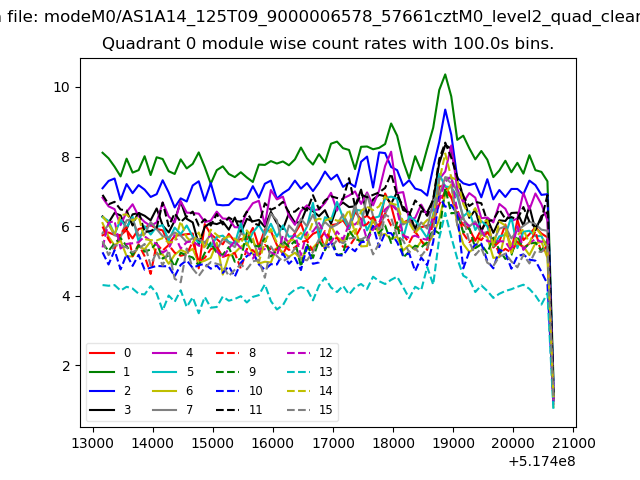 |
 |
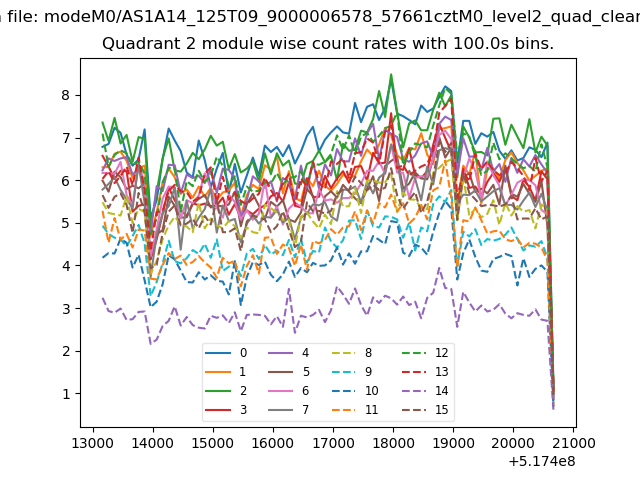
| Module-wise count rates for Quadrant B Data is divided into 100 sec bins |
 |
 |
| Module-wise count rates for Quadrant C Data is divided into 100 sec bins |
 |
 |
| Module-wise count rates for Quadrant D Data is divided into 100 sec bins |
 |
 |
| Parameter | Plot |
|---|---|
| CZT HV Monitor | 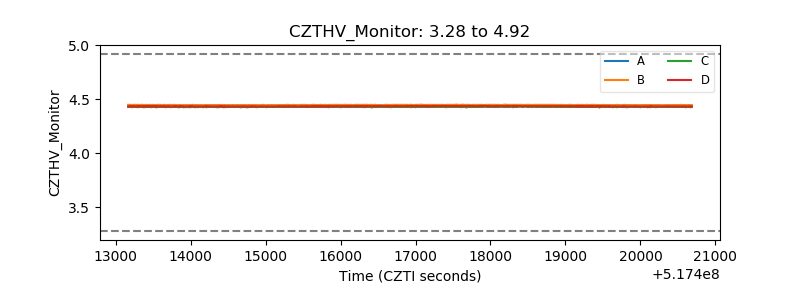 |
| D_VDD | 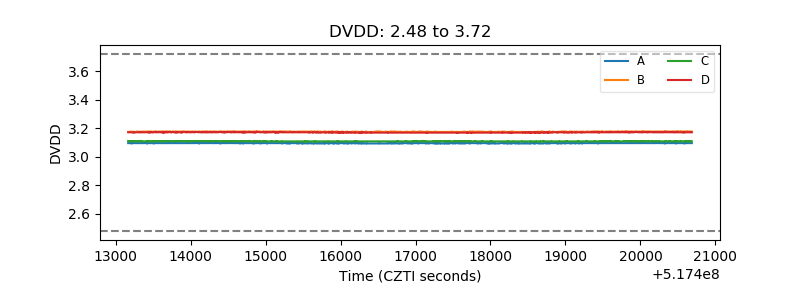 |
| Temperature 1 | 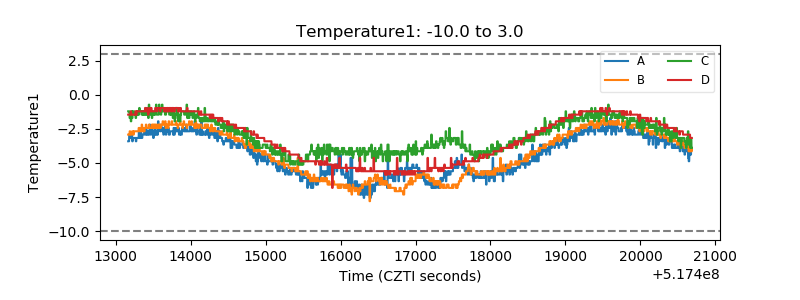 |
| Veto HV Monitor | 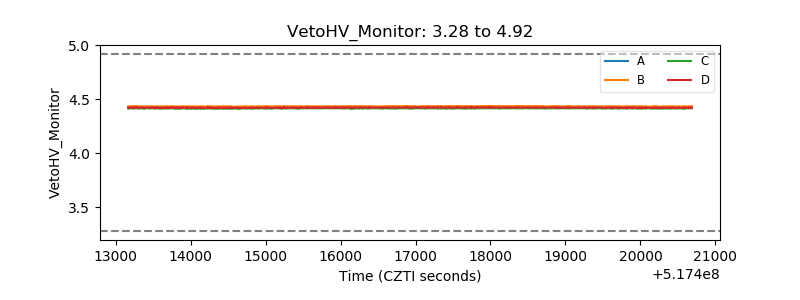 |
| Veto LLD | 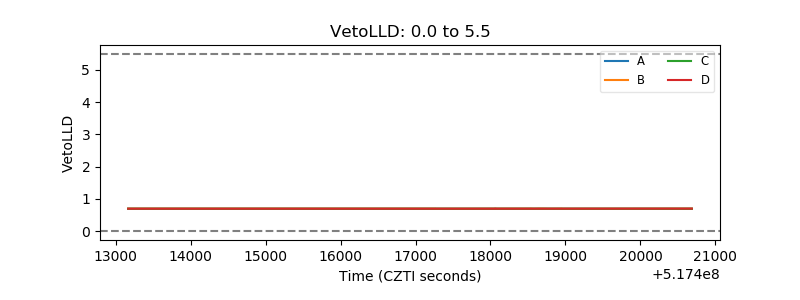 |
| Alpha Counter | 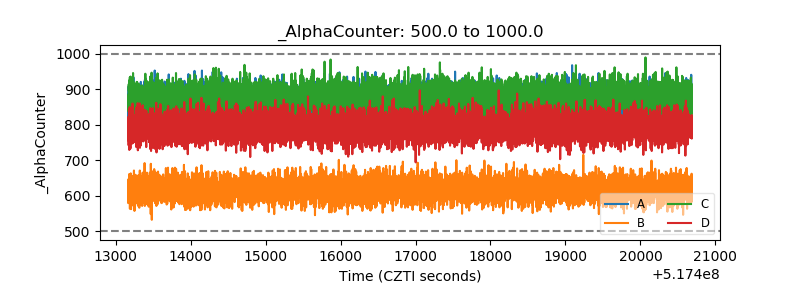 |
| _CPM_Rate | 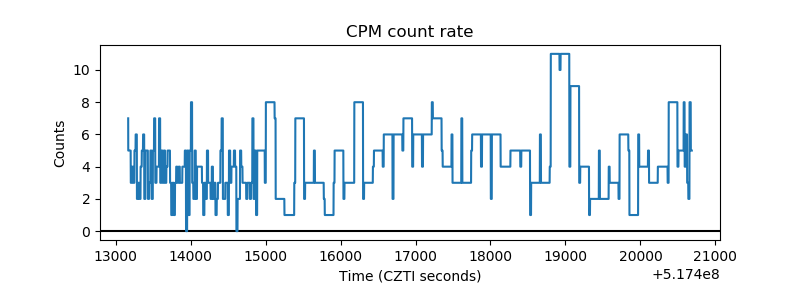 |
| CZT Counter | 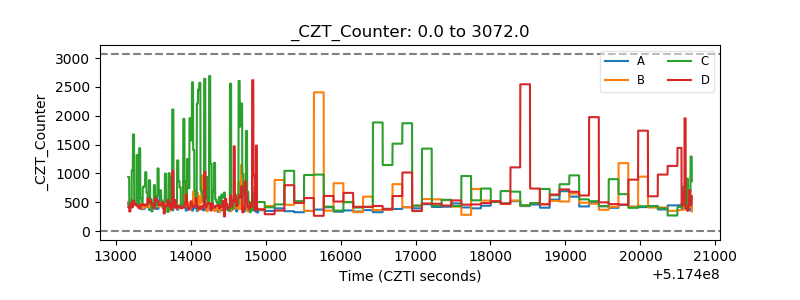 |
| +2.5 Volts monitor | 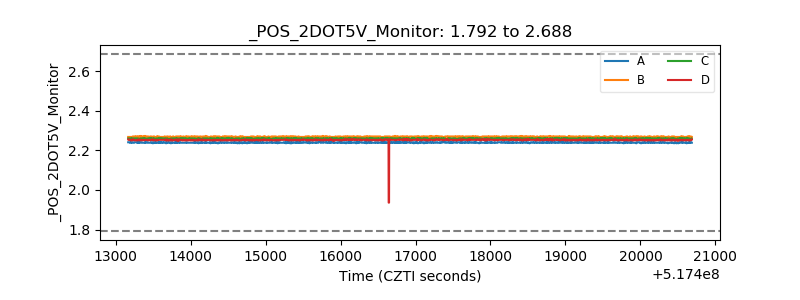 |
| +5 Volts monitor | 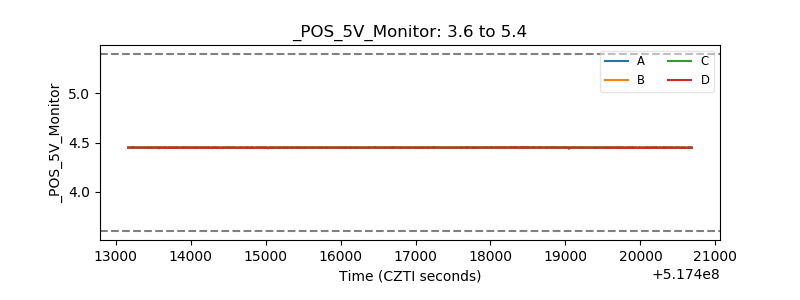 |
| _ROLL_ROT | 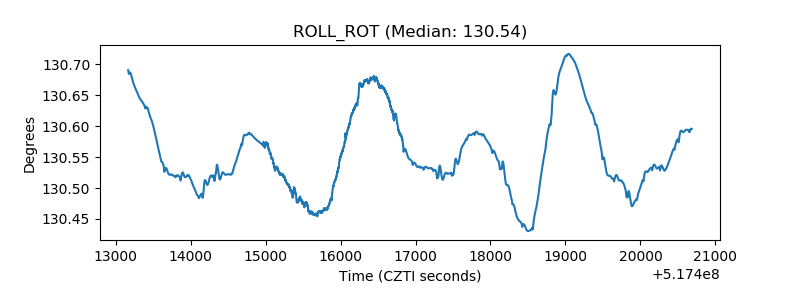 |
| _Roll_DEC | 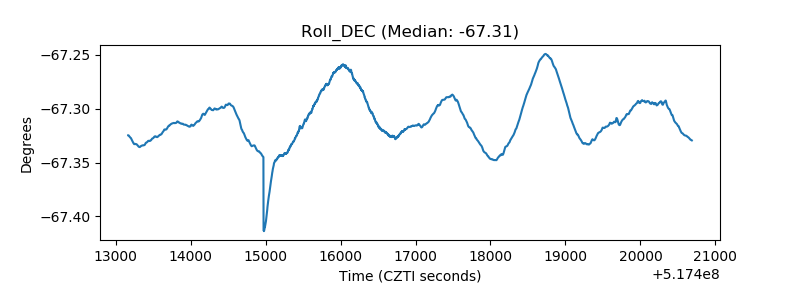 |
| _Roll_RA | 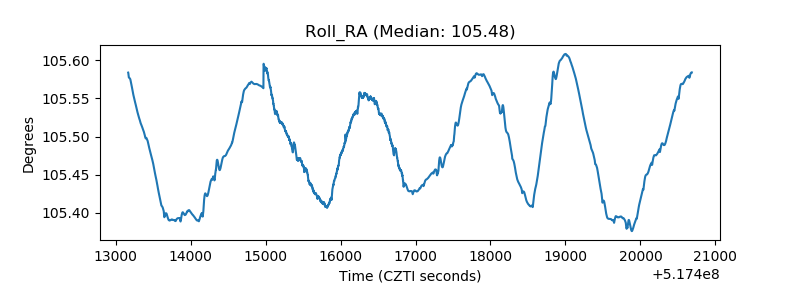 |
| Veto Counter | 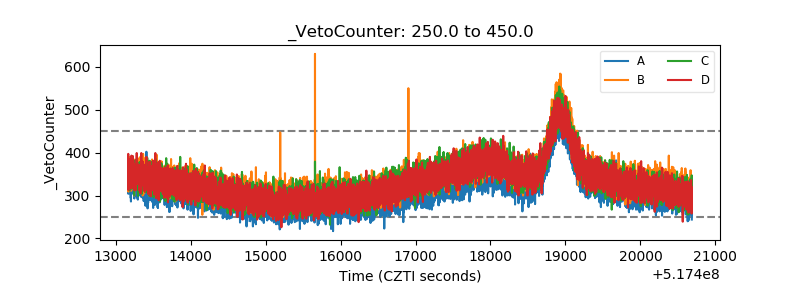 |