| Param | Original file | Final file |
|---|---|---|
| Filename | modeM0/AS1A14_125T09_9000006578_57663cztM0_level2.fits | modeM0/AS1A14_125T09_9000006578_57663cztM0_level2_quad_clean.evt |
| Size (bytes) | 642,723,840 | 142,853,760 |
| Size | 612.9 MB | 136.2 MB |
| Events in quadrant A | 4,254,065 | 949,351 |
| Events in quadrant B | 4,902,889 | 1,006,526 |
| Events in quadrant C | 7,283,419 | 847,553 |
| Events in quadrant D | 6,567,372 | 822,178 |
| Mode M9 | |||
|---|---|---|---|
| Quadrant | BADHDUFLAG | Total packets | Discarded packets |
| A | 0 | 4 | 0 |
| B | 0 | 4 | 0 |
| C | 0 | 4 | 0 |
| D | 0 | 4 | 0 |
| Mode SS | |||
|---|---|---|---|
| Quadrant | BADHDUFLAG | Total packets | Discarded packets |
| A | 0 | 204 | 0 |
| B | 0 | 204 | 0 |
| C | 0 | 204 | 0 |
| D | 0 | 204 | 0 |
| Mode M0 | |||
|---|---|---|---|
| Quadrant | BADHDUFLAG | Total packets | Discarded packets |
| A | 0 | 20476 | 1 |
| B | 0 | 22101 | 1 |
| C | 0 | 28795 | 1 |
| D | 0 | 26520 | 1 |
| Quadrant | Total seconds | Saturated seconds | Saturation percentage |
|---|---|---|---|
| A | 10099 | 17 | 0.168333% |
| B | 10099 | 139 | 1.376374% |
| C | 10099 | 676 | 6.693732% |
| D | 10099 | 377 | 3.733043% |
Noise dominated data is calculated using 1-second bins in cleaned event files. If a bin has >2000 counts, and if more than 50% of those come from <1% of pixels, then it is considered to be noise-dominated and hence unusable.
| Quadrant | # 1 sec bins | Bins with >0 counts | Bins with >2000 counts | High rate bins dominated by noise | Noise dominated (total time) | Noise dominated (detector-on time) | Marked lightcurve |
|---|---|---|---|---|---|---|---|
| A | 10494 | 10100 | 9 | 9 | 0.09% | 0.09% | 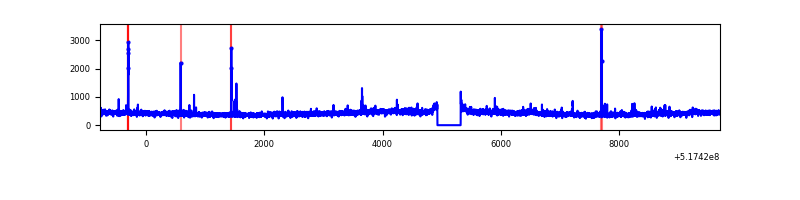 |
| B | 10494 | 10100 | 61 | 61 | 0.58% | 0.60% | 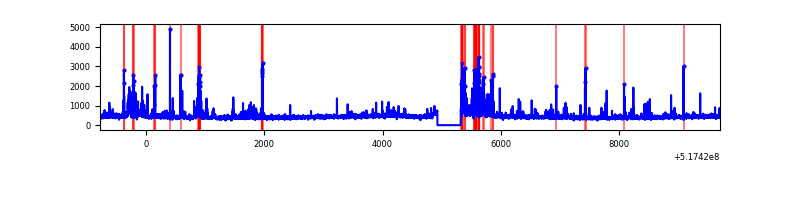 |
| C | 10494 | 10100 | 518 | 518 | 4.94% | 5.13% | 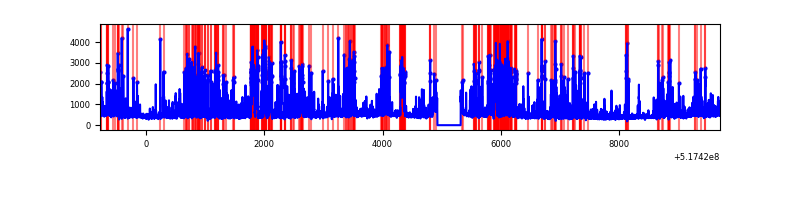 |
| D | 10494 | 10100 | 354 | 354 | 3.37% | 3.50% | 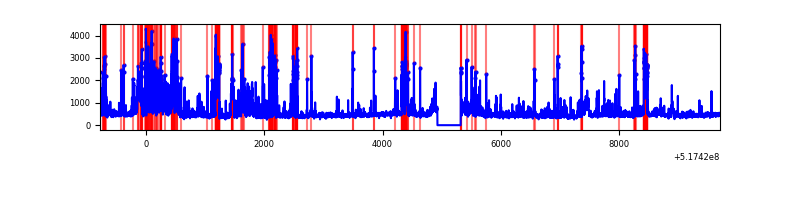 |
Top three noisy pixels from each quadrant. If the there are fewer than three noisy pixels in the level2.evt file, extra rows are filled as -1
| Pixel properties | Quadrant properties | ||||||
|---|---|---|---|---|---|---|---|
| Quadrant | DetID | PixID | Counts | Sigma | Mean | Median | Sigma |
| A | 8 | 4 | 78539 | 295.71 | 1059 | 1031 | 262.1 |
| A | 10 | 251 | 21666 | 78.73 | 1059 | 1031 | 262.1 |
| A | 3 | 245 | 17262 | 61.92 | 1059 | 1031 | 262.1 |
| B | 10 | 247 | 182370 | 806.88 | 1047 | 1007 | 224.8 |
| B | 5 | 185 | 140290 | 619.67 | 1047 | 1007 | 224.8 |
| B | 10 | 16 | 92320 | 406.25 | 1047 | 1007 | 224.8 |
| C | 15 | 224 | 1818243 | 6728.88 | 992 | 983 | 270.1 |
| C | 14 | 254 | 629887 | 2328.68 | 992 | 983 | 270.1 |
| C | 12 | 2 | 607711 | 2246.57 | 992 | 983 | 270.1 |
| D | 8 | 240 | 1208583 | 4264.85 | 1005 | 957 | 283.2 |
| D | 7 | 253 | 330360 | 1163.32 | 1005 | 957 | 283.2 |
| D | 3 | 12 | 295259 | 1039.36 | 1005 | 957 | 283.2 |
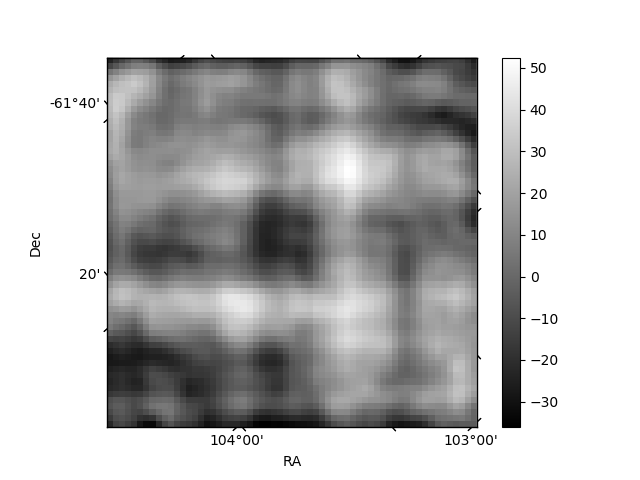
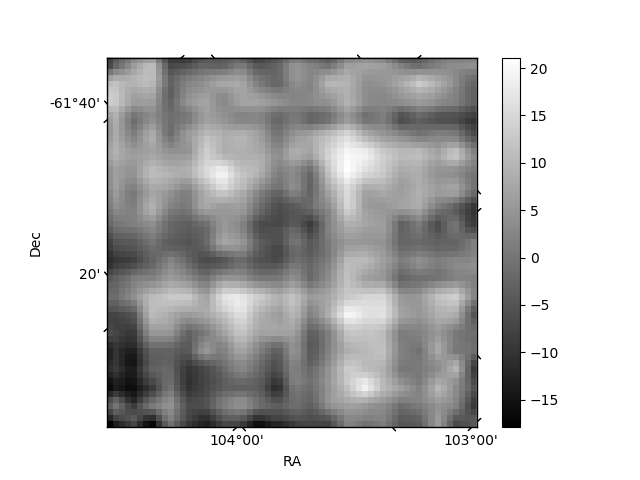
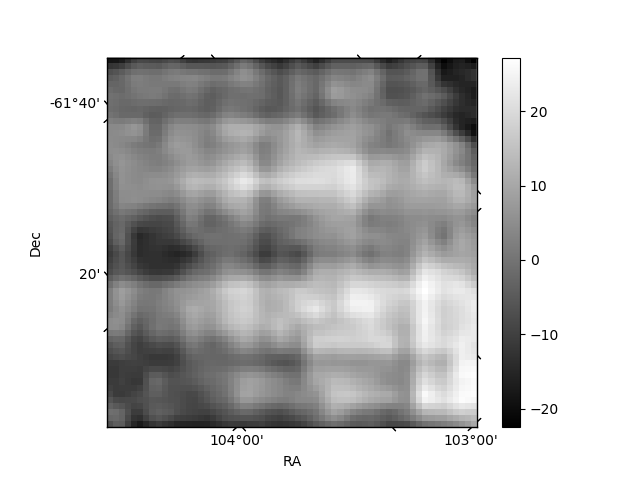
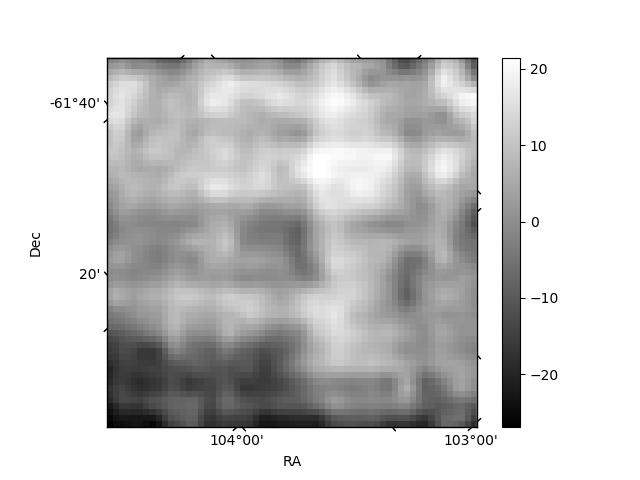
Histogram calculated using DETX and DETY for each event in the final _common_clean file
| Quadrant A | 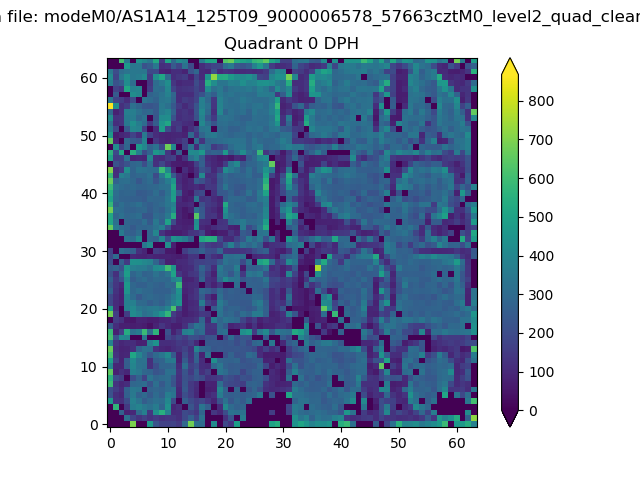 |
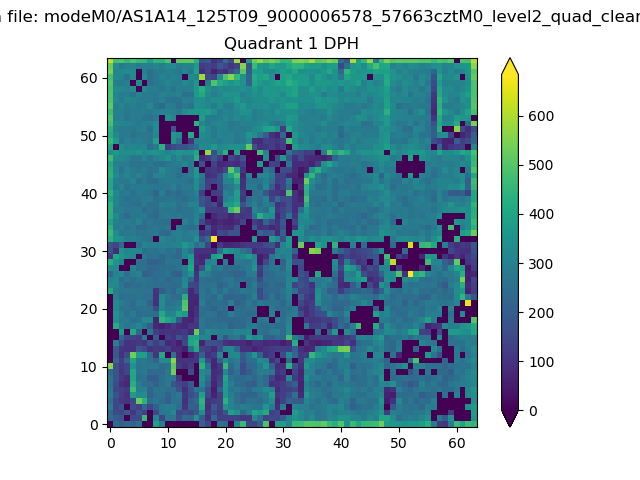 |
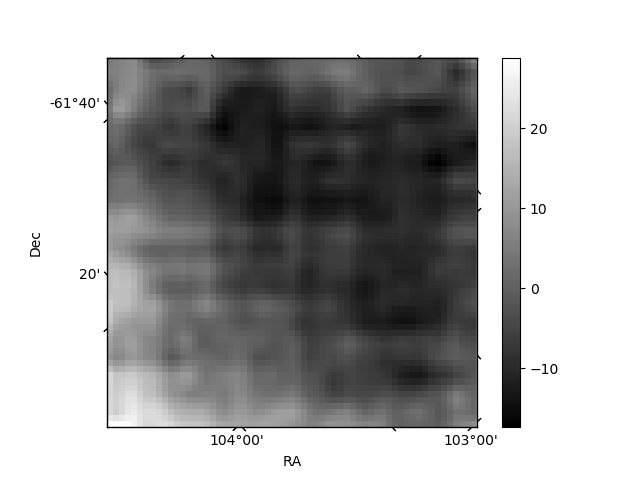
Quadrant B |
|---|---|---|---|
| Quadrant D | 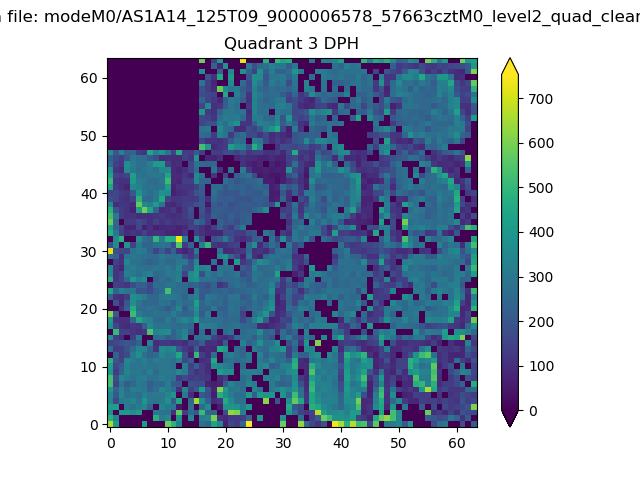 |
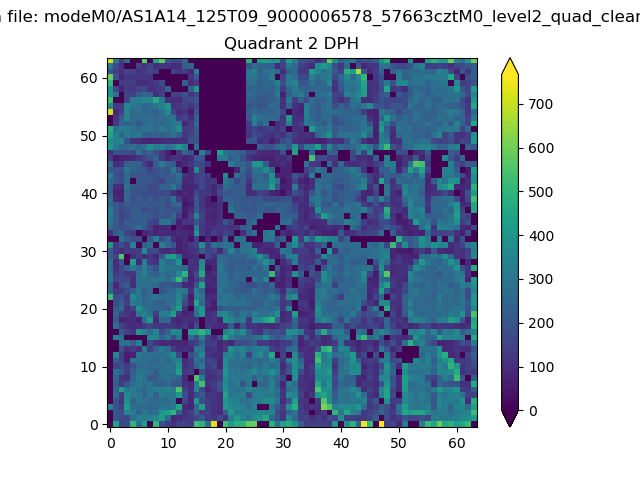 |
Quadrant C |
| Plot type | Count rate plots | Images |
|---|---|---|
| Comparison with Poisson distribution Blue bars denote a histogram of data divided into 1 sec bins. Red curve is a Poisson curve with rate = median count rate of data. |
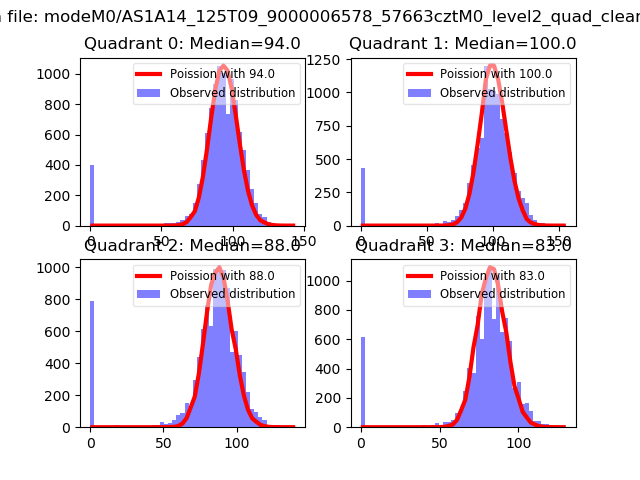 |
 |
| Quadrant-wise count rates Data is divided into 100 sec bins |
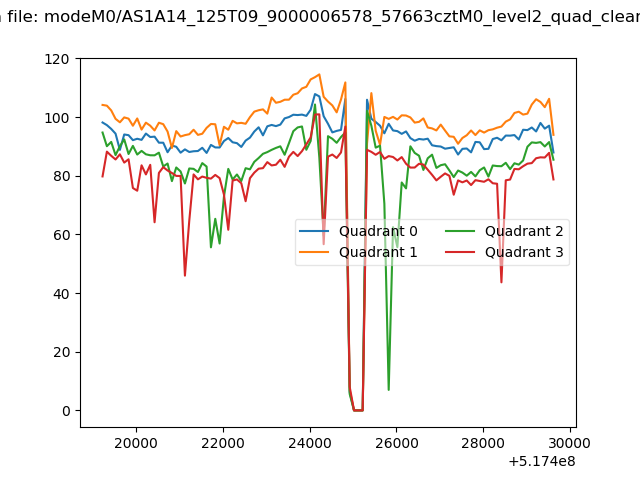 |
|
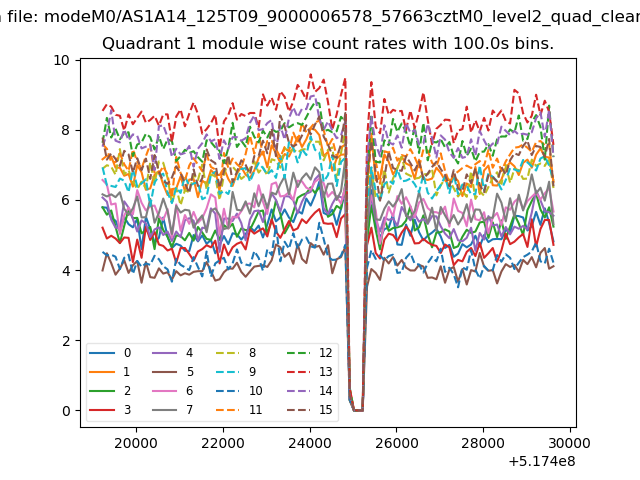
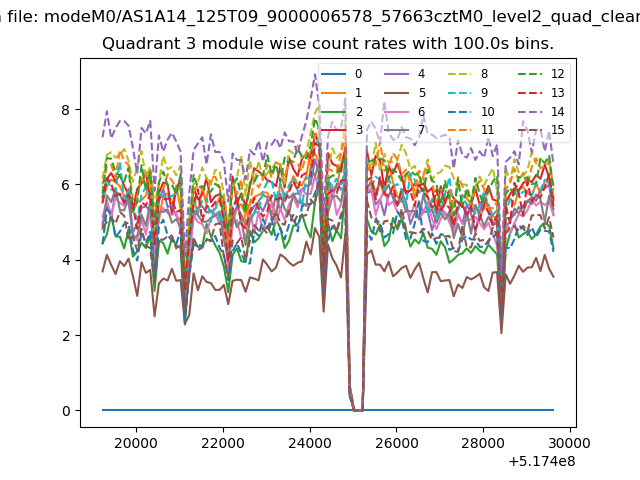
| Module-wise count rates for Quadrant A Data is divided into 100 sec bins |
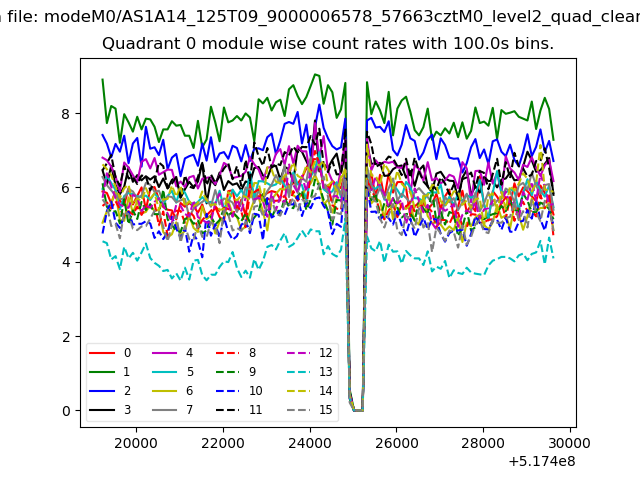 |
 |
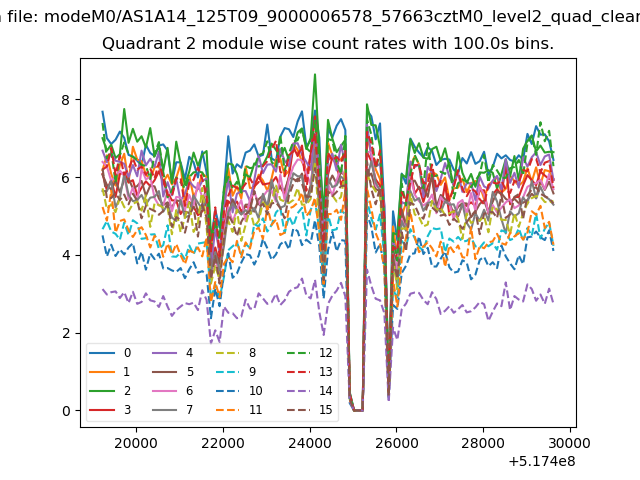
| Module-wise count rates for Quadrant B Data is divided into 100 sec bins |
 |
 |
| Module-wise count rates for Quadrant C Data is divided into 100 sec bins |
 |
 |
| Module-wise count rates for Quadrant D Data is divided into 100 sec bins |
 |
 |
| Parameter | Plot |
|---|---|
| CZT HV Monitor | 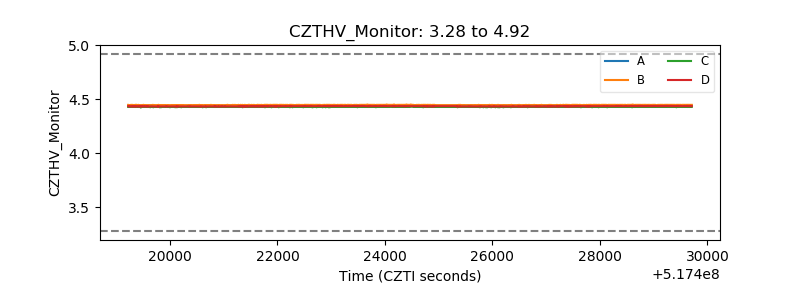 |
| D_VDD | 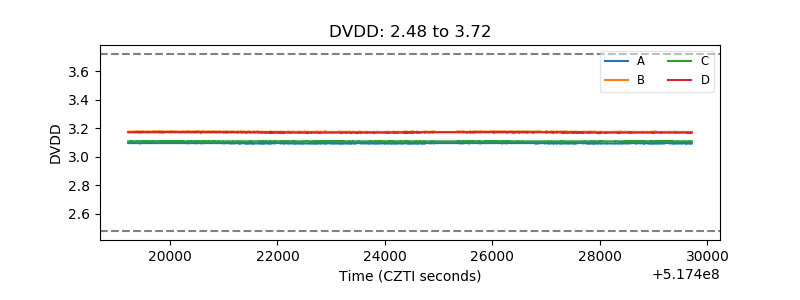 |
| Temperature 1 | 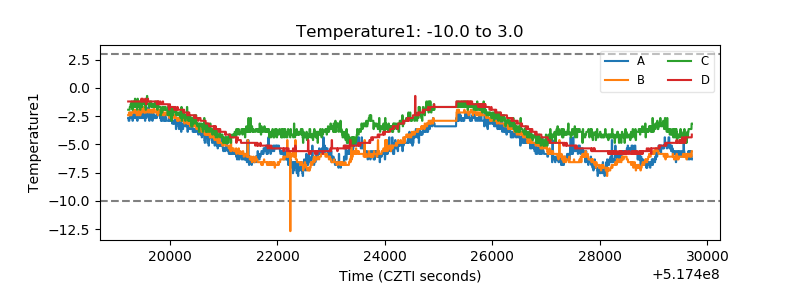 |
| Veto HV Monitor | 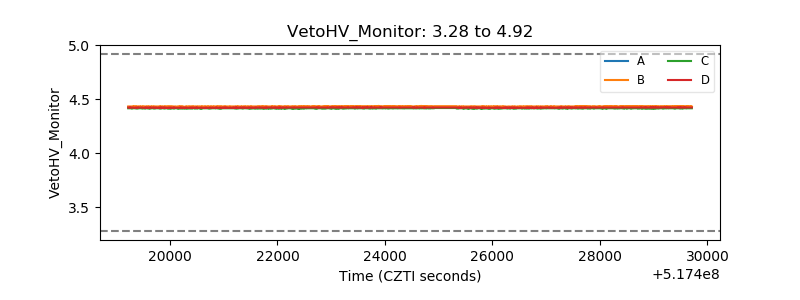 |
| Veto LLD | 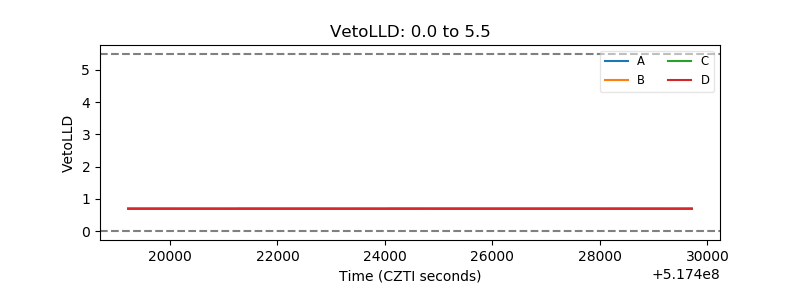 |
| Alpha Counter | 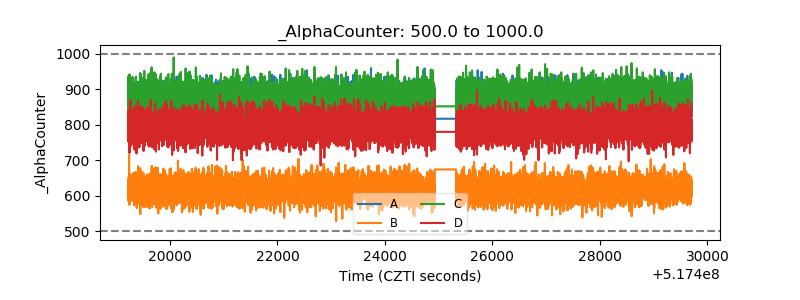 |
| _CPM_Rate | 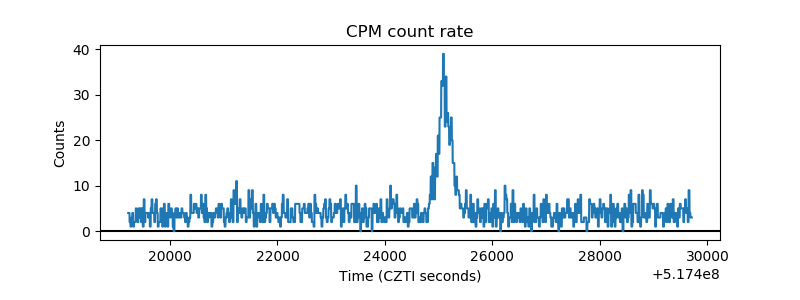 |
| CZT Counter | 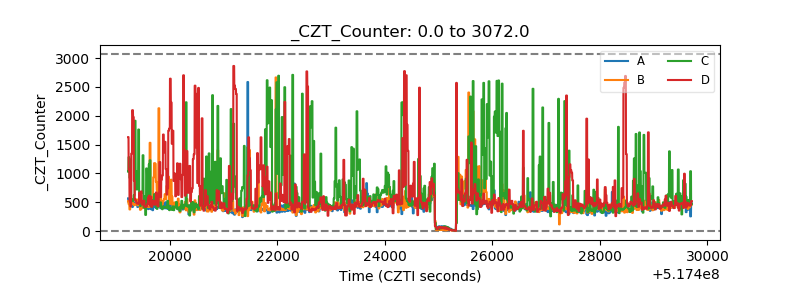 |
| +2.5 Volts monitor | 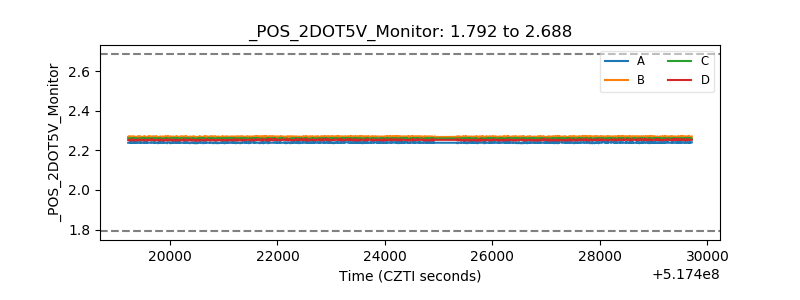 |
| +5 Volts monitor | 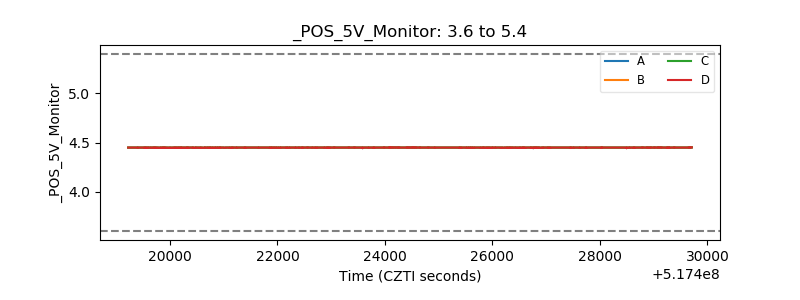 |
| _ROLL_ROT | 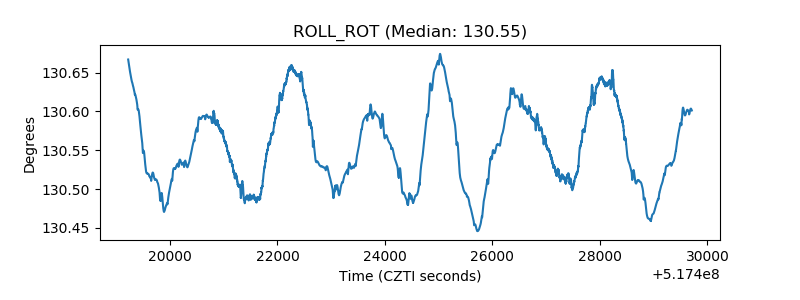 |
| _Roll_DEC | 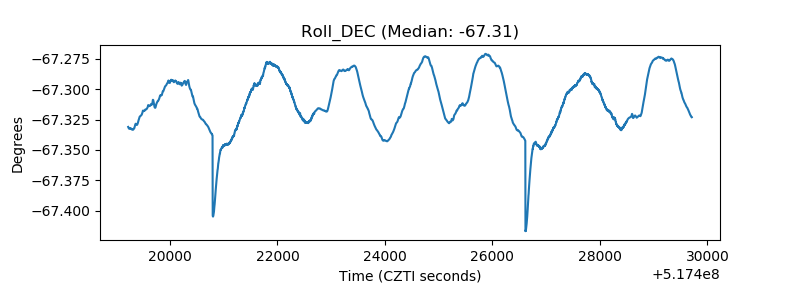 |
| _Roll_RA | 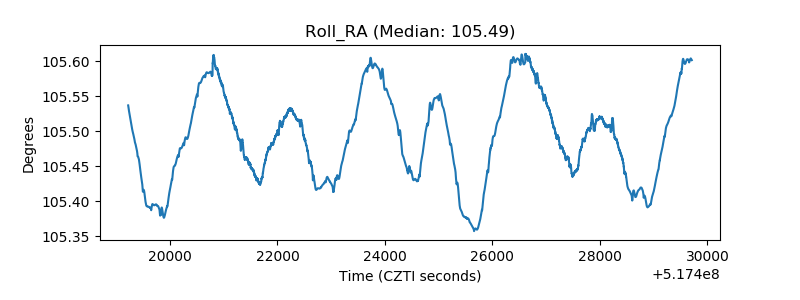 |
| Veto Counter | 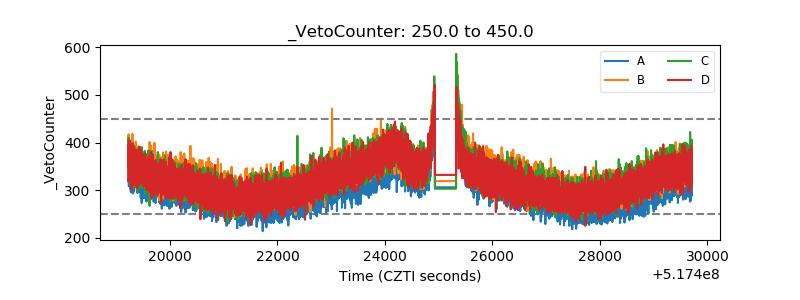 |