| Param | Original file | Final file |
|---|---|---|
| Filename | modeM0/AS1A14_125T09_9000006578_57664cztM0_level2.fits | modeM0/AS1A14_125T09_9000006578_57664cztM0_level2_quad_clean.evt |
| Size (bytes) | 627,768,000 | 129,188,160 |
| Size | 598.7 MB | 123.2 MB |
| Events in quadrant A | 3,972,892 | 869,037 |
| Events in quadrant B | 4,384,674 | 922,195 |
| Events in quadrant C | 6,713,344 | 810,813 |
| Events in quadrant D | 7,459,540 | 677,758 |
| Mode M9 | |||
|---|---|---|---|
| Quadrant | BADHDUFLAG | Total packets | Discarded packets |
| A | 0 | 15 | 0 |
| B | 0 | 15 | 0 |
| C | 0 | 15 | 0 |
| D | 0 | 15 | 0 |
| Mode SS | |||
|---|---|---|---|
| Quadrant | BADHDUFLAG | Total packets | Discarded packets |
| A | 0 | 184 | 0 |
| B | 0 | 184 | 0 |
| C | 0 | 184 | 0 |
| D | 0 | 184 | 0 |
| Mode M0 | |||
|---|---|---|---|
| Quadrant | BADHDUFLAG | Total packets | Discarded packets |
| A | 0 | 18519 | 1 |
| B | 0 | 19566 | 1 |
| C | 0 | 26335 | 1 |
| D | 0 | 28473 | 1 |
| Quadrant | Total seconds | Saturated seconds | Saturation percentage |
|---|---|---|---|
| A | 9112 | 48 | 0.526778% |
| B | 9113 | 201 | 2.205640% |
| C | 9113 | 412 | 4.521014% |
| D | 9113 | 1181 | 12.959508% |
Noise dominated data is calculated using 1-second bins in cleaned event files. If a bin has >2000 counts, and if more than 50% of those come from <1% of pixels, then it is considered to be noise-dominated and hence unusable.
| Quadrant | # 1 sec bins | Bins with >0 counts | Bins with >2000 counts | High rate bins dominated by noise | Noise dominated (total time) | Noise dominated (detector-on time) | Marked lightcurve |
|---|---|---|---|---|---|---|---|
| A | 10507 | 9113 | 1 | 1 | 0.01% | 0.01% | 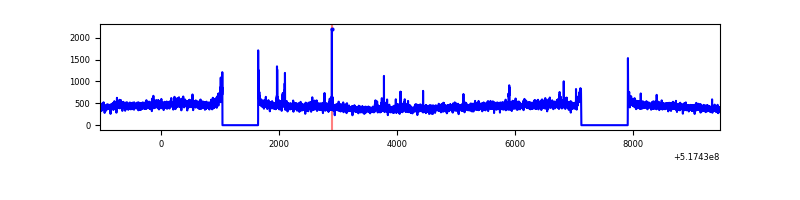 |
| B | 10508 | 9115 | 71 | 71 | 0.68% | 0.78% | 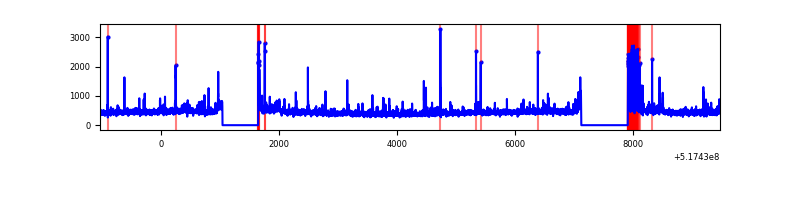 |
| C | 10508 | 9114 | 357 | 357 | 3.40% | 3.92% | 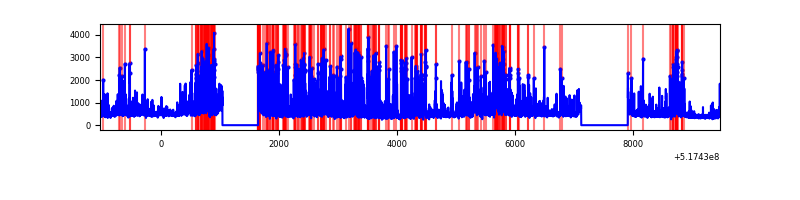 |
| D | 10508 | 9115 | 1051 | 1051 | 10.00% | 11.53% | 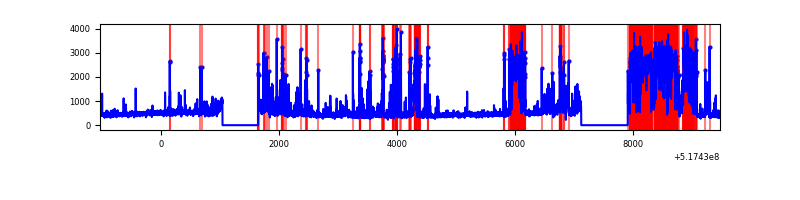 |
Top three noisy pixels from each quadrant. If the there are fewer than three noisy pixels in the level2.evt file, extra rows are filled as -1
| Pixel properties | Quadrant properties | ||||||
|---|---|---|---|---|---|---|---|
| Quadrant | DetID | PixID | Counts | Sigma | Mean | Median | Sigma |
| A | 3 | 14 | 39795 | 158.89 | 999 | 972 | 244.3 |
| A | 8 | 4 | 23333 | 91.52 | 999 | 972 | 244.3 |
| A | 8 | 9 | 18205 | 70.53 | 999 | 972 | 244.3 |
| B | 10 | 16 | 198395 | 938.28 | 979 | 941 | 210.4 |
| B | 5 | 172 | 111314 | 524.48 | 979 | 941 | 210.4 |
| B | 0 | 156 | 33239 | 153.48 | 979 | 941 | 210.4 |
| C | 15 | 224 | 1155143 | 4447.97 | 953 | 944 | 259.5 |
| C | 12 | 254 | 1078793 | 4153.74 | 953 | 944 | 259.5 |
| C | 14 | 254 | 546063 | 2100.74 | 953 | 944 | 259.5 |
| D | 8 | 240 | 3030615 | 12008.94 | 895 | 857 | 252.3 |
| D | 2 | 249 | 271880 | 1074.24 | 895 | 857 | 252.3 |
| D | 3 | 12 | 114325 | 449.75 | 895 | 857 | 252.3 |
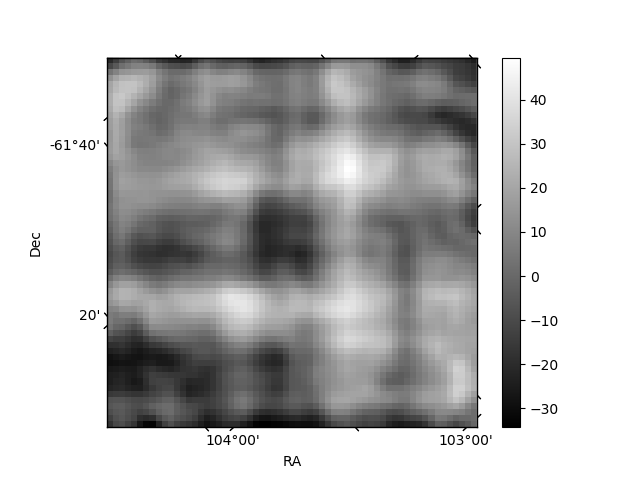
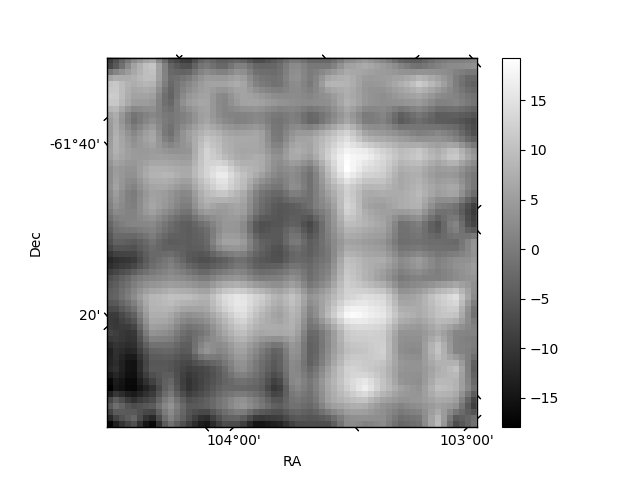
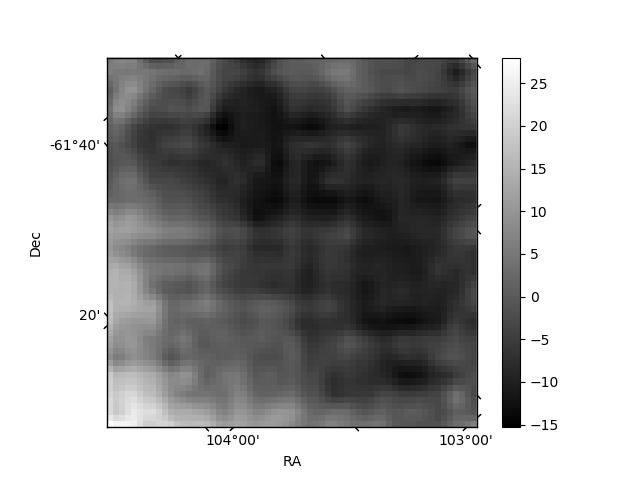
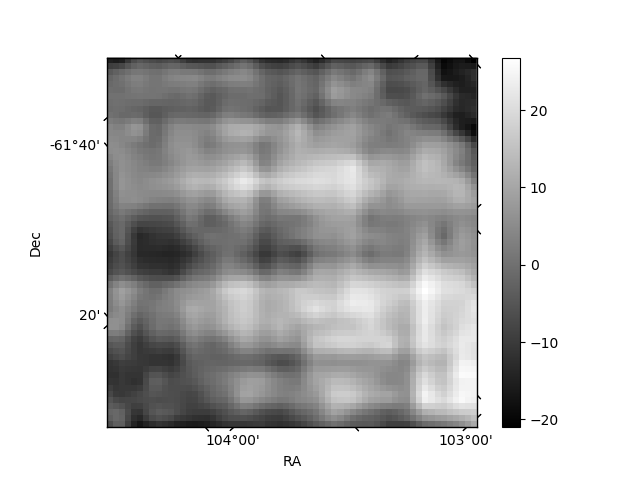
Histogram calculated using DETX and DETY for each event in the final _common_clean file
| Quadrant A | 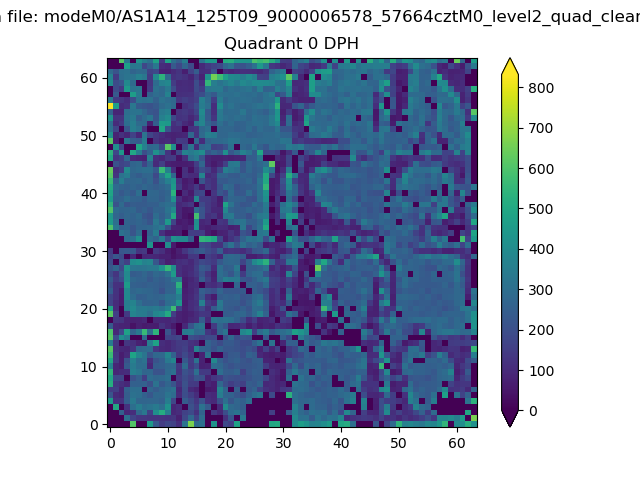 |
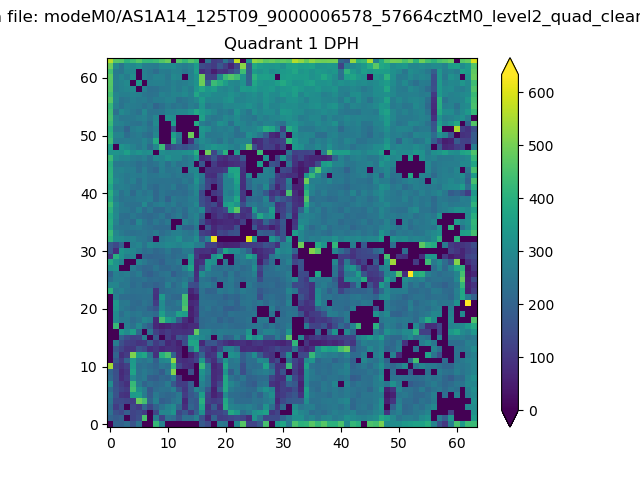 |
Quadrant B |
|---|---|---|---|
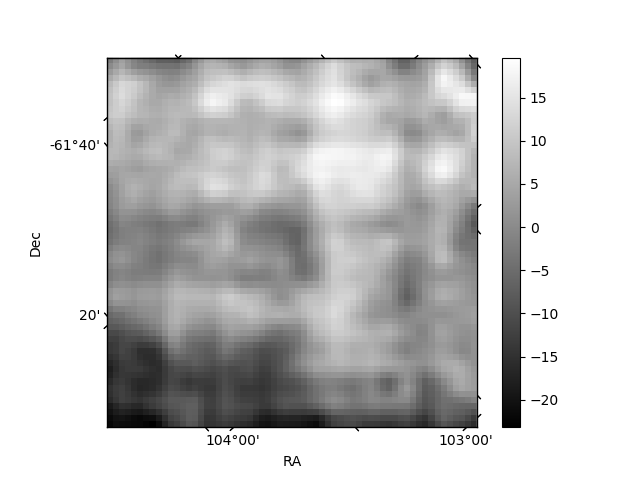
| Quadrant D | 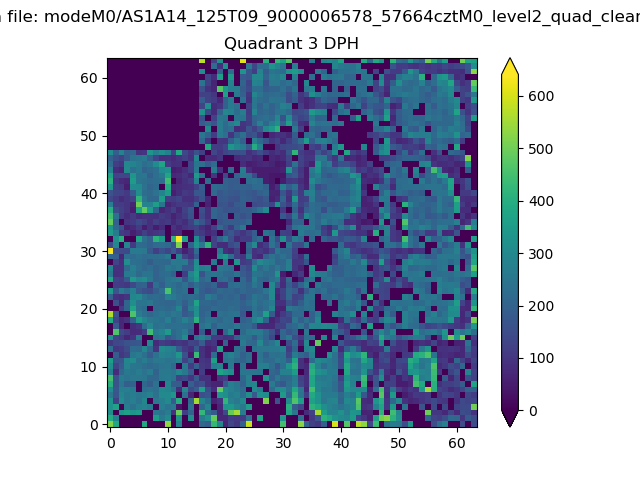 |
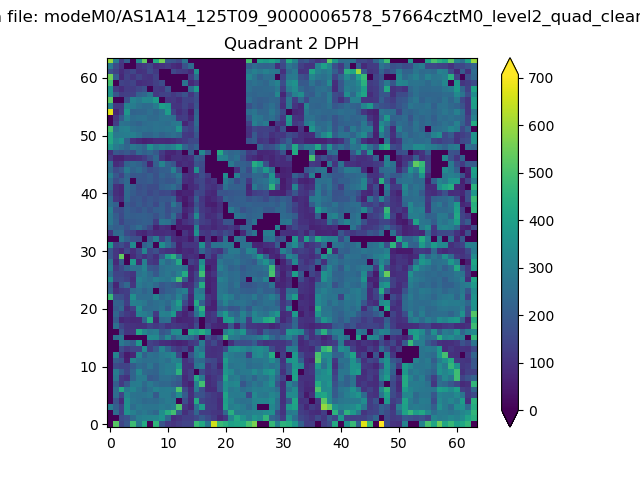 |
Quadrant C |
| Plot type | Count rate plots | Images |
|---|---|---|
| Comparison with Poisson distribution Blue bars denote a histogram of data divided into 1 sec bins. Red curve is a Poisson curve with rate = median count rate of data. |
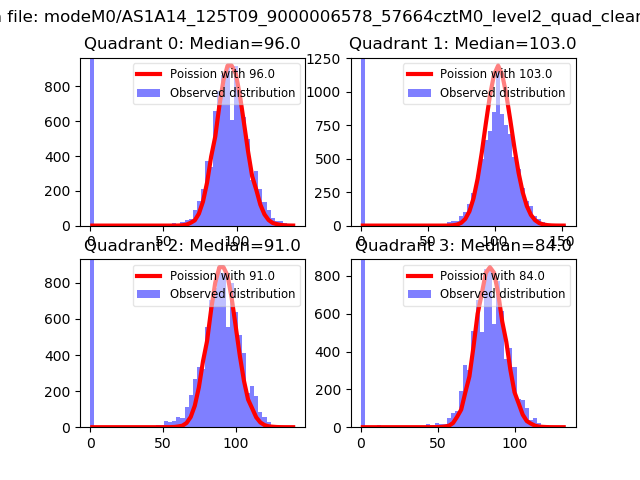 |
 |
| Quadrant-wise count rates Data is divided into 100 sec bins |
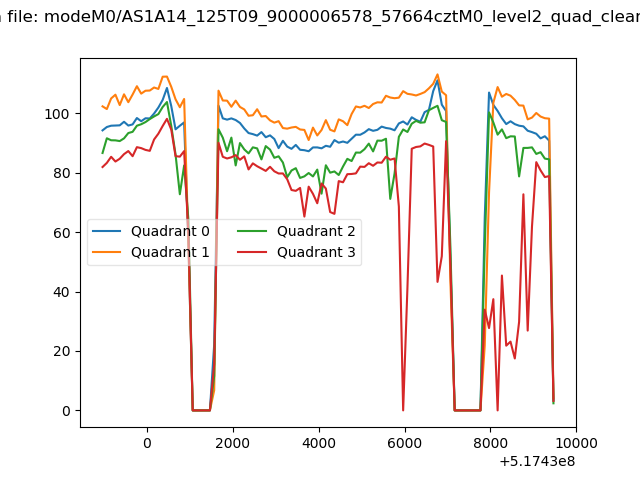 |
|
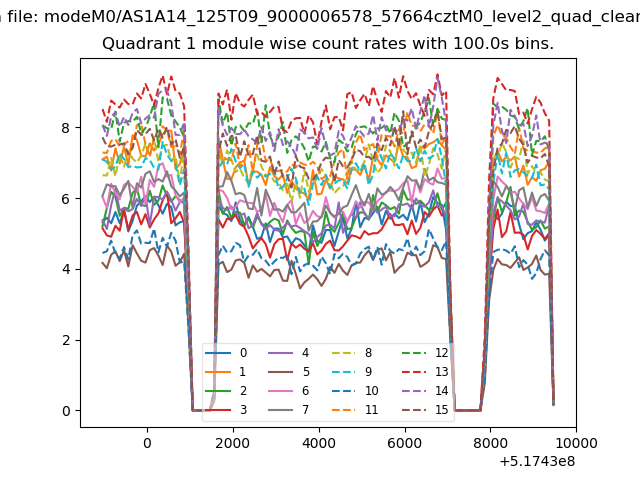
| Module-wise count rates for Quadrant A Data is divided into 100 sec bins |
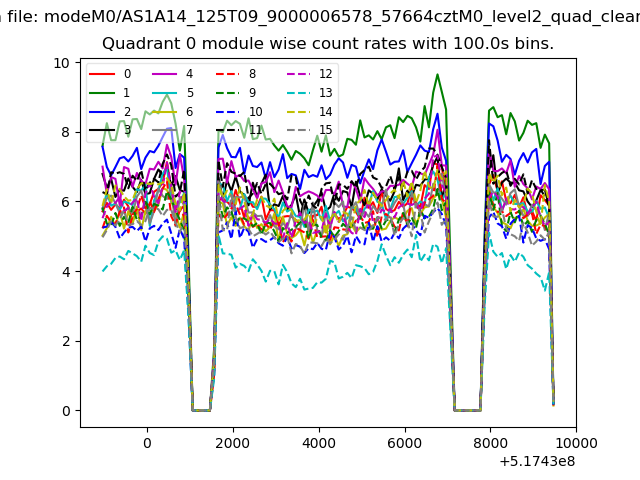 |
 |
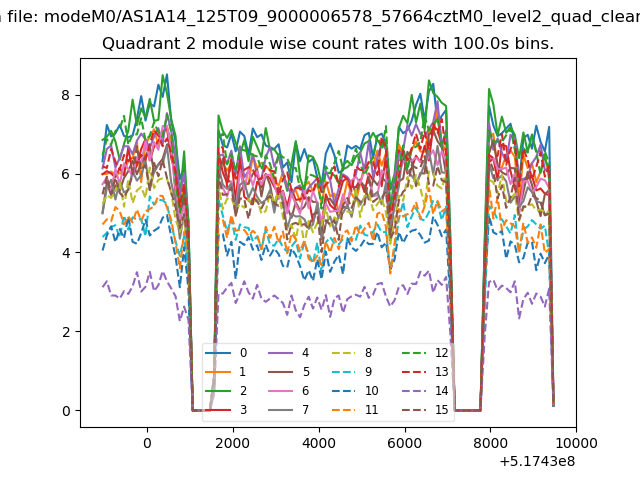
| Module-wise count rates for Quadrant B Data is divided into 100 sec bins |
 |
 |
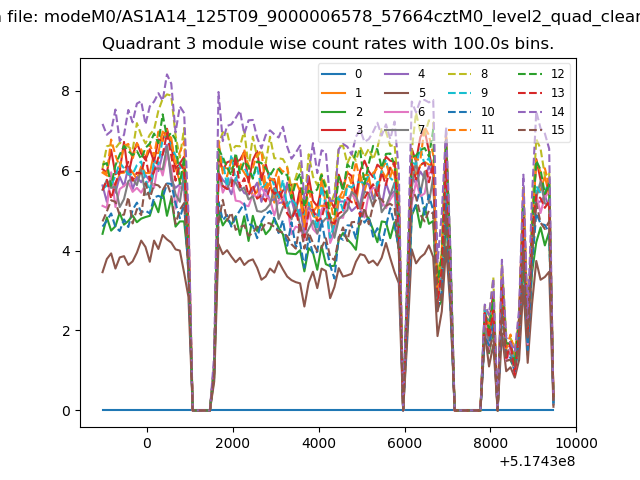
| Module-wise count rates for Quadrant C Data is divided into 100 sec bins |
 |
 |
| Module-wise count rates for Quadrant D Data is divided into 100 sec bins |
 |
 |
| Parameter | Plot |
|---|---|
| CZT HV Monitor | 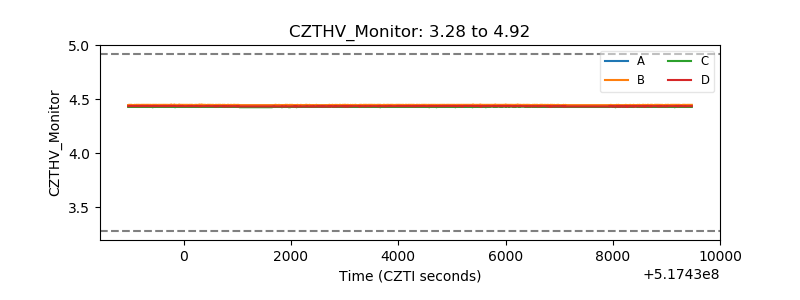 |
| D_VDD | 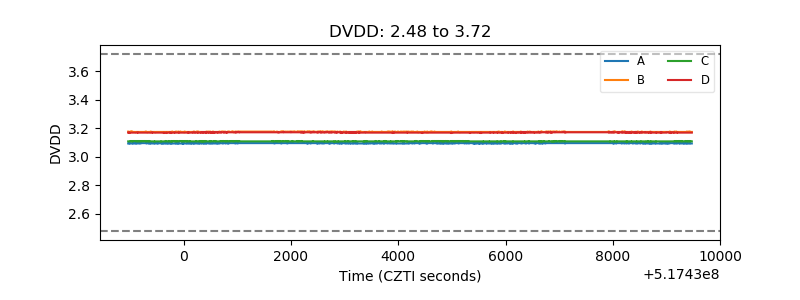 |
| Temperature 1 | 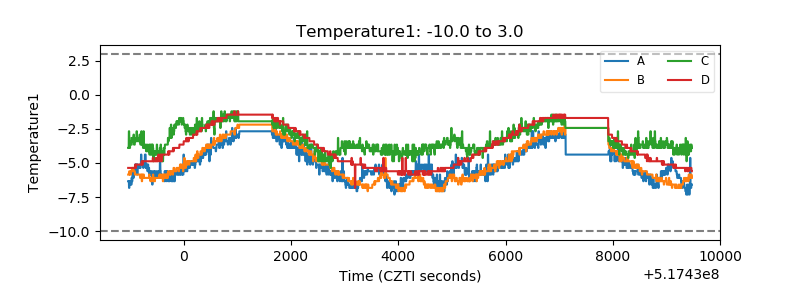 |
| Veto HV Monitor | 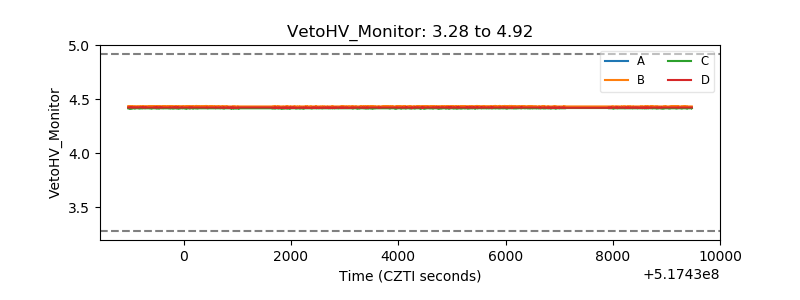 |
| Veto LLD | 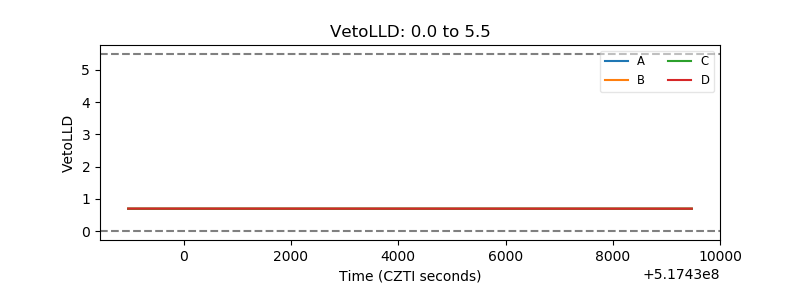 |
| Alpha Counter | 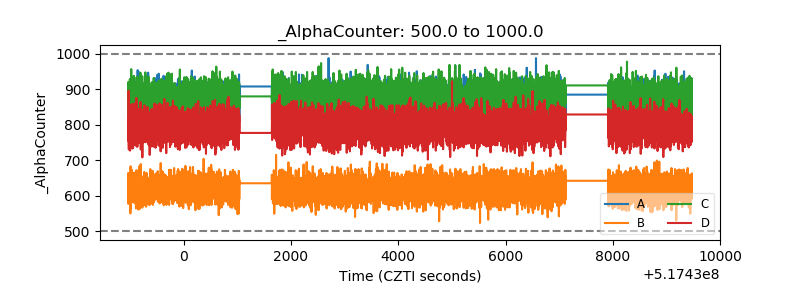 |
| _CPM_Rate | 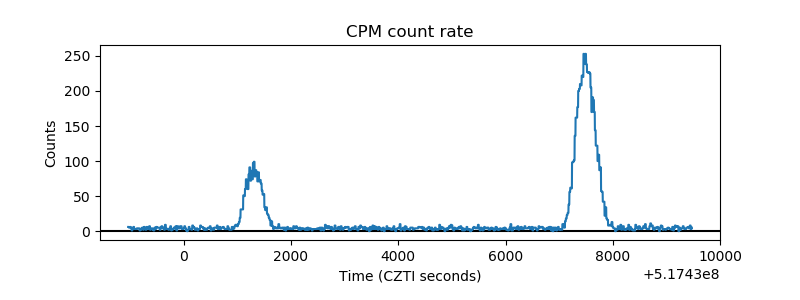 |
| CZT Counter | 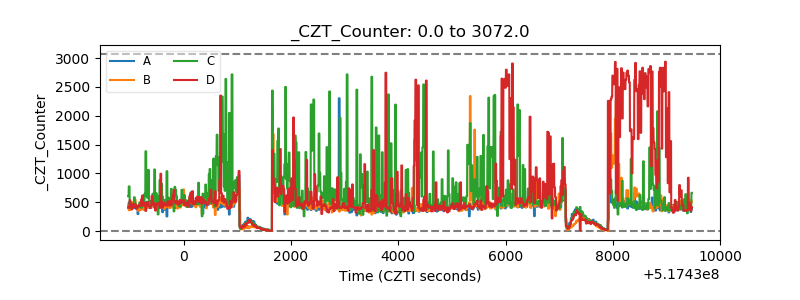 |
| +2.5 Volts monitor | 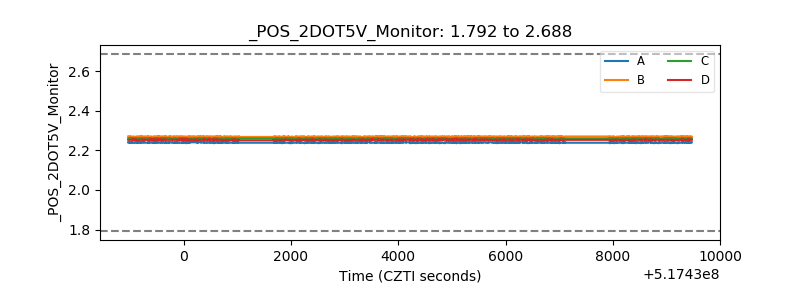 |
| +5 Volts monitor | 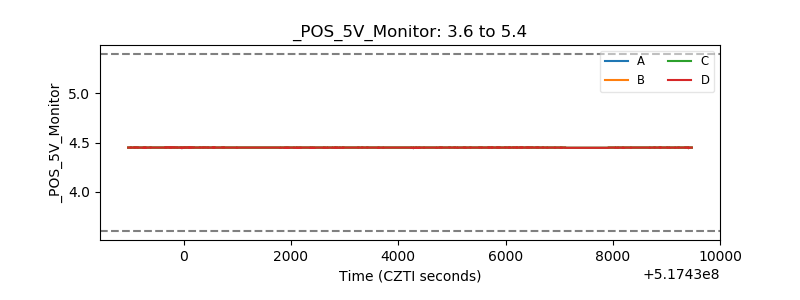 |
| _ROLL_ROT | 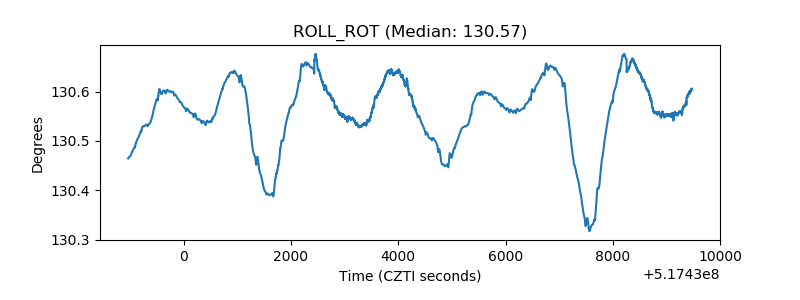 |
| _Roll_DEC | 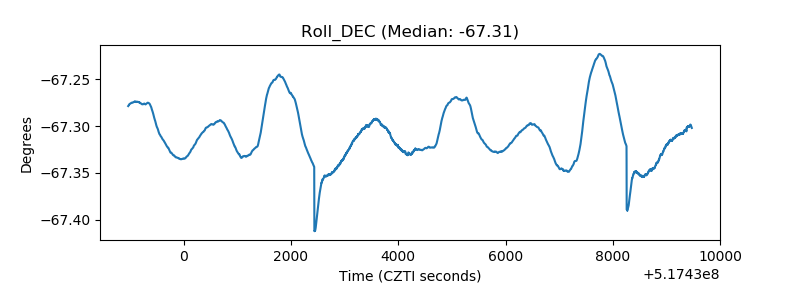 |
| _Roll_RA | 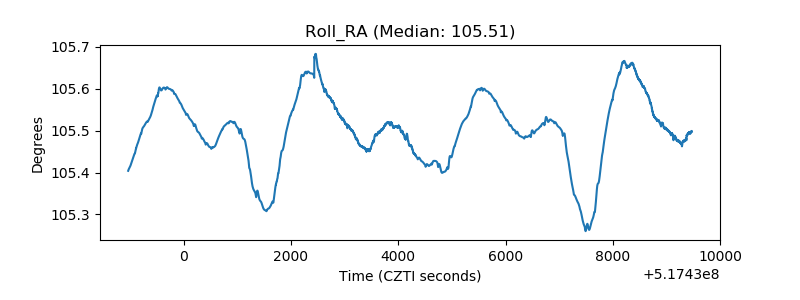 |
| Veto Counter | 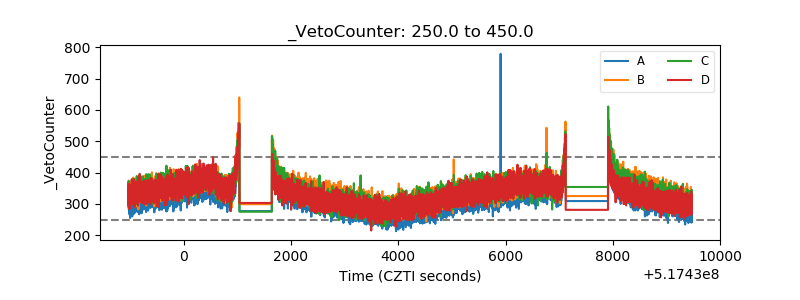 |