| Param | Original file | Final file |
|---|---|---|
| Filename | modeM0/AS1A14_125T09_9000006578_57665cztM0_level2.fits | modeM0/AS1A14_125T09_9000006578_57665cztM0_level2_quad_clean.evt |
| Size (bytes) | 448,473,600 | 93,648,960 |
| Size | 427.7 MB | 89.3 MB |
| Events in quadrant A | 2,787,363 | 637,521 |
| Events in quadrant B | 3,213,204 | 670,158 |
| Events in quadrant C | 4,209,597 | 585,332 |
| Events in quadrant D | 5,877,064 | 482,282 |
| Mode M9 | |||
|---|---|---|---|
| Quadrant | BADHDUFLAG | Total packets | Discarded packets |
| A | 0 | 10 | 0 |
| B | 0 | 11 | 0 |
| C | 0 | 11 | 0 |
| D | 0 | 11 | 0 |
| Mode SS | |||
|---|---|---|---|
| Quadrant | BADHDUFLAG | Total packets | Discarded packets |
| A | 0 | 134 | 0 |
| B | 0 | 134 | 0 |
| C | 0 | 134 | 0 |
| D | 0 | 134 | 0 |
| Mode M0 | |||
|---|---|---|---|
| Quadrant | BADHDUFLAG | Total packets | Discarded packets |
| A | 0 | 13367 | 2 |
| B | 0 | 14381 | 2 |
| C | 0 | 17336 | 2 |
| D | 0 | 22236 | 2 |
| Quadrant | Total seconds | Saturated seconds | Saturation percentage |
|---|---|---|---|
| A | 6603 | 30 | 0.454339% |
| B | 6603 | 183 | 2.771468% |
| C | 6603 | 273 | 4.134484% |
| D | 6603 | 1016 | 15.386945% |
Noise dominated data is calculated using 1-second bins in cleaned event files. If a bin has >2000 counts, and if more than 50% of those come from <1% of pixels, then it is considered to be noise-dominated and hence unusable.
| Quadrant | # 1 sec bins | Bins with >0 counts | Bins with >2000 counts | High rate bins dominated by noise | Noise dominated (total time) | Noise dominated (detector-on time) | Marked lightcurve |
|---|---|---|---|---|---|---|---|
| A | 7543 | 6603 | 0 | 0 | 0.00% | 0.00% | 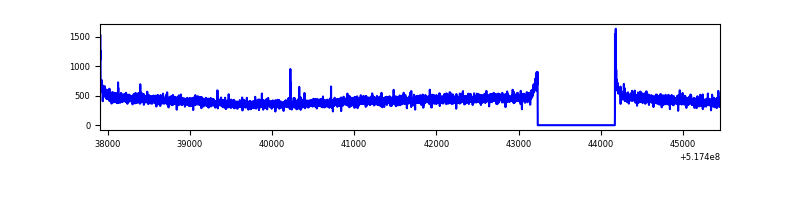 |
| B | 7543 | 6604 | 82 | 82 | 1.09% | 1.24% | 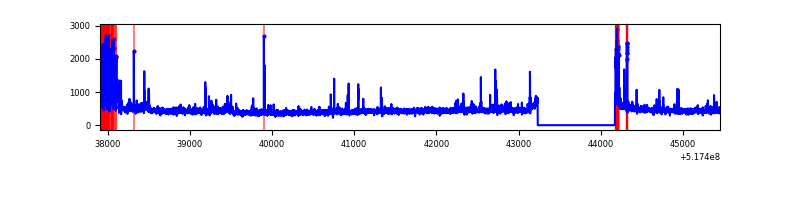 |
| C | 7543 | 6604 | 191 | 191 | 2.53% | 2.89% | 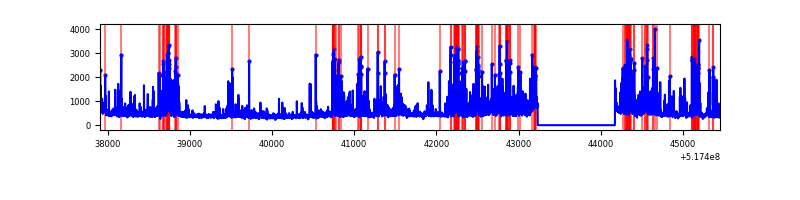 |
| D | 7543 | 6604 | 992 | 992 | 13.15% | 15.02% | 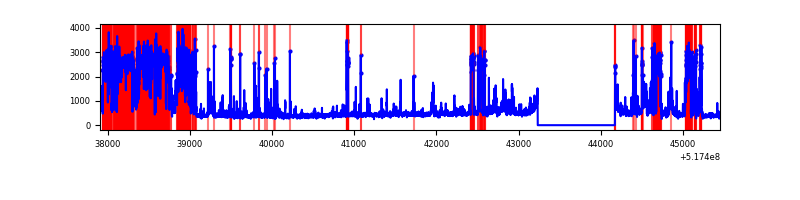 |
Top three noisy pixels from each quadrant. If the there are fewer than three noisy pixels in the level2.evt file, extra rows are filled as -1
| Pixel properties | Quadrant properties | ||||||
|---|---|---|---|---|---|---|---|
| Quadrant | DetID | PixID | Counts | Sigma | Mean | Median | Sigma |
| A | 3 | 137 | 8762 | 45.59 | 715 | 694 | 177.0 |
| A | 3 | 128 | 8076 | 41.72 | 715 | 694 | 177.0 |
| A | 4 | 3 | 7372 | 37.74 | 715 | 694 | 177.0 |
| B | 10 | 16 | 227005 | 1505.85 | 699 | 671 | 150.3 |
| B | 5 | 172 | 91802 | 606.32 | 699 | 671 | 150.3 |
| B | 5 | 185 | 33103 | 215.78 | 699 | 671 | 150.3 |
| C | 15 | 224 | 1404888 | 7619.9 | 677 | 671 | 184.3 |
| C | 12 | 254 | 61284 | 328.91 | 677 | 671 | 184.3 |
| C | 14 | 254 | 60375 | 323.98 | 677 | 671 | 184.3 |
| D | 8 | 240 | 2927504 | 16307.34 | 628 | 599 | 179.5 |
| D | 2 | 249 | 118620 | 657.56 | 628 | 599 | 179.5 |
| D | 3 | 12 | 116774 | 647.27 | 628 | 599 | 179.5 |
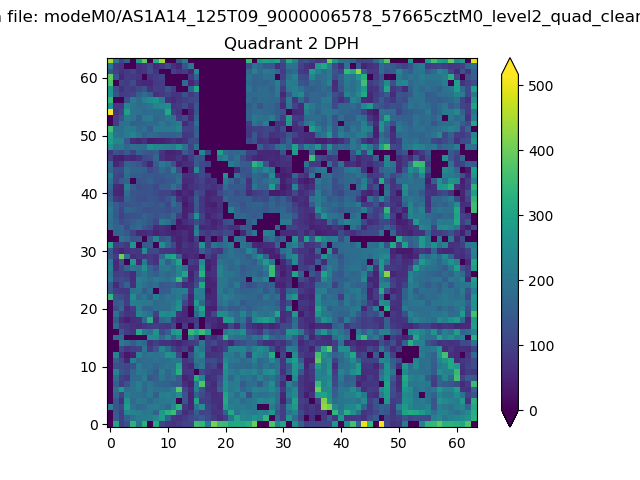
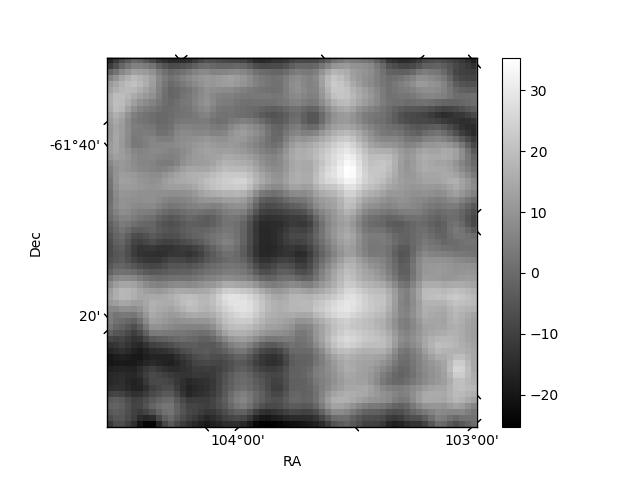
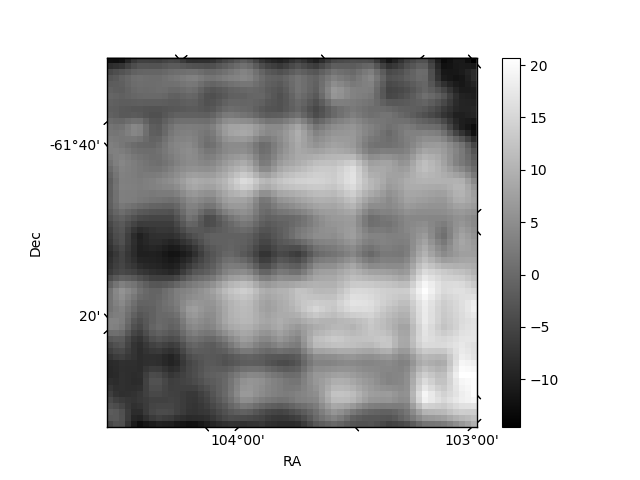
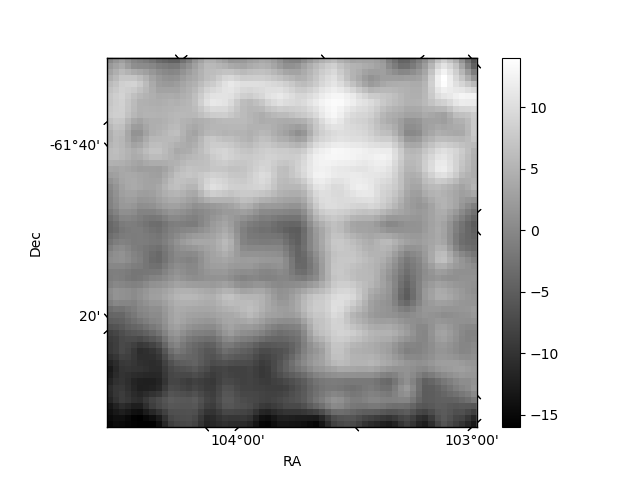
Histogram calculated using DETX and DETY for each event in the final _common_clean file
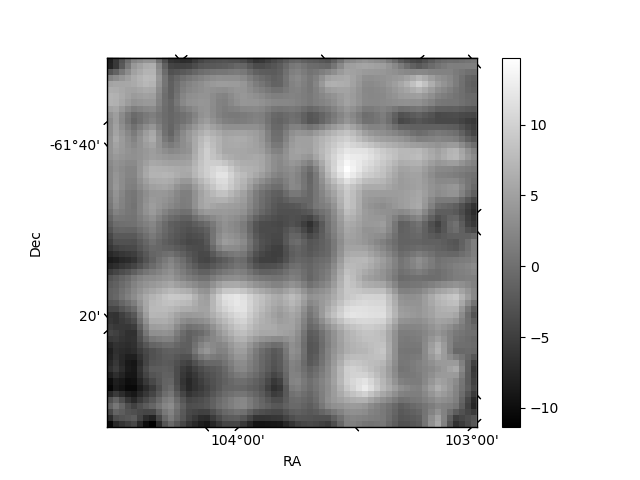
| Quadrant A | 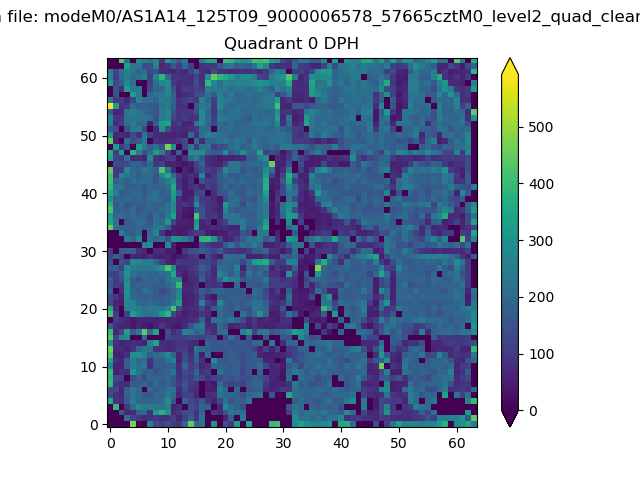 |
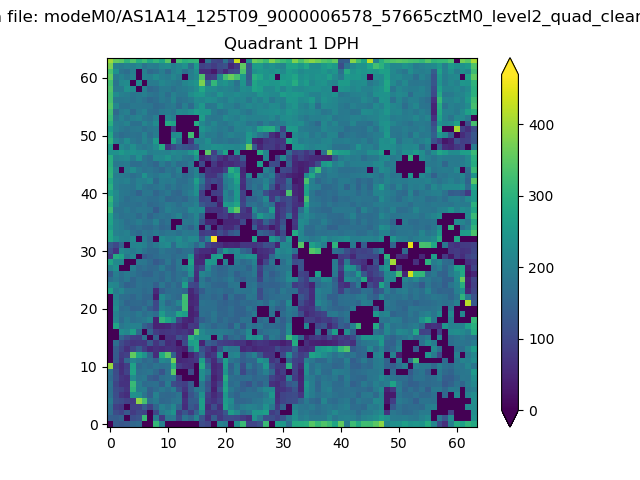 |
Quadrant B |
|---|---|---|---|
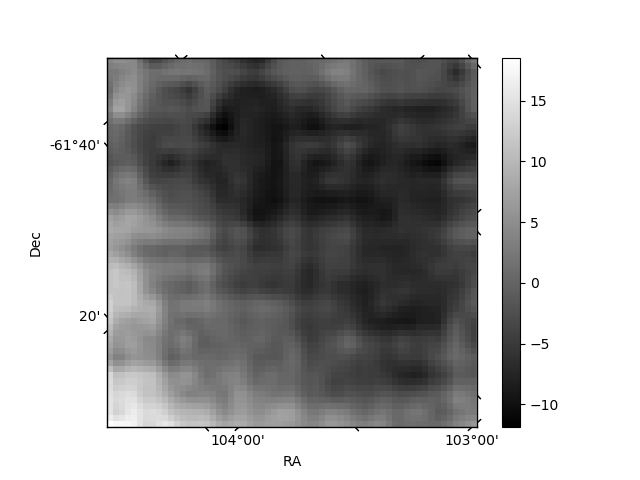
| Quadrant D | 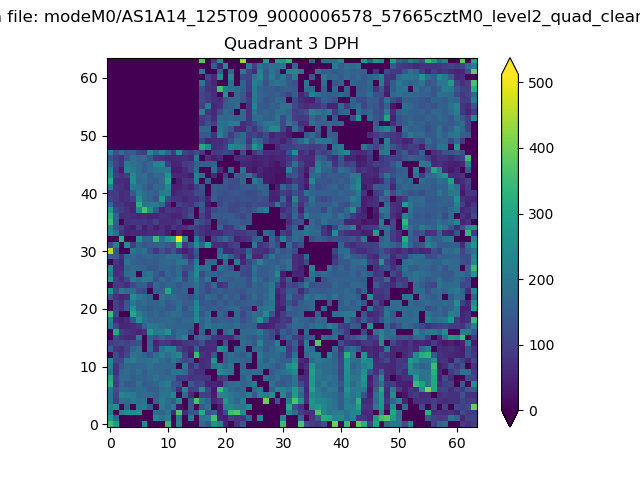 |
 |
Quadrant C |
| Plot type | Count rate plots | Images |
|---|---|---|
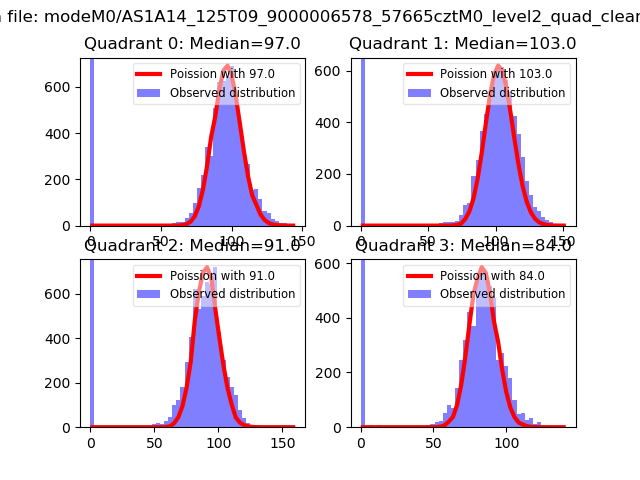
| Comparison with Poisson distribution Blue bars denote a histogram of data divided into 1 sec bins. Red curve is a Poisson curve with rate = median count rate of data. |
 |
 |
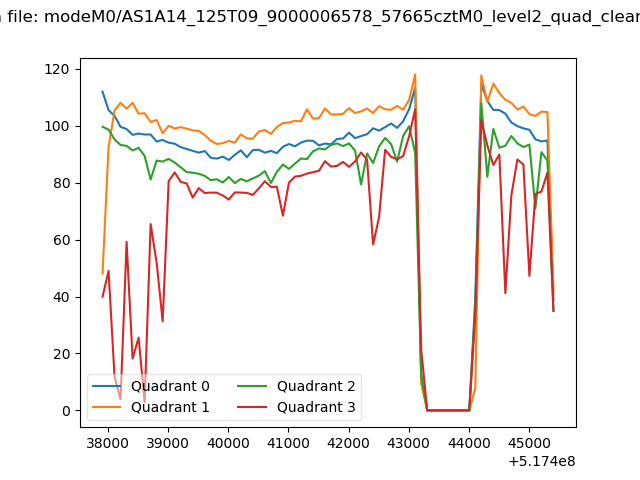
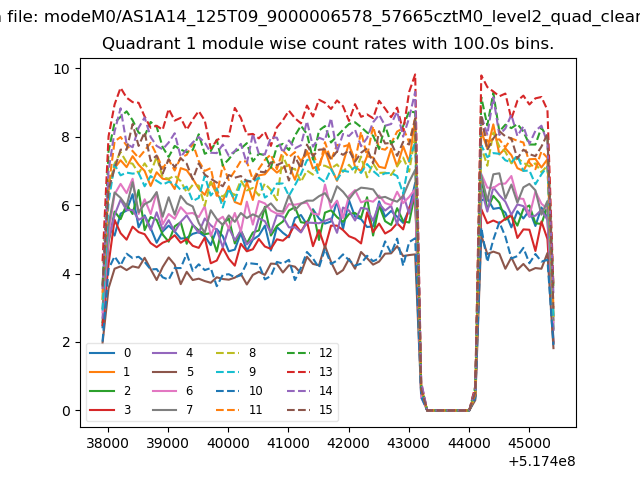
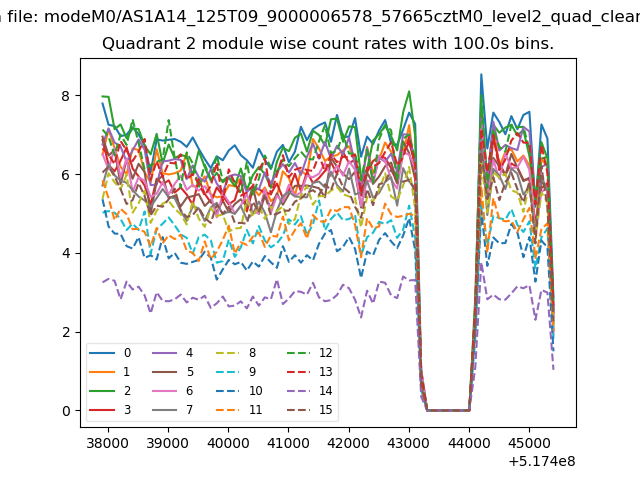
| Quadrant-wise count rates Data is divided into 100 sec bins |
 |
|
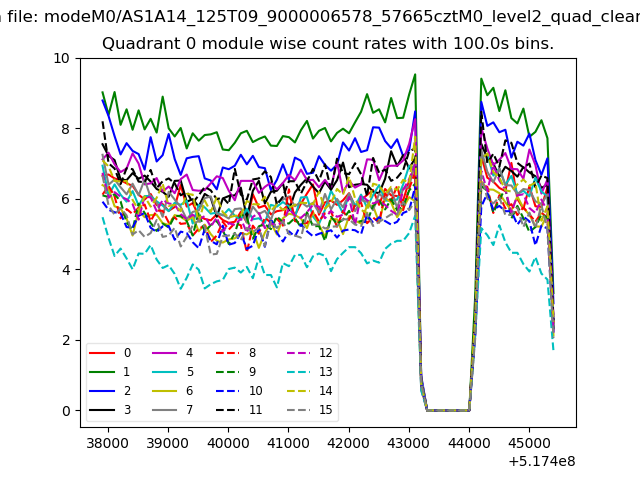
| Module-wise count rates for Quadrant A Data is divided into 100 sec bins |
 |
 |
| Module-wise count rates for Quadrant B Data is divided into 100 sec bins |
 |
 |
| Module-wise count rates for Quadrant C Data is divided into 100 sec bins |
 |
 |
| Module-wise count rates for Quadrant D Data is divided into 100 sec bins |
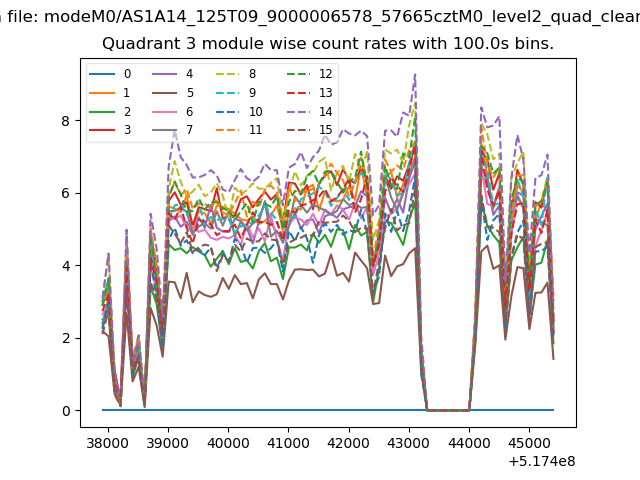 |
 |
| Parameter | Plot |
|---|---|
| CZT HV Monitor | 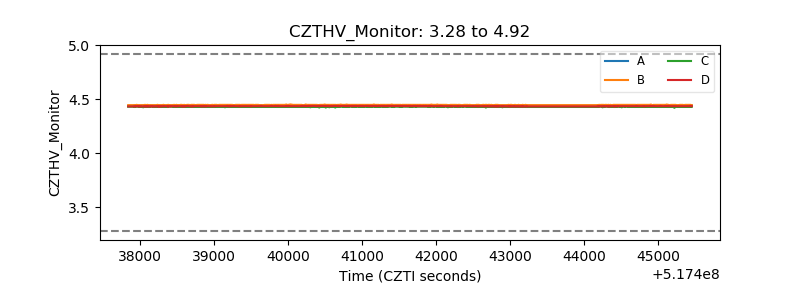 |
| D_VDD | 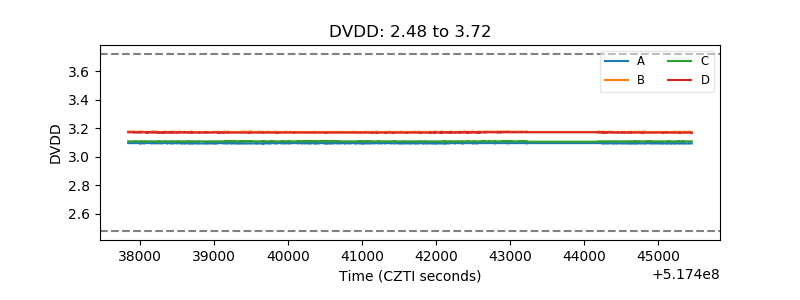 |
| Temperature 1 | 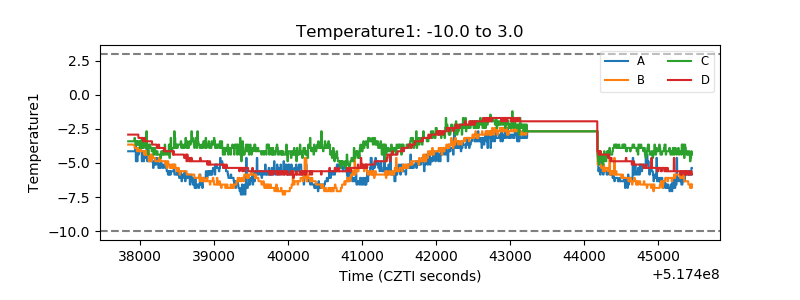 |
| Veto HV Monitor | 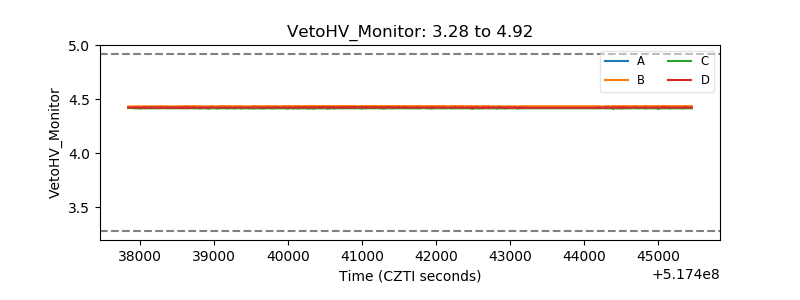 |
| Veto LLD | 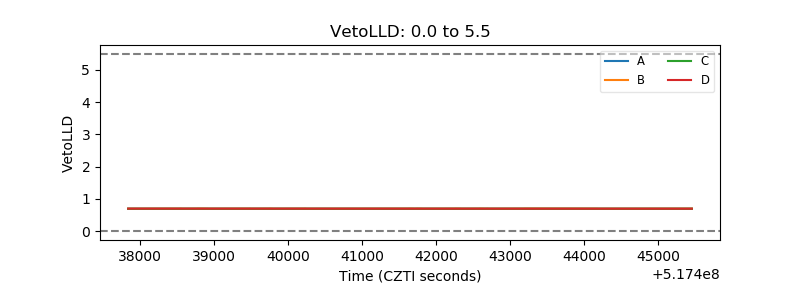 |
| Alpha Counter | 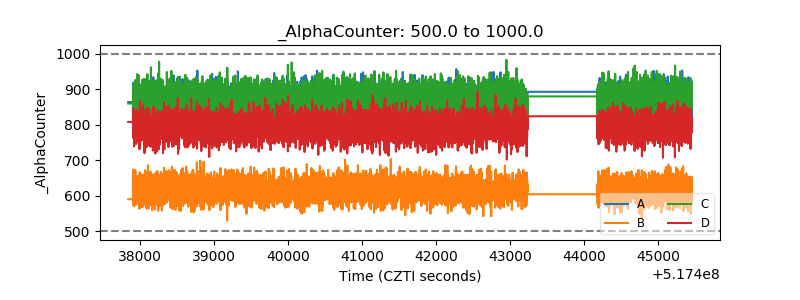 |
| _CPM_Rate | 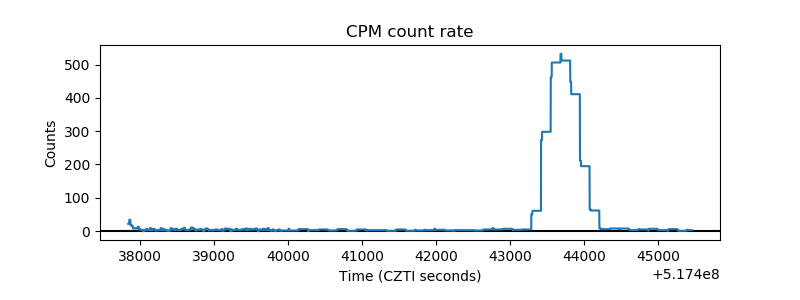 |
| CZT Counter | 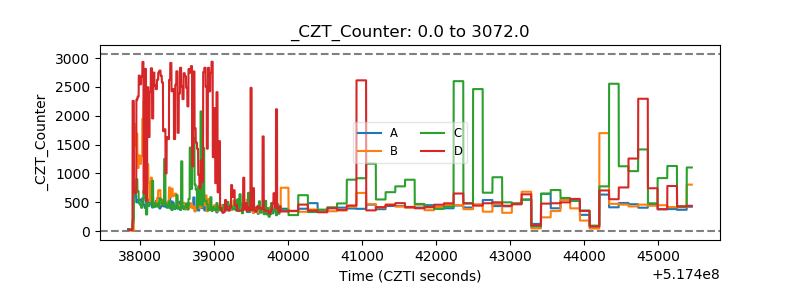 |
| +2.5 Volts monitor |  |
| +5 Volts monitor |  |
| _ROLL_ROT | 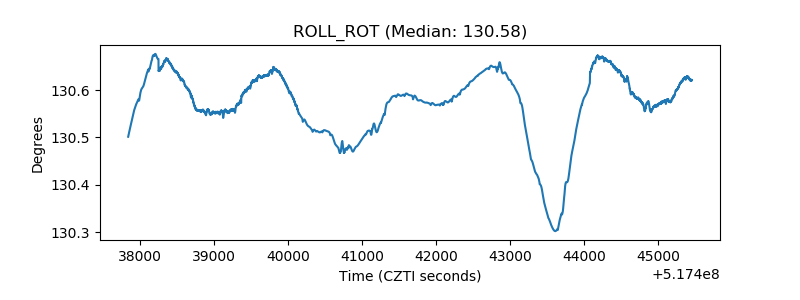 |
| _Roll_DEC | 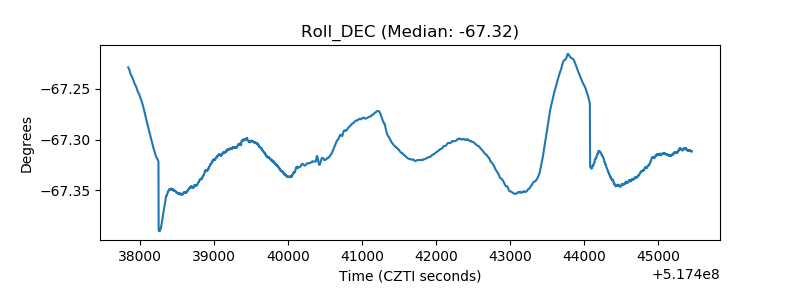 |
| _Roll_RA | 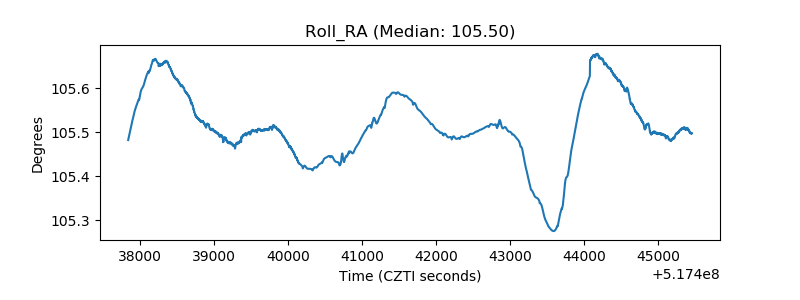 |
| Veto Counter | 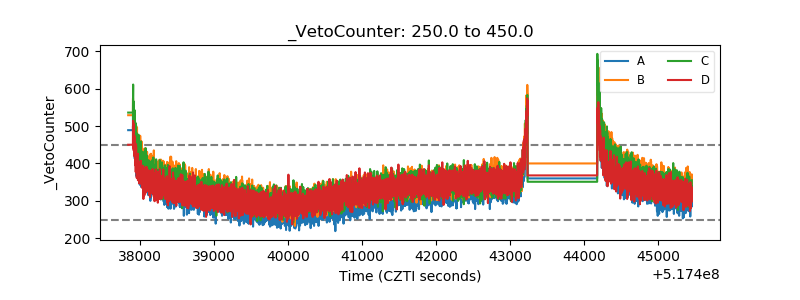 |