| Param | Original file | Final file |
|---|---|---|
| Filename | modeM0/AS1A14_125T09_9000006578_57667cztM0_level2.fits | modeM0/AS1A14_125T09_9000006578_57667cztM0_level2_quad_clean.evt |
| Size (bytes) | 441,377,280 | 99,195,840 |
| Size | 420.9 MB | 94.6 MB |
| Events in quadrant A | 2,977,134 | 669,313 |
| Events in quadrant B | 3,238,404 | 710,913 |
| Events in quadrant C | 5,717,329 | 570,308 |
| Events in quadrant D | 3,878,037 | 581,515 |
| Mode M9 | |||
|---|---|---|---|
| Quadrant | BADHDUFLAG | Total packets | Discarded packets |
| A | 0 | 22 | 0 |
| B | 0 | 22 | 0 |
| C | 0 | 22 | 0 |
| D | 0 | 22 | 0 |
| Mode SS | |||
|---|---|---|---|
| Quadrant | BADHDUFLAG | Total packets | Discarded packets |
| A | 0 | 136 | 0 |
| B | 0 | 136 | 0 |
| C | 0 | 136 | 0 |
| D | 0 | 136 | 0 |
| Mode M0 | |||
|---|---|---|---|
| Quadrant | BADHDUFLAG | Total packets | Discarded packets |
| A | 0 | 13944 | 1 |
| B | 0 | 14505 | 1 |
| C | 0 | 21726 | 1 |
| D | 0 | 16501 | 1 |
| Quadrant | Total seconds | Saturated seconds | Saturation percentage |
|---|---|---|---|
| A | 6776 | 41 | 0.605077% |
| B | 6777 | 134 | 1.977276% |
| C | 6777 | 820 | 12.099749% |
| D | 6777 | 196 | 2.892135% |
Noise dominated data is calculated using 1-second bins in cleaned event files. If a bin has >2000 counts, and if more than 50% of those come from <1% of pixels, then it is considered to be noise-dominated and hence unusable.
| Quadrant | # 1 sec bins | Bins with >0 counts | Bins with >2000 counts | High rate bins dominated by noise | Noise dominated (total time) | Noise dominated (detector-on time) | Marked lightcurve |
|---|---|---|---|---|---|---|---|
| A | 8836 | 6777 | 9 | 9 | 0.10% | 0.13% | 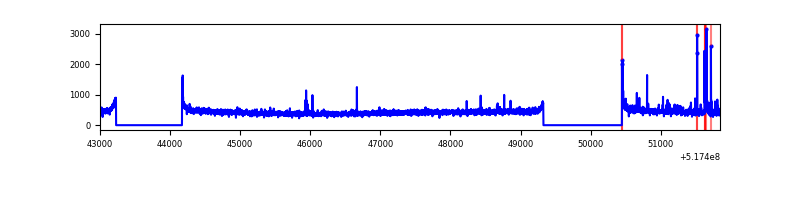 |
| B | 8837 | 6779 | 52 | 52 | 0.59% | 0.77% | 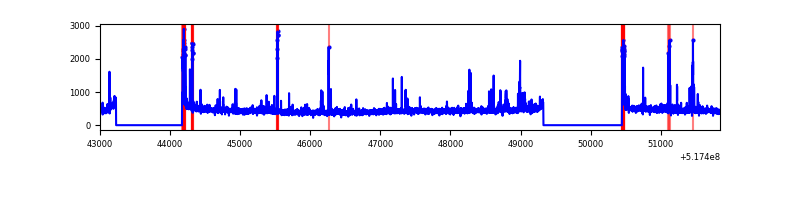 |
| C | 8837 | 6779 | 720 | 720 | 8.15% | 10.62% | 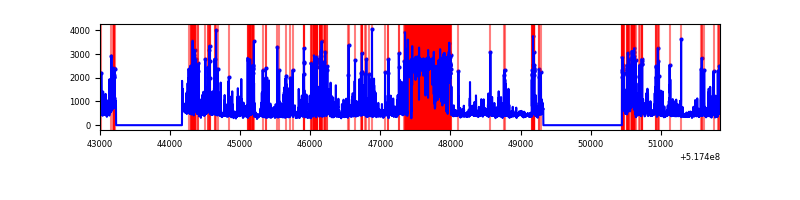 |
| D | 8837 | 6779 | 192 | 192 | 2.17% | 2.83% | 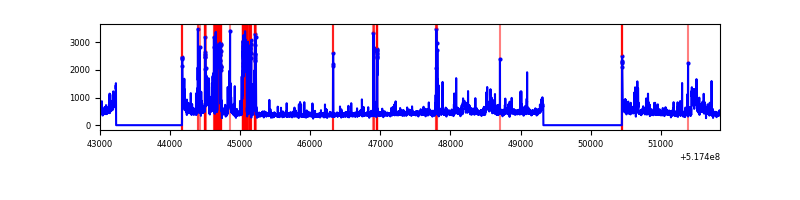 |
Top three noisy pixels from each quadrant. If the there are fewer than three noisy pixels in the level2.evt file, extra rows are filled as -1
| Pixel properties | Quadrant properties | ||||||
|---|---|---|---|---|---|---|---|
| Quadrant | DetID | PixID | Counts | Sigma | Mean | Median | Sigma |
| A | 7 | 223 | 42307 | 228.16 | 742 | 722 | 182.3 |
| A | 10 | 251 | 18322 | 96.56 | 742 | 722 | 182.3 |
| A | 7 | 160 | 18064 | 95.15 | 742 | 722 | 182.3 |
| B | 10 | 16 | 99342 | 635.46 | 730 | 703 | 155.2 |
| B | 5 | 185 | 92722 | 592.82 | 730 | 703 | 155.2 |
| B | 5 | 172 | 44099 | 279.57 | 730 | 703 | 155.2 |
| C | 15 | 224 | 1533701 | 8354.42 | 675 | 667 | 183.5 |
| C | 12 | 254 | 938967 | 5113.36 | 675 | 667 | 183.5 |
| C | 12 | 252 | 317097 | 1724.42 | 675 | 667 | 183.5 |
| D | 8 | 240 | 584072 | 2899.21 | 707 | 675 | 201.2 |
| D | 3 | 12 | 123541 | 610.59 | 707 | 675 | 201.2 |
| D | 13 | 138 | 106299 | 524.9 | 707 | 675 | 201.2 |
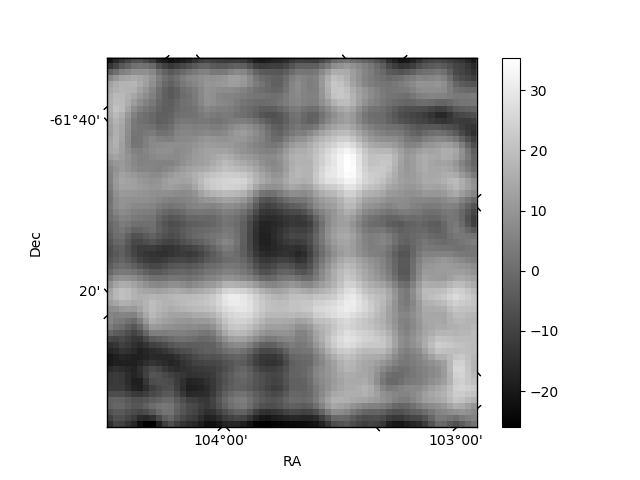
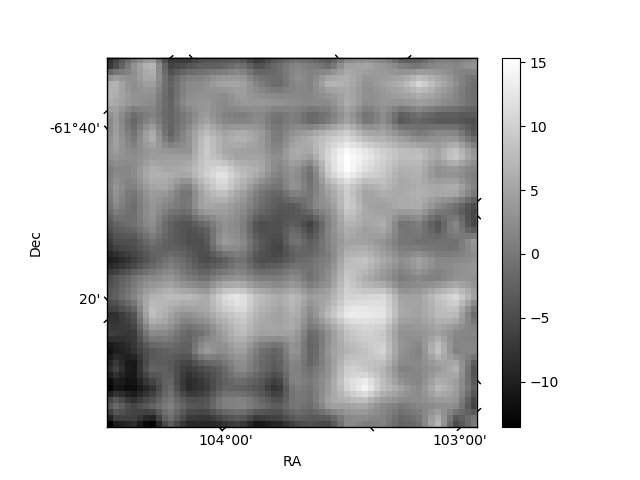
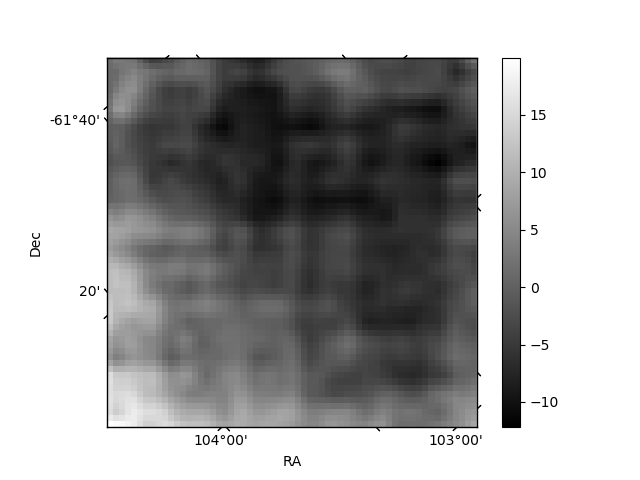
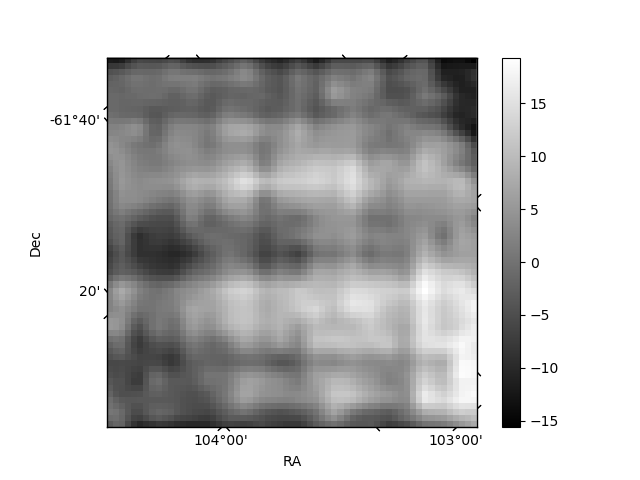
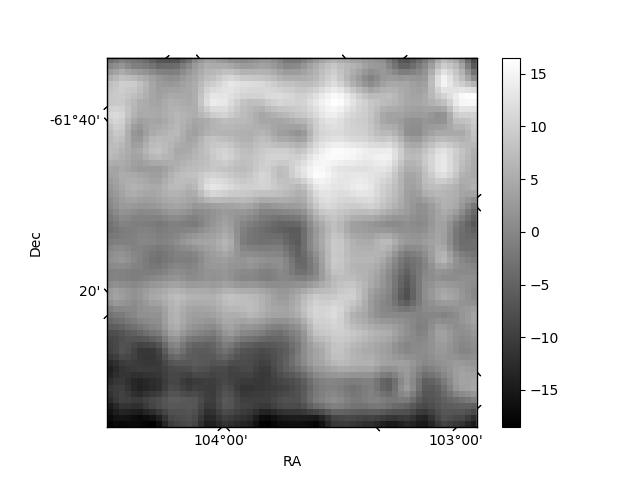
Histogram calculated using DETX and DETY for each event in the final _common_clean file
| Quadrant A | 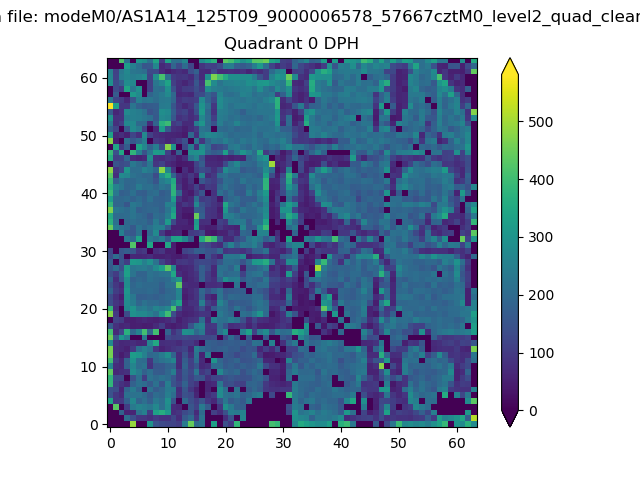 |
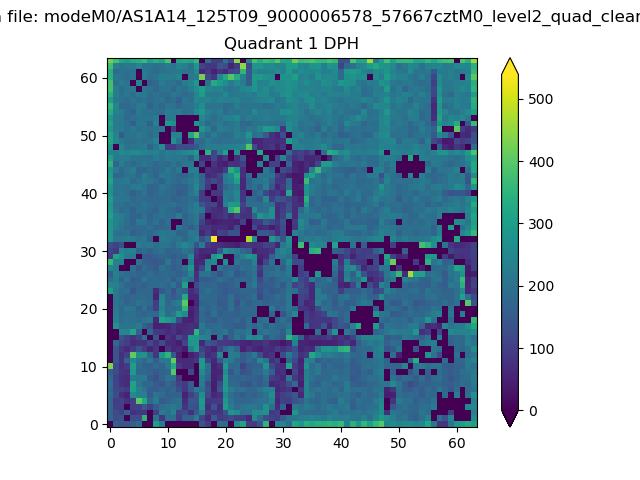 |
Quadrant B |
|---|---|---|---|
| Quadrant D | 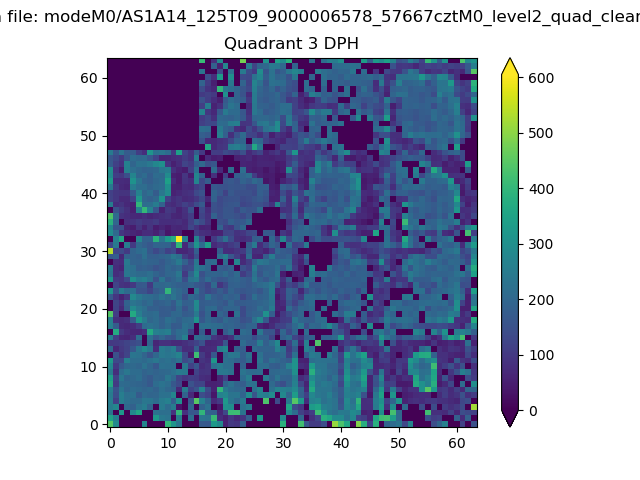 |
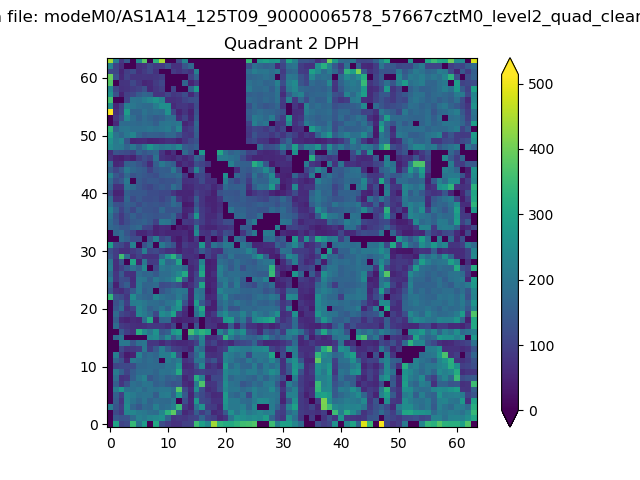 |
Quadrant C |
| Plot type | Count rate plots | Images |
|---|---|---|
| Comparison with Poisson distribution Blue bars denote a histogram of data divided into 1 sec bins. Red curve is a Poisson curve with rate = median count rate of data. |
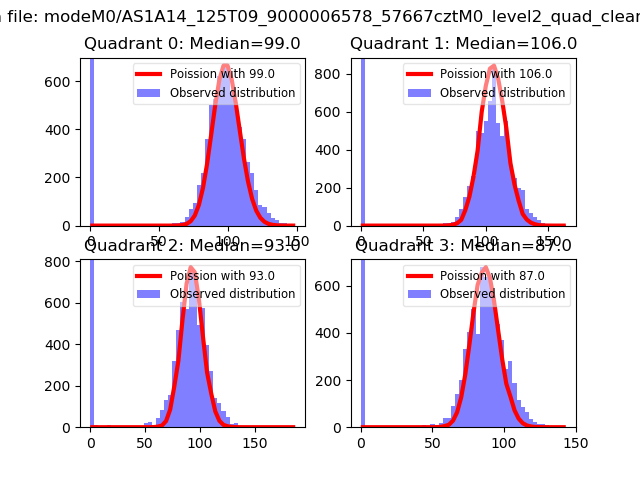 |
 |
| Quadrant-wise count rates Data is divided into 100 sec bins |
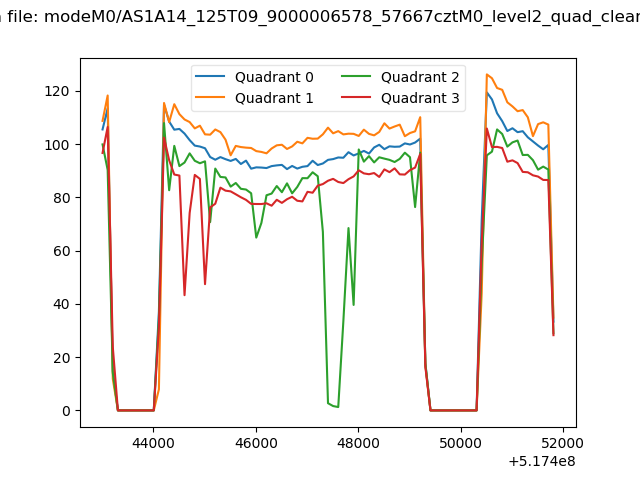 |
|
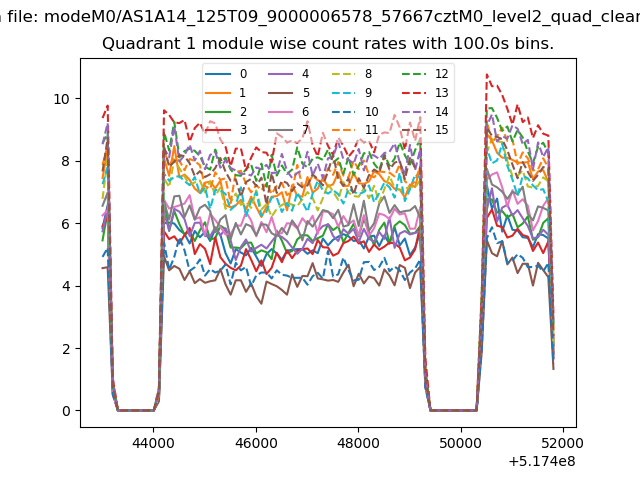
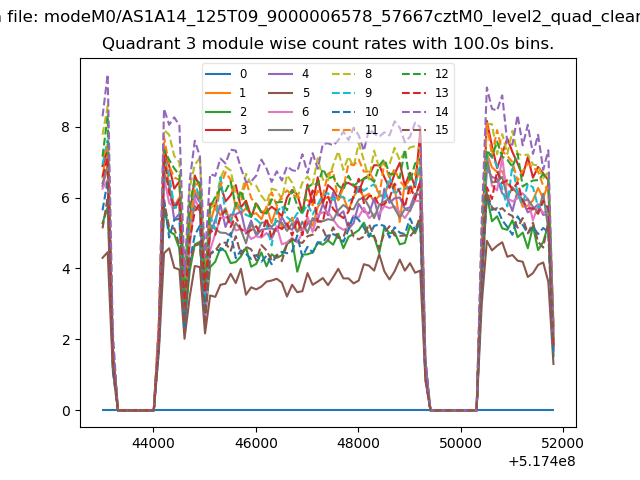
| Module-wise count rates for Quadrant A Data is divided into 100 sec bins |
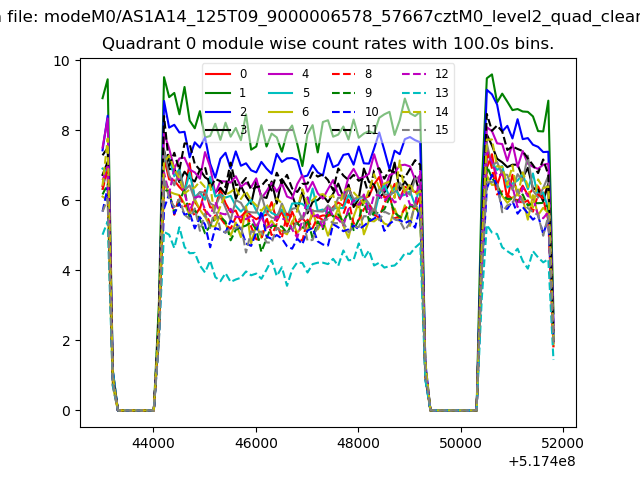 |
 |
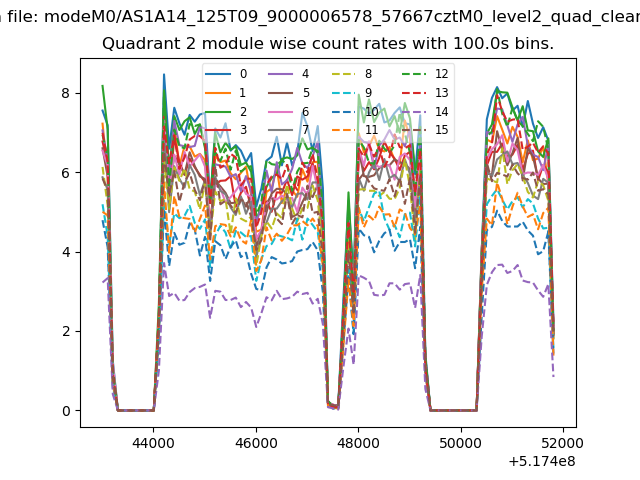
| Module-wise count rates for Quadrant B Data is divided into 100 sec bins |
 |
 |
| Module-wise count rates for Quadrant C Data is divided into 100 sec bins |
 |
 |
| Module-wise count rates for Quadrant D Data is divided into 100 sec bins |
 |
 |
| Parameter | Plot |
|---|---|
| CZT HV Monitor | 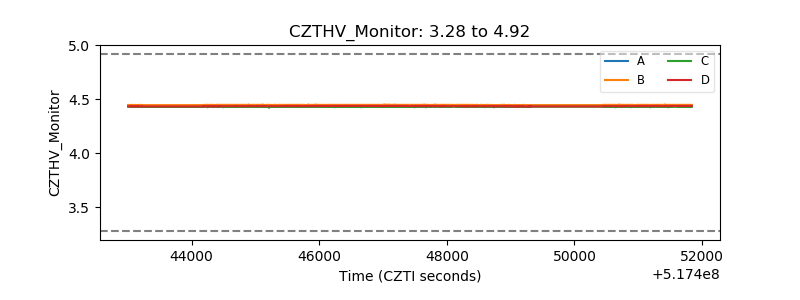 |
| D_VDD | 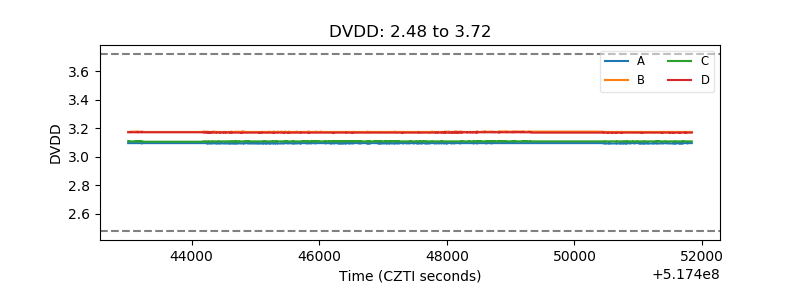 |
| Temperature 1 | 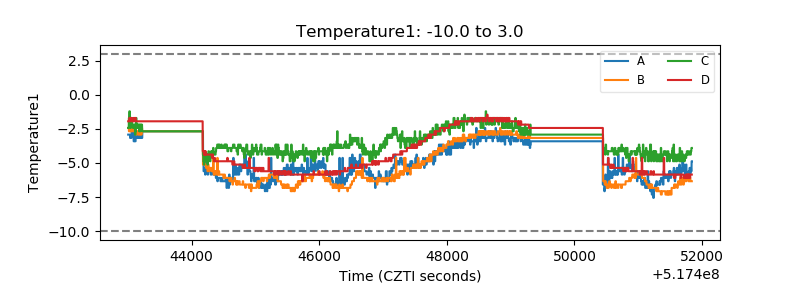 |
| Veto HV Monitor | 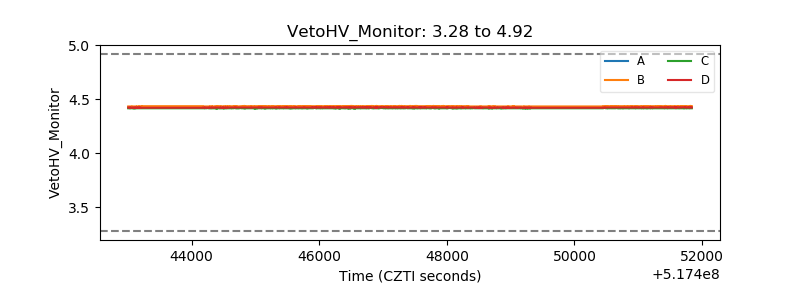 |
| Veto LLD | 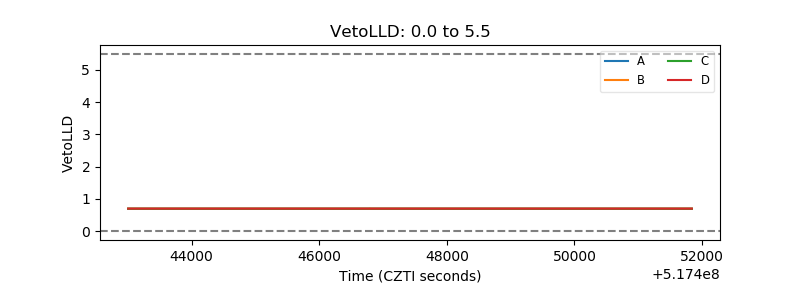 |
| Alpha Counter | 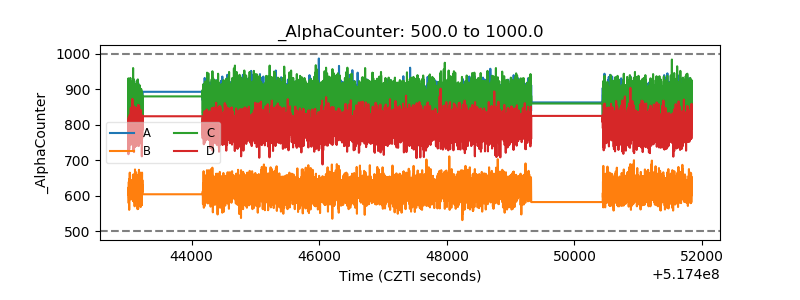 |
| _CPM_Rate | 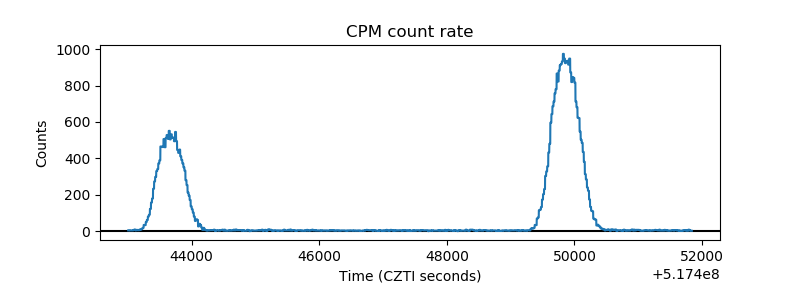 |
| CZT Counter | 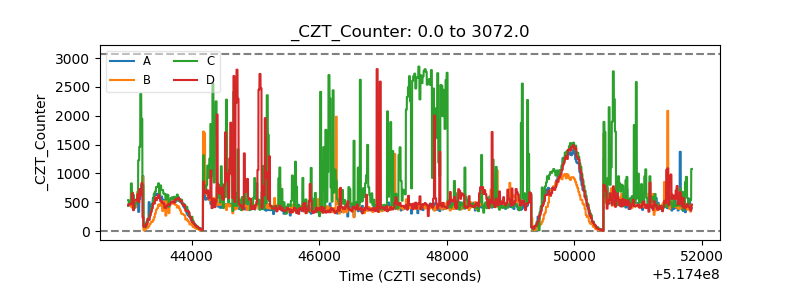 |
| +2.5 Volts monitor |  |
| +5 Volts monitor |  |
| _ROLL_ROT | 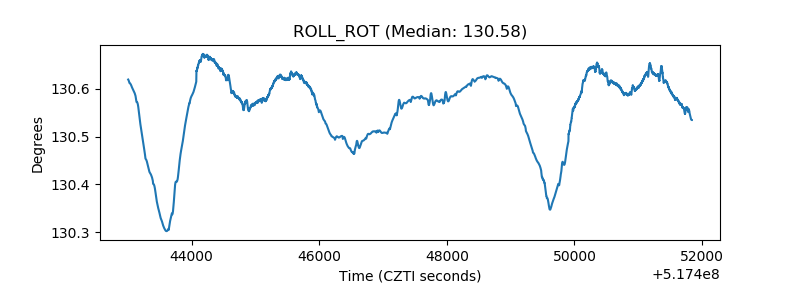 |
| _Roll_DEC | 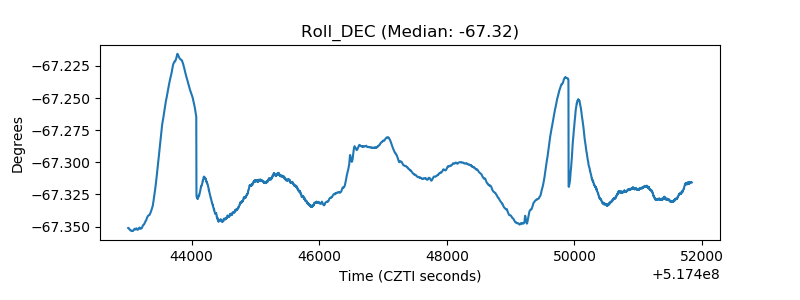 |
| _Roll_RA | 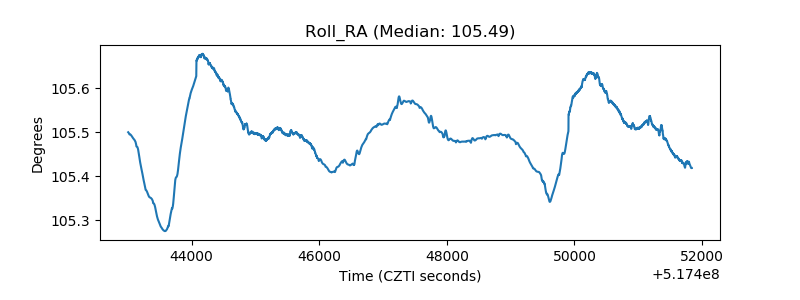 |
| Veto Counter | 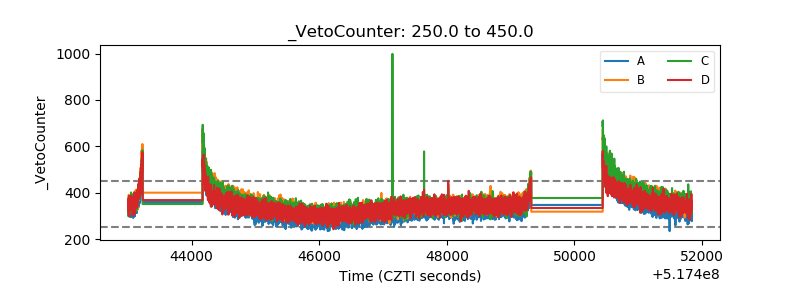 |