| Param | Original file | Final file |
|---|---|---|
| Filename | modeM0/AS1A14_125T09_9000006578_57668cztM0_level2.fits | modeM0/AS1A14_125T09_9000006578_57668cztM0_level2_quad_clean.evt |
| Size (bytes) | 433,650,240 | 103,400,640 |
| Size | 413.6 MB | 98.6 MB |
| Events in quadrant A | 3,619,172 | 679,948 |
| Events in quadrant B | 3,282,757 | 738,053 |
| Events in quadrant C | 4,625,362 | 639,153 |
| Events in quadrant D | 3,999,218 | 602,977 |
| Mode M9 | |||
|---|---|---|---|
| Quadrant | BADHDUFLAG | Total packets | Discarded packets |
| A | 0 | 24 | 0 |
| B | 0 | 24 | 0 |
| C | 0 | 24 | 0 |
| D | 0 | 24 | 0 |
| Mode SS | |||
|---|---|---|---|
| Quadrant | BADHDUFLAG | Total packets | Discarded packets |
| A | 0 | 138 | 0 |
| B | 0 | 138 | 0 |
| C | 0 | 138 | 0 |
| D | 0 | 138 | 0 |
| Mode M0 | |||
|---|---|---|---|
| Quadrant | BADHDUFLAG | Total packets | Discarded packets |
| A | 0 | 15514 | 0 |
| B | 0 | 14484 | 0 |
| C | 0 | 18357 | 0 |
| D | 0 | 16617 | 0 |
| Quadrant | Total seconds | Saturated seconds | Saturation percentage |
|---|---|---|---|
| A | 6761 | 175 | 2.588375% |
| B | 6761 | 139 | 2.055909% |
| C | 6761 | 292 | 4.318888% |
| D | 6761 | 217 | 3.209584% |
Noise dominated data is calculated using 1-second bins in cleaned event files. If a bin has >2000 counts, and if more than 50% of those come from <1% of pixels, then it is considered to be noise-dominated and hence unusable.
| Quadrant | # 1 sec bins | Bins with >0 counts | Bins with >2000 counts | High rate bins dominated by noise | Noise dominated (total time) | Noise dominated (detector-on time) | Marked lightcurve |
|---|---|---|---|---|---|---|---|
| A | 9051 | 6762 | 125 | 125 | 1.38% | 1.85% | 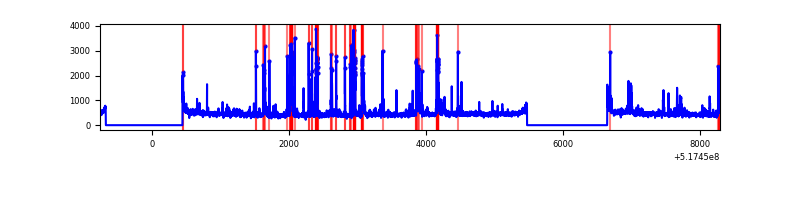 |
| B | 9051 | 6762 | 32 | 32 | 0.35% | 0.47% | 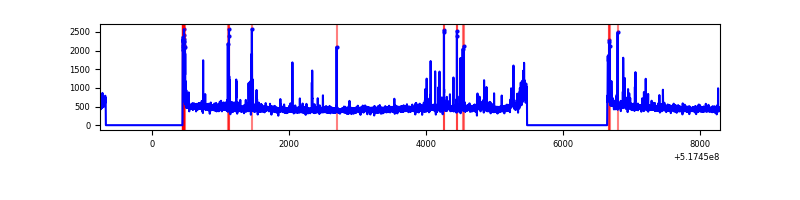 |
| C | 9051 | 6763 | 232 | 232 | 2.56% | 3.43% | 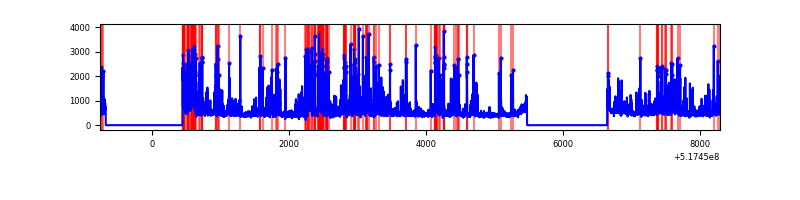 |
| D | 9051 | 6763 | 174 | 174 | 1.92% | 2.57% | 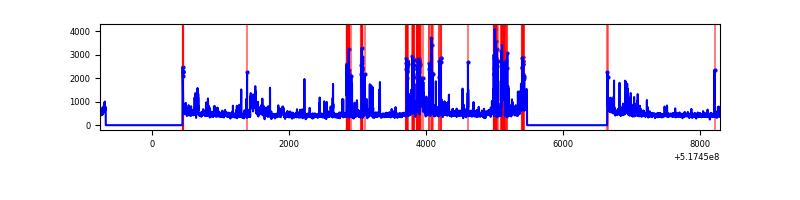 |
Top three noisy pixels from each quadrant. If the there are fewer than three noisy pixels in the level2.evt file, extra rows are filled as -1
| Pixel properties | Quadrant properties | ||||||
|---|---|---|---|---|---|---|---|
| Quadrant | DetID | PixID | Counts | Sigma | Mean | Median | Sigma |
| A | 7 | 223 | 565734 | 3094.34 | 747 | 727 | 182.6 |
| A | 7 | 160 | 58498 | 316.39 | 747 | 727 | 182.6 |
| A | 10 | 251 | 53247 | 287.63 | 747 | 727 | 182.6 |
| B | 10 | 16 | 98166 | 624.51 | 742 | 716 | 156.0 |
| B | 5 | 185 | 95063 | 604.63 | 742 | 716 | 156.0 |
| B | 10 | 247 | 31483 | 197.17 | 742 | 716 | 156.0 |
| C | 15 | 224 | 1181016 | 5980.39 | 726 | 720 | 197.4 |
| C | 14 | 254 | 208003 | 1050.27 | 726 | 720 | 197.4 |
| C | 12 | 2 | 136787 | 689.43 | 726 | 720 | 197.4 |
| D | 8 | 240 | 374364 | 1837.34 | 721 | 686 | 203.4 |
| D | 2 | 120 | 222079 | 1088.57 | 721 | 686 | 203.4 |
| D | 13 | 138 | 213981 | 1048.75 | 721 | 686 | 203.4 |
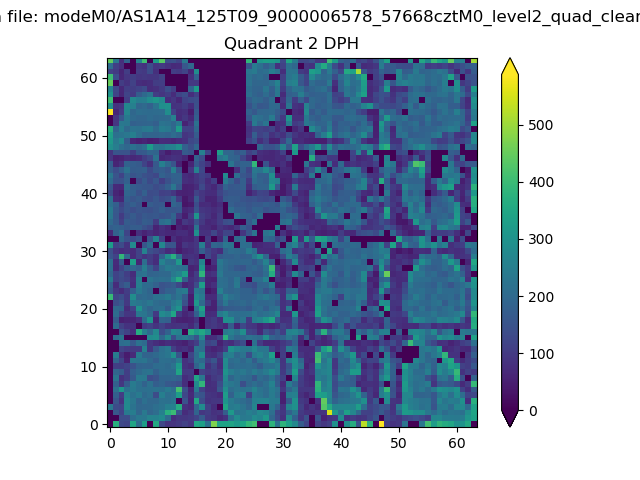
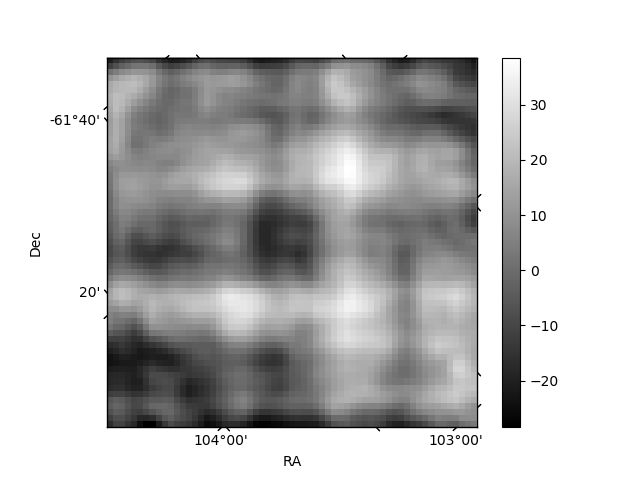
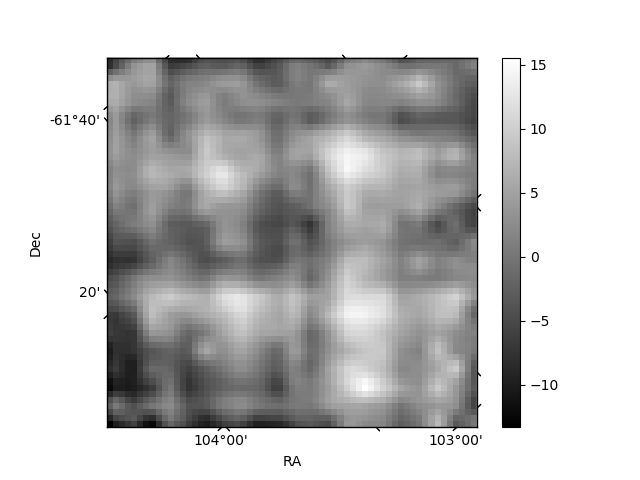
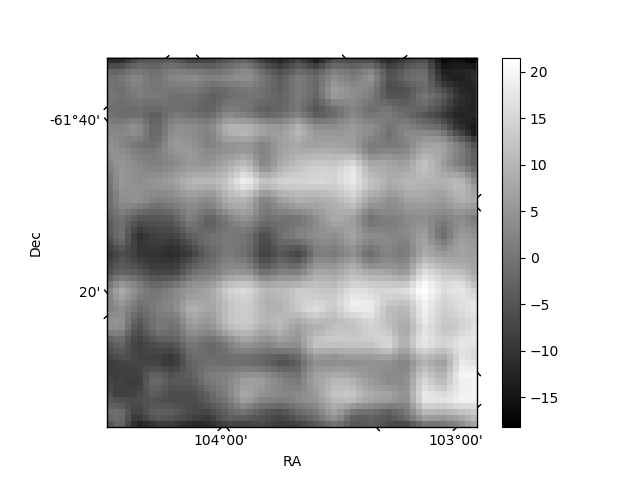
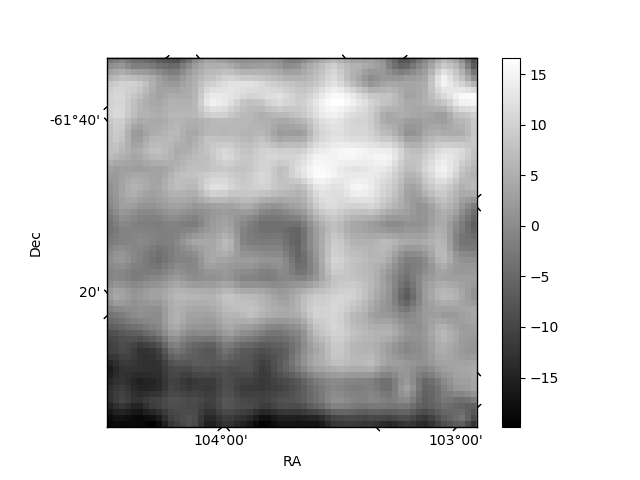
Histogram calculated using DETX and DETY for each event in the final _common_clean file
| Quadrant A | 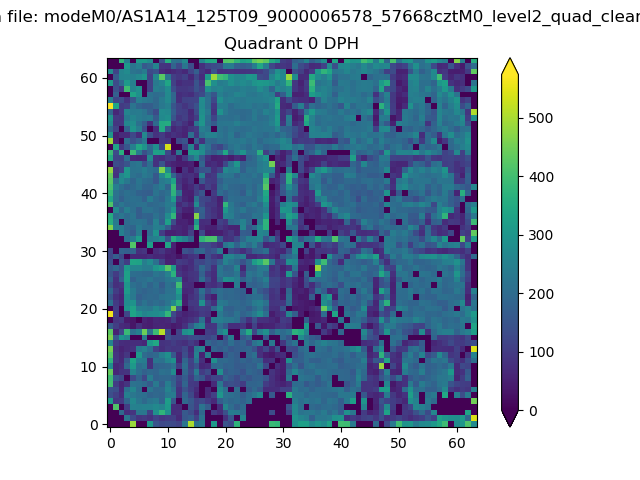 |
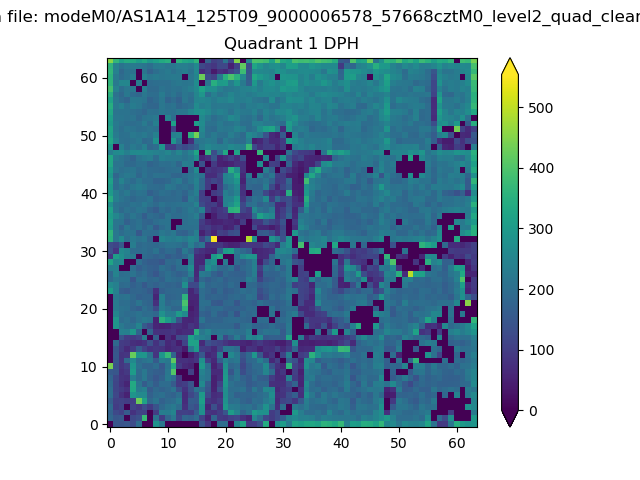 |
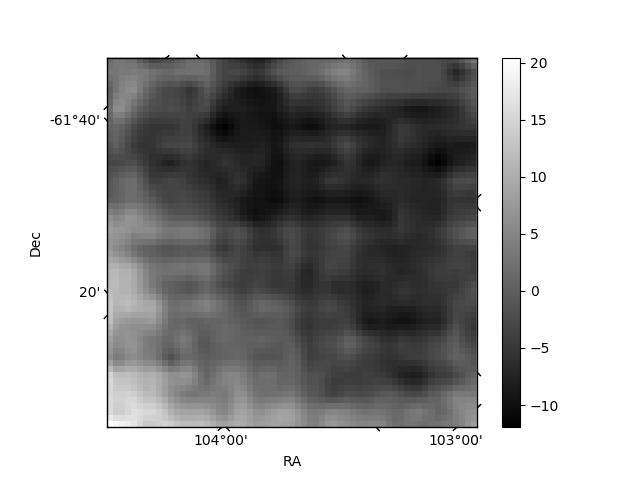
Quadrant B |
|---|---|---|---|
| Quadrant D | 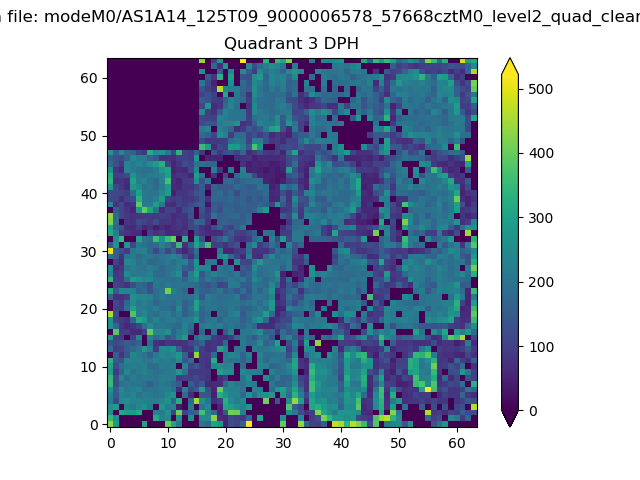 |
 |
Quadrant C |
| Plot type | Count rate plots | Images |
|---|---|---|
| Comparison with Poisson distribution Blue bars denote a histogram of data divided into 1 sec bins. Red curve is a Poisson curve with rate = median count rate of data. |
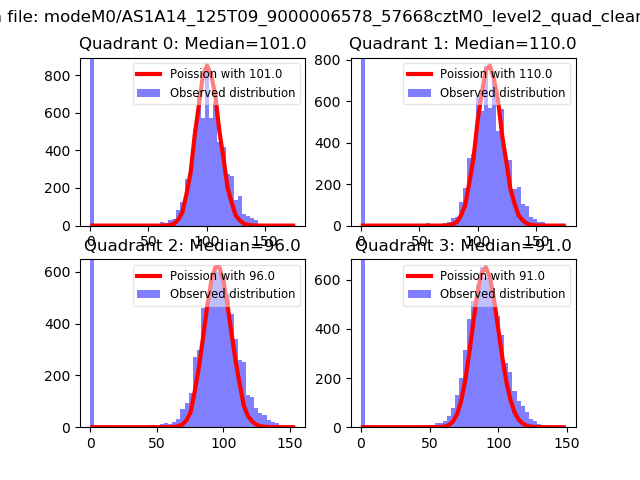 |
 |
| Quadrant-wise count rates Data is divided into 100 sec bins |
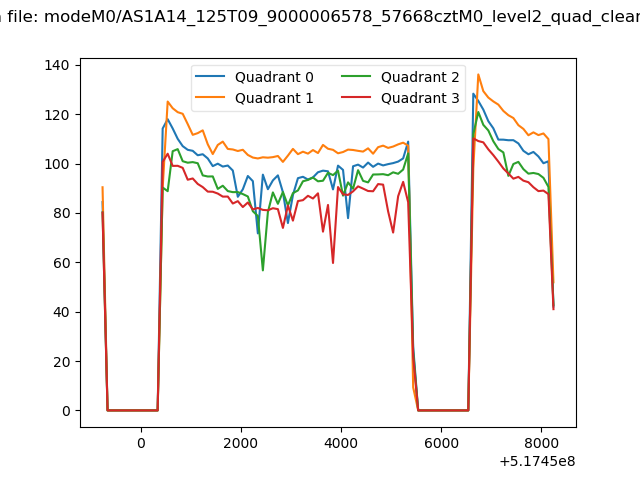 |
|
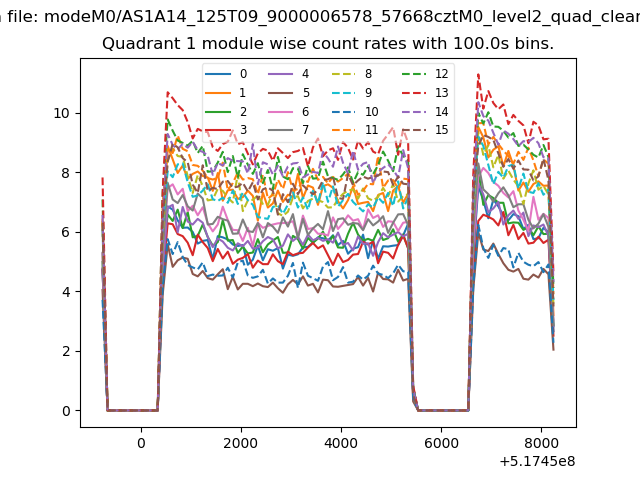
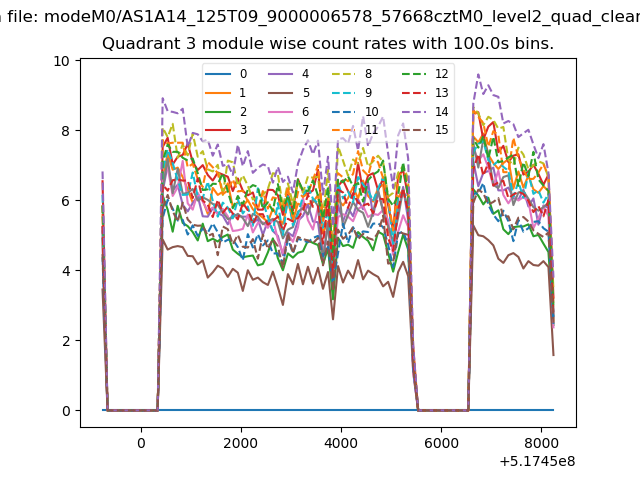
| Module-wise count rates for Quadrant A Data is divided into 100 sec bins |
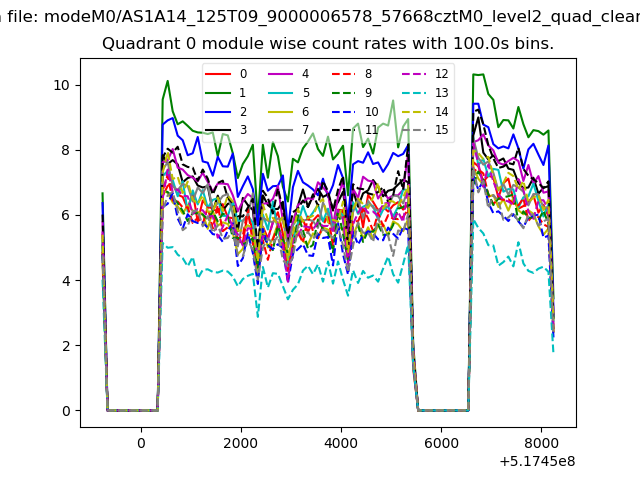 |
 |
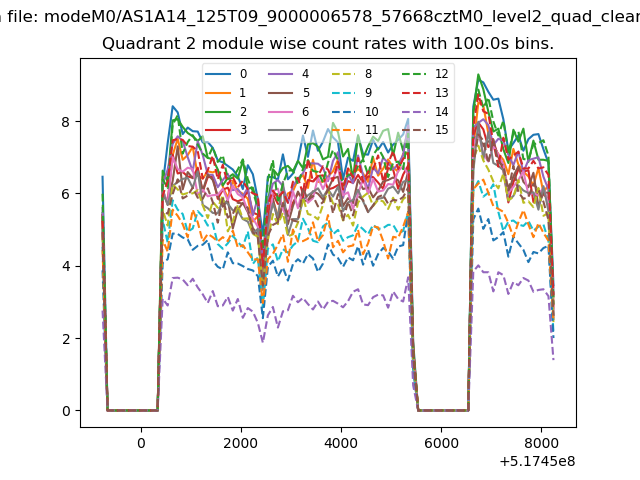
| Module-wise count rates for Quadrant B Data is divided into 100 sec bins |
 |
 |
| Module-wise count rates for Quadrant C Data is divided into 100 sec bins |
 |
 |
| Module-wise count rates for Quadrant D Data is divided into 100 sec bins |
 |
 |
| Parameter | Plot |
|---|---|
| CZT HV Monitor | 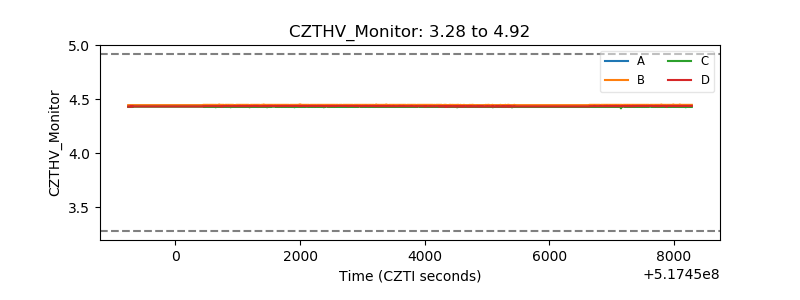 |
| D_VDD | 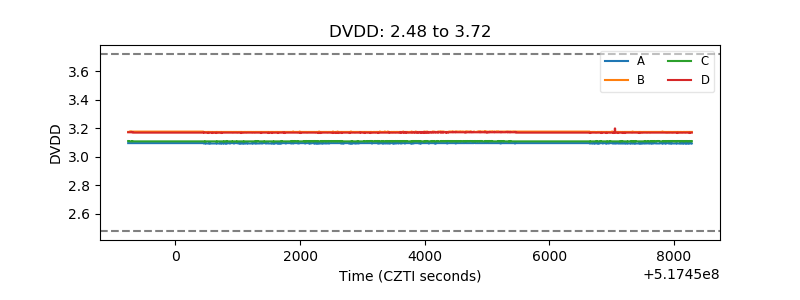 |
| Temperature 1 | 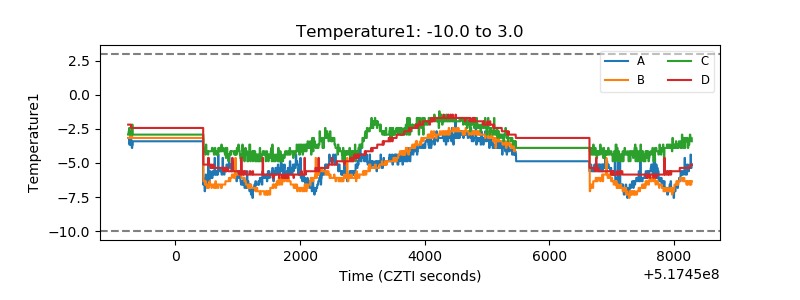 |
| Veto HV Monitor | 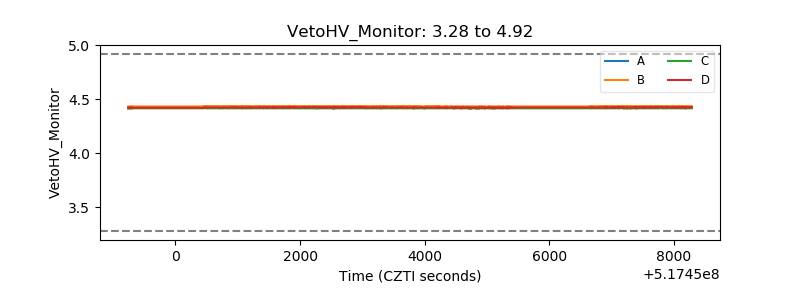 |
| Veto LLD | 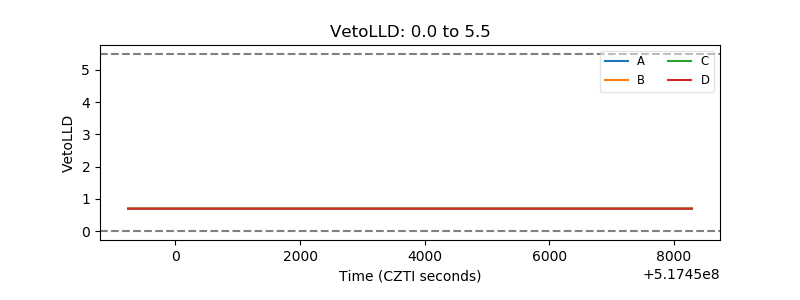 |
| Alpha Counter | 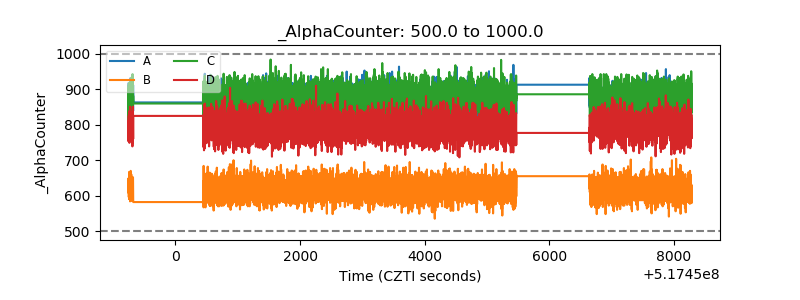 |
| _CPM_Rate | 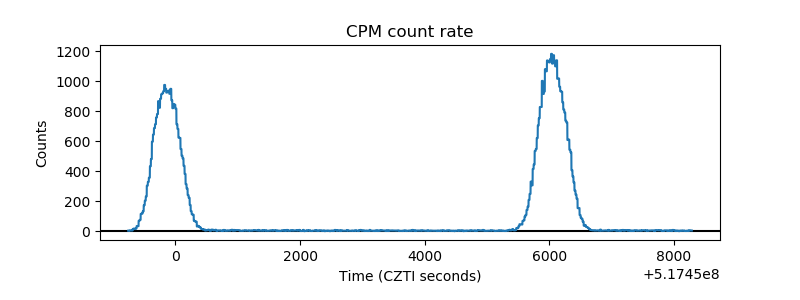 |
| CZT Counter | 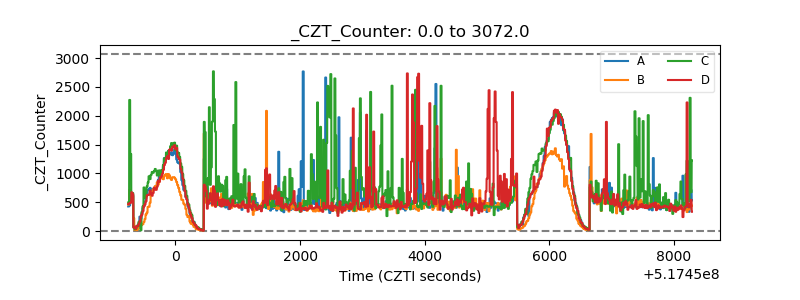 |
| +2.5 Volts monitor |  |
| +5 Volts monitor |  |
| _ROLL_ROT | 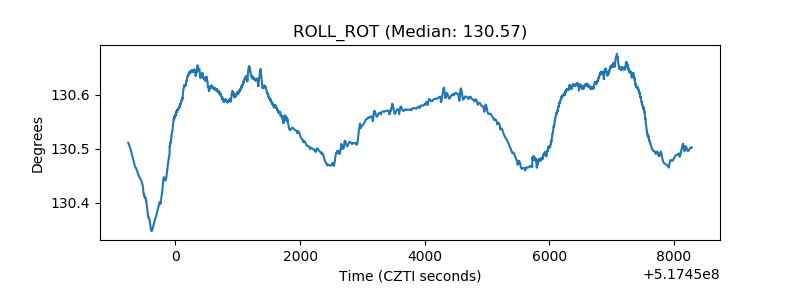 |
| _Roll_DEC | 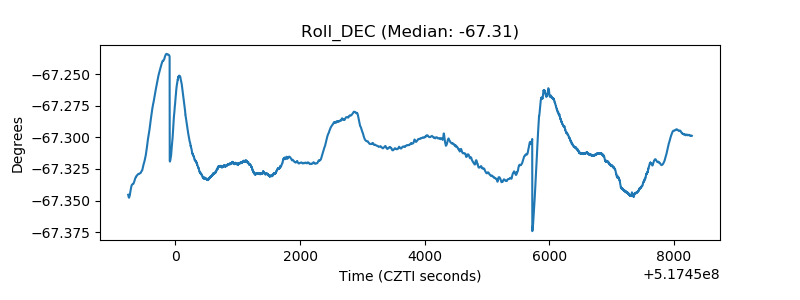 |
| _Roll_RA | 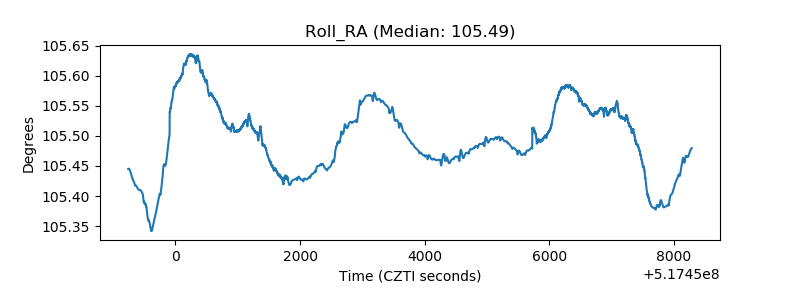 |
| Veto Counter | 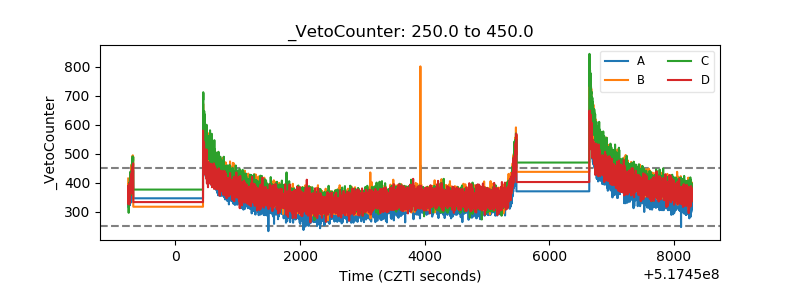 |