| Param | Original file | Final file |
|---|---|---|
| Filename | modeM0/AS1A14_125T09_9000006578_57669cztM0_level2.fits | modeM0/AS1A14_125T09_9000006578_57669cztM0_level2_quad_clean.evt |
| Size (bytes) | 479,485,440 | 97,202,880 |
| Size | 457.3 MB | 92.7 MB |
| Events in quadrant A | 3,118,084 | 673,296 |
| Events in quadrant B | 3,699,512 | 716,486 |
| Events in quadrant C | 4,560,961 | 624,750 |
| Events in quadrant D | 5,872,832 | 482,893 |
| Mode M9 | |||
|---|---|---|---|
| Quadrant | BADHDUFLAG | Total packets | Discarded packets |
| A | 0 | 22 | 0 |
| B | 0 | 23 | 0 |
| C | 0 | 23 | 0 |
| D | 0 | 23 | 0 |
| Mode SS | |||
|---|---|---|---|
| Quadrant | BADHDUFLAG | Total packets | Discarded packets |
| A | 0 | 128 | 0 |
| B | 0 | 128 | 0 |
| C | 0 | 128 | 0 |
| D | 0 | 128 | 0 |
| Mode M0 | |||
|---|---|---|---|
| Quadrant | BADHDUFLAG | Total packets | Discarded packets |
| A | 0 | 13751 | 1 |
| B | 0 | 15334 | 1 |
| C | 0 | 17812 | 1 |
| D | 0 | 21866 | 1 |
| Quadrant | Total seconds | Saturated seconds | Saturation percentage |
|---|---|---|---|
| A | 6397 | 59 | 0.922307% |
| B | 6397 | 197 | 3.079569% |
| C | 6397 | 289 | 4.517743% |
| D | 6397 | 1341 | 20.962951% |
Noise dominated data is calculated using 1-second bins in cleaned event files. If a bin has >2000 counts, and if more than 50% of those come from <1% of pixels, then it is considered to be noise-dominated and hence unusable.
| Quadrant | # 1 sec bins | Bins with >0 counts | Bins with >2000 counts | High rate bins dominated by noise | Noise dominated (total time) | Noise dominated (detector-on time) | Marked lightcurve |
|---|---|---|---|---|---|---|---|
| A | 7627 | 6398 | 16 | 16 | 0.21% | 0.25% | 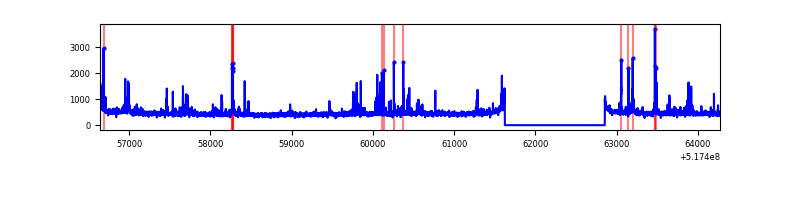 |
| B | 7627 | 6398 | 78 | 78 | 1.02% | 1.22% | 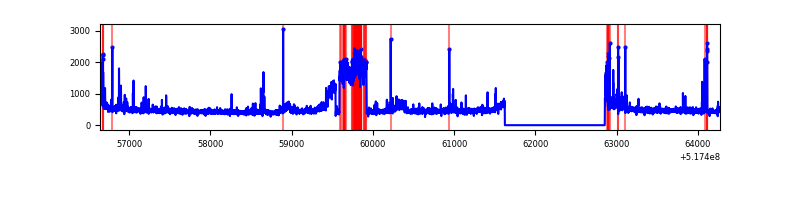 |
| C | 7627 | 6397 | 224 | 224 | 2.94% | 3.50% | 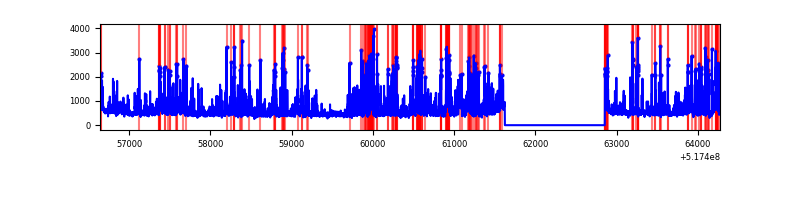 |
| D | 7627 | 6397 | 1047 | 1047 | 13.73% | 16.37% | 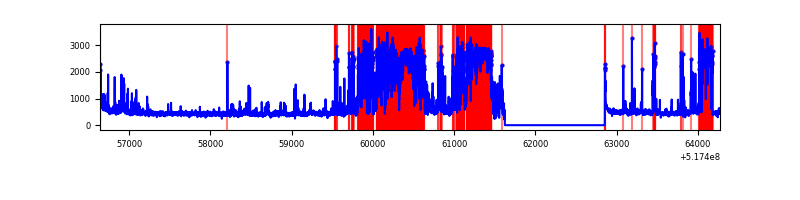 |
Top three noisy pixels from each quadrant. If the there are fewer than three noisy pixels in the level2.evt file, extra rows are filled as -1
| Pixel properties | Quadrant properties | ||||||
|---|---|---|---|---|---|---|---|
| Quadrant | DetID | PixID | Counts | Sigma | Mean | Median | Sigma |
| A | 7 | 223 | 200314 | 1120.93 | 725 | 707 | 178.1 |
| A | 10 | 251 | 64398 | 357.67 | 725 | 707 | 178.1 |
| A | 4 | 3 | 15597 | 83.62 | 725 | 707 | 178.1 |
| B | 4 | 80 | 625294 | 4174.14 | 713 | 687 | 149.6 |
| B | 10 | 16 | 135362 | 900.01 | 713 | 687 | 149.6 |
| B | 5 | 185 | 46270 | 304.62 | 713 | 687 | 149.6 |
| C | 15 | 224 | 1276085 | 6738.71 | 701 | 694 | 189.3 |
| C | 14 | 254 | 175617 | 924.23 | 701 | 694 | 189.3 |
| C | 12 | 2 | 124964 | 656.6 | 701 | 694 | 189.3 |
| D | 8 | 240 | 2935123 | 17467.46 | 598 | 571 | 168.0 |
| D | 7 | 253 | 343721 | 2042.55 | 598 | 571 | 168.0 |
| D | 2 | 120 | 54000 | 318.03 | 598 | 571 | 168.0 |
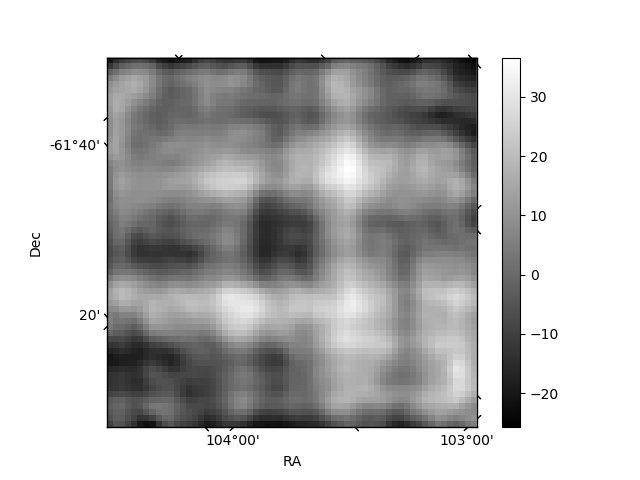
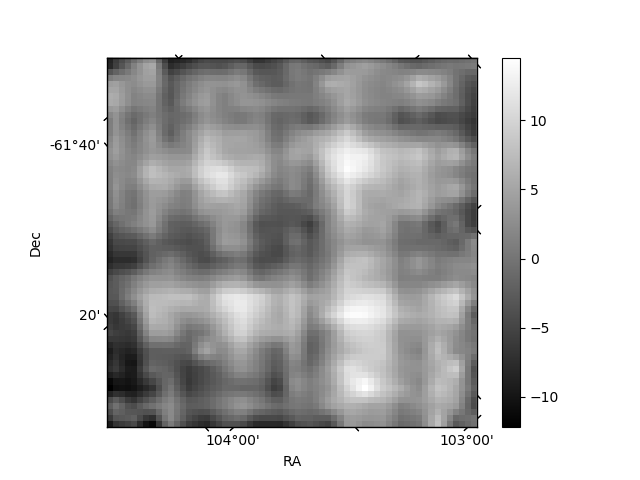
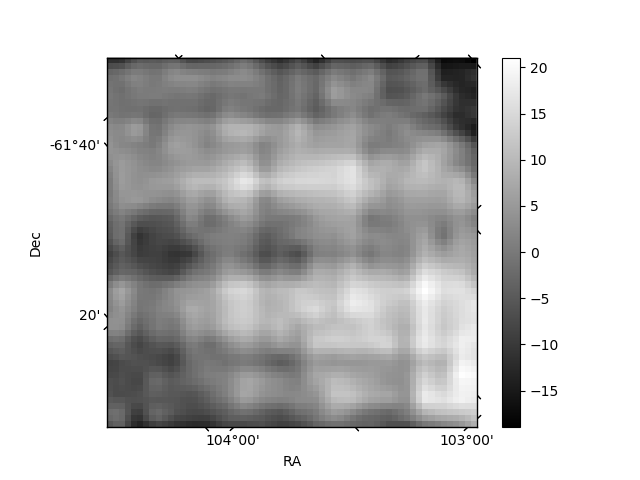
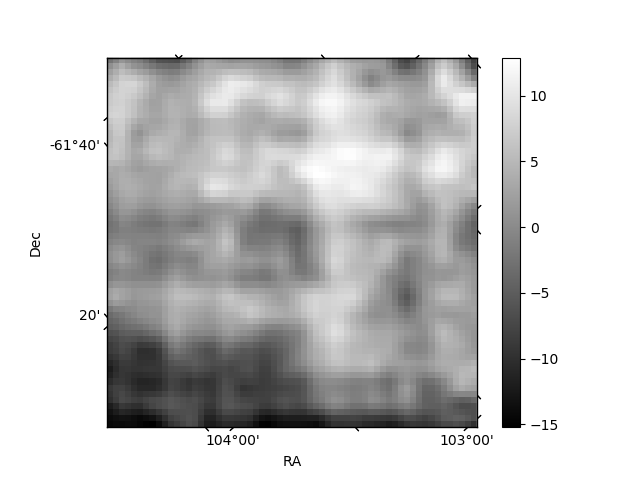
Histogram calculated using DETX and DETY for each event in the final _common_clean file
| Quadrant A | 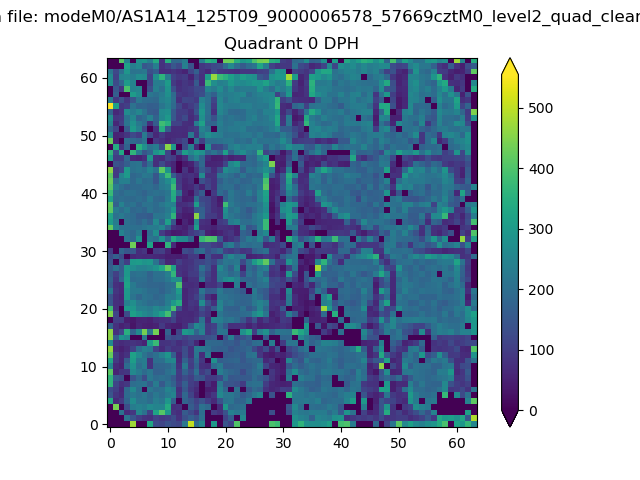 |
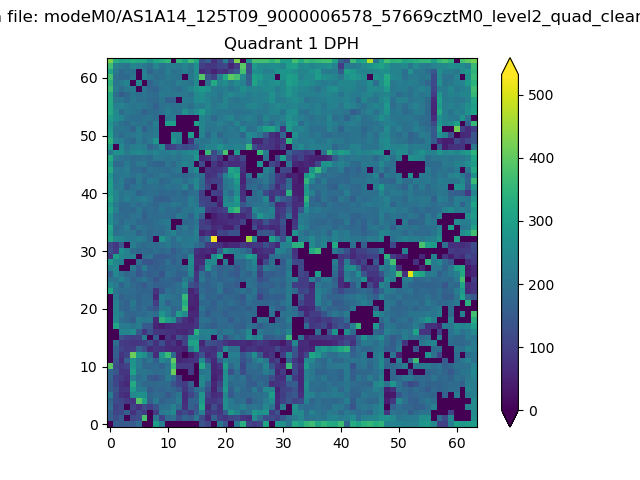 |
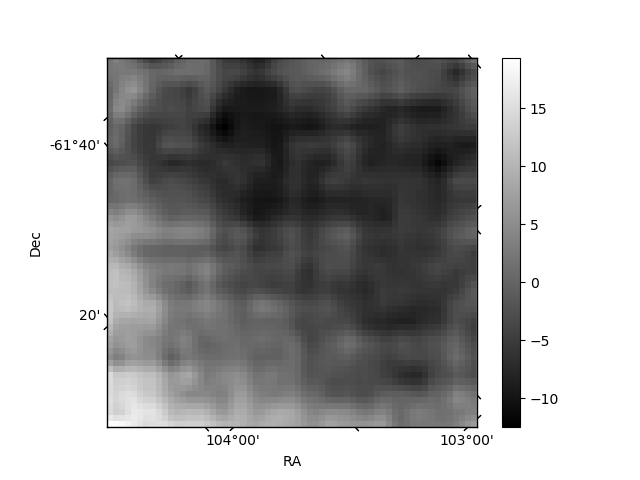
Quadrant B |
|---|---|---|---|
| Quadrant D | 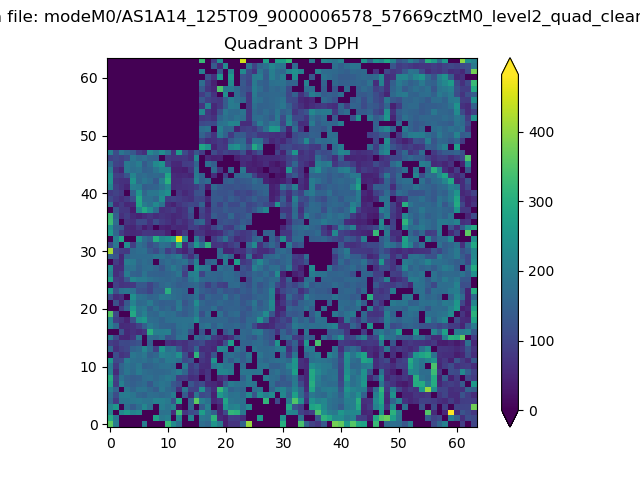 |
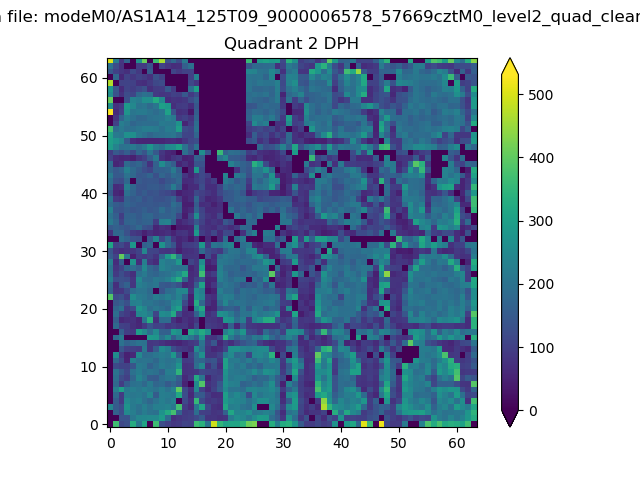 |
Quadrant C |
| Plot type | Count rate plots | Images |
|---|---|---|
| Comparison with Poisson distribution Blue bars denote a histogram of data divided into 1 sec bins. Red curve is a Poisson curve with rate = median count rate of data. |
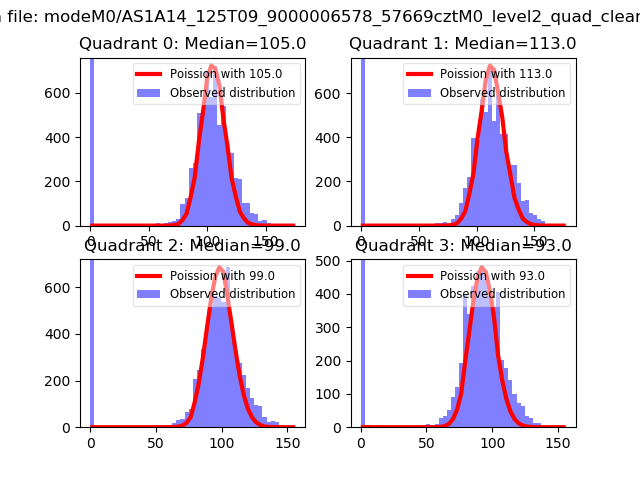 |
 |
| Quadrant-wise count rates Data is divided into 100 sec bins |
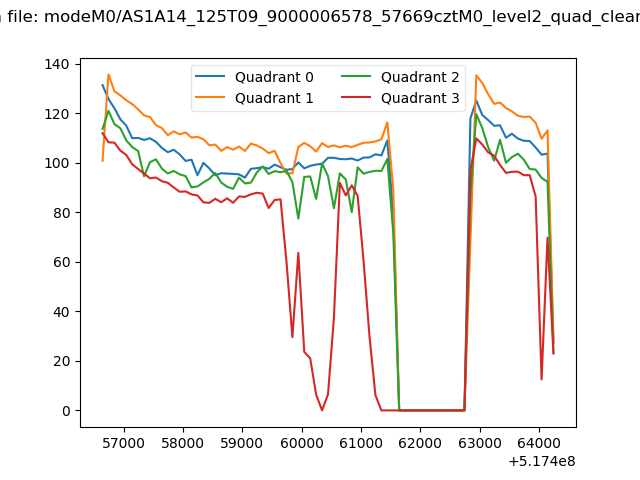 |
|
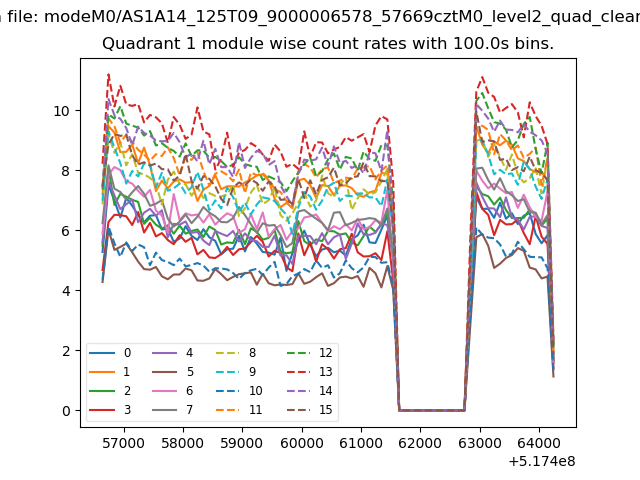
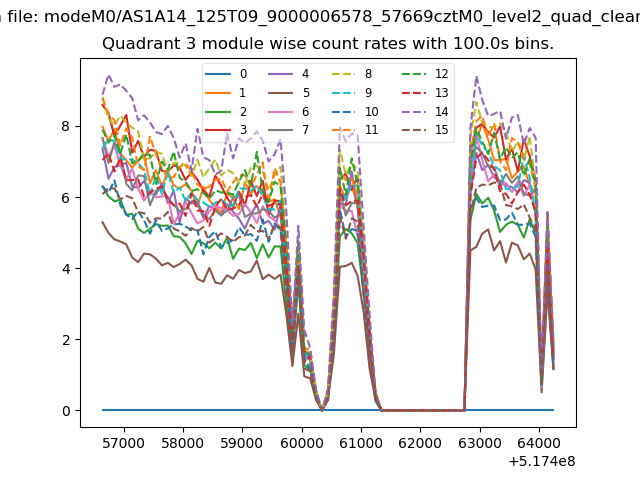
| Module-wise count rates for Quadrant A Data is divided into 100 sec bins |
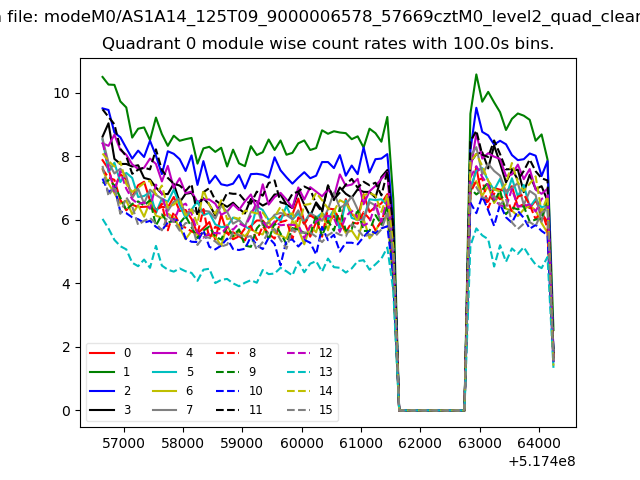 |
 |
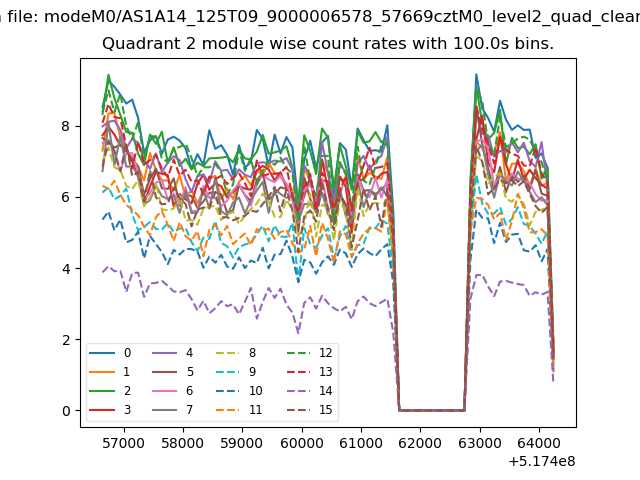
| Module-wise count rates for Quadrant B Data is divided into 100 sec bins |
 |
 |
| Module-wise count rates for Quadrant C Data is divided into 100 sec bins |
 |
 |
| Module-wise count rates for Quadrant D Data is divided into 100 sec bins |
 |
 |
| Parameter | Plot |
|---|---|
| CZT HV Monitor | 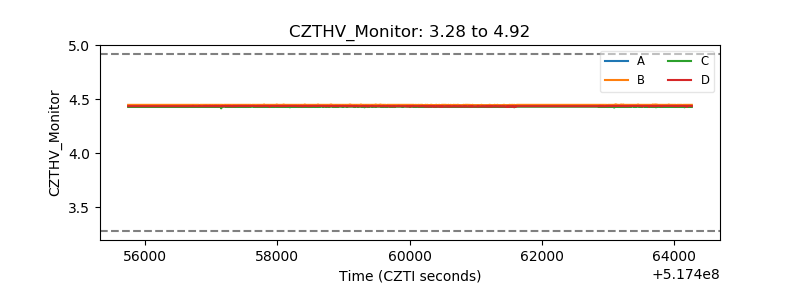 |
| D_VDD | 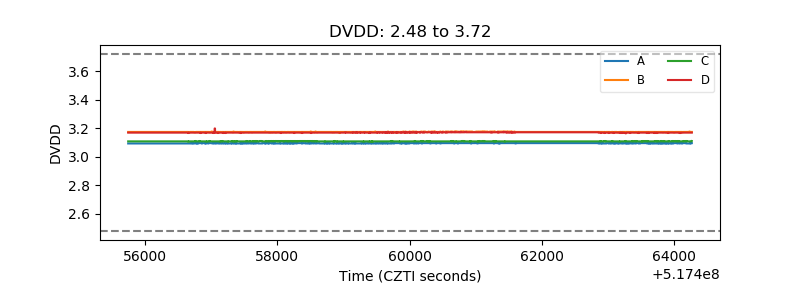 |
| Temperature 1 | 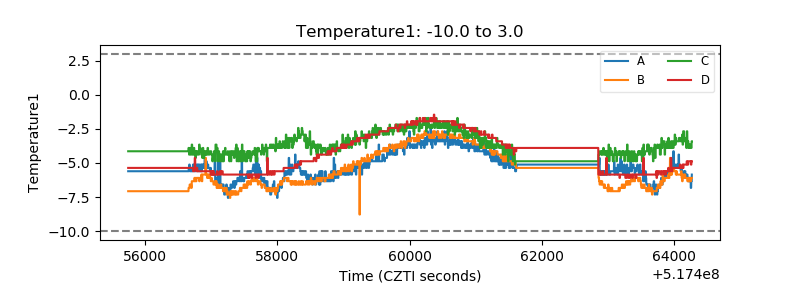 |
| Veto HV Monitor | 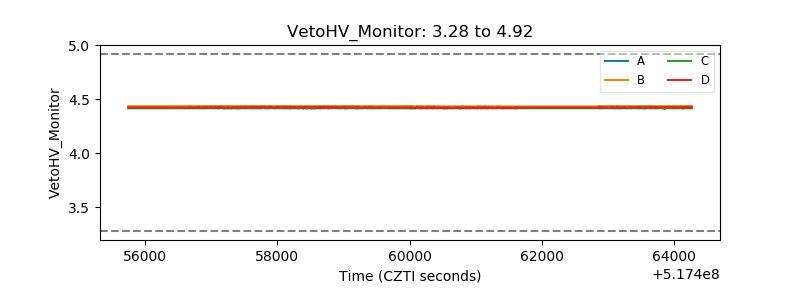 |
| Veto LLD | 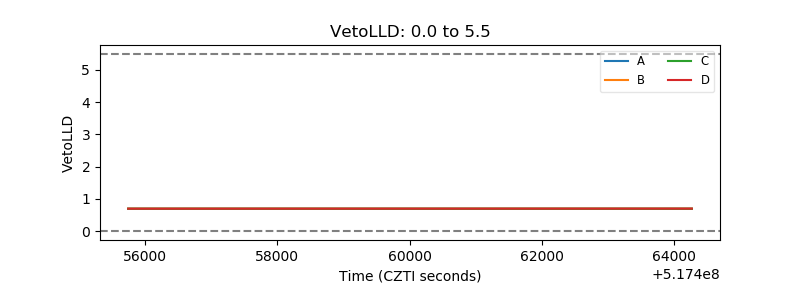 |
| Alpha Counter | 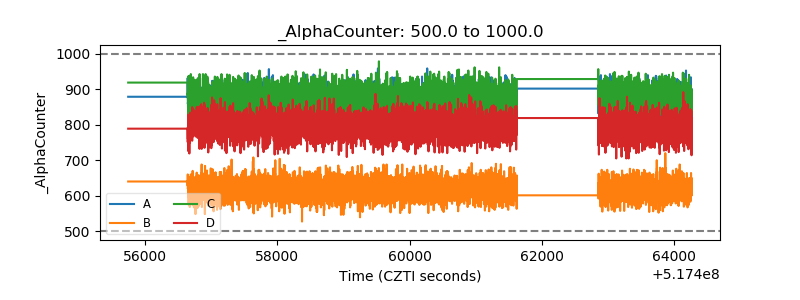 |
| _CPM_Rate | 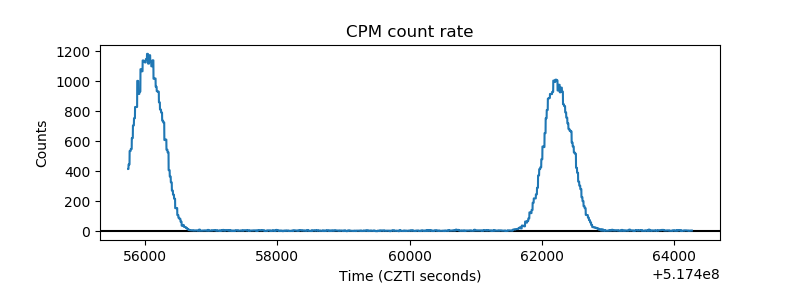 |
| CZT Counter | 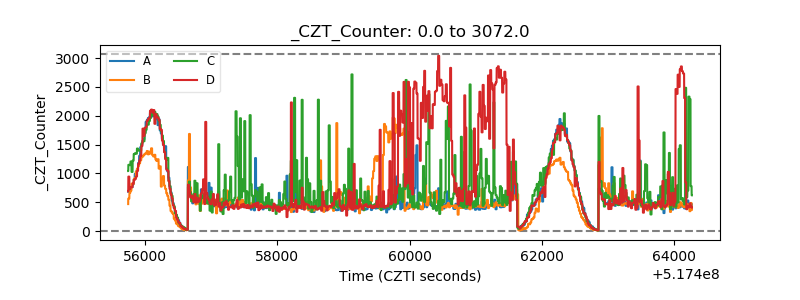 |
| +2.5 Volts monitor |  |
| +5 Volts monitor |  |
| _ROLL_ROT | 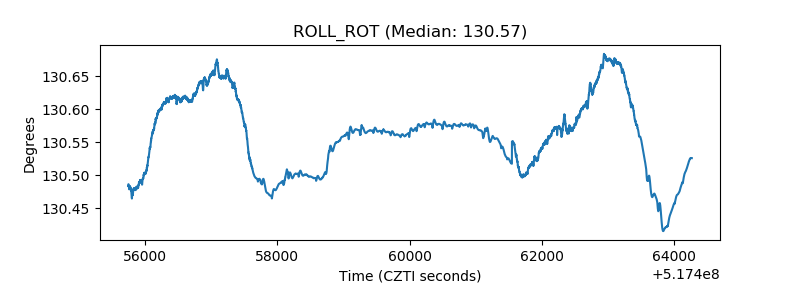 |
| _Roll_DEC | 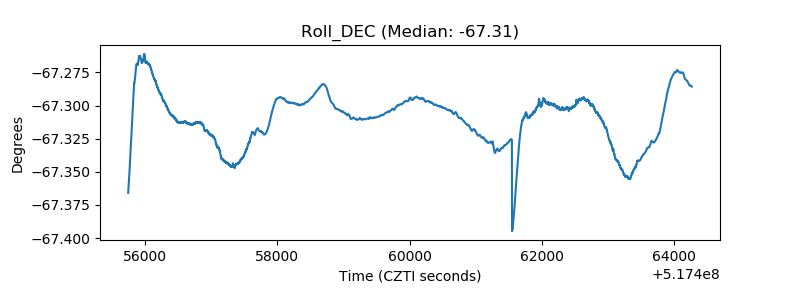 |
| _Roll_RA | 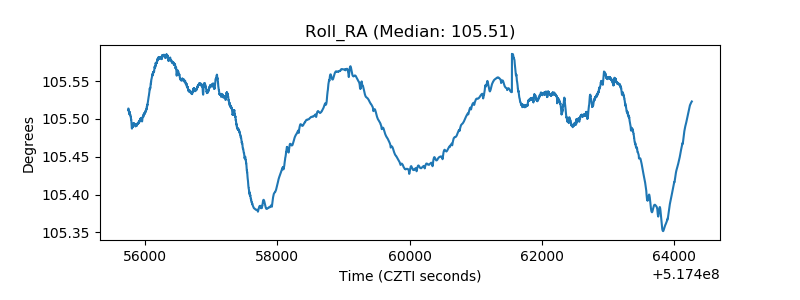 |
| Veto Counter | 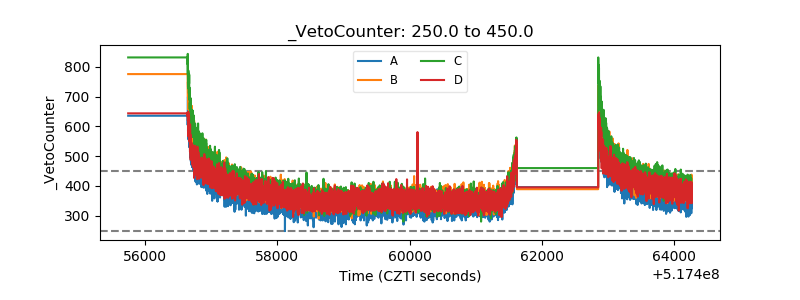 |