| Param | Original file | Final file |
|---|---|---|
| Filename | modeM0/AS1A14_125T09_9000006578_57670cztM0_level2.fits | modeM0/AS1A14_125T09_9000006578_57670cztM0_level2_quad_clean.evt |
| Size (bytes) | 443,816,640 | 99,095,040 |
| Size | 423.3 MB | 94.5 MB |
| Events in quadrant A | 3,111,421 | 673,455 |
| Events in quadrant B | 3,397,307 | 717,487 |
| Events in quadrant C | 4,618,016 | 627,362 |
| Events in quadrant D | 4,794,899 | 528,833 |
| Mode M9 | |||
|---|---|---|---|
| Quadrant | BADHDUFLAG | Total packets | Discarded packets |
| A | 0 | 21 | 0 |
| B | 0 | 22 | 0 |
| C | 0 | 22 | 0 |
| D | 0 | 22 | 0 |
| Mode SS | |||
|---|---|---|---|
| Quadrant | BADHDUFLAG | Total packets | Discarded packets |
| A | 0 | 130 | 0 |
| B | 0 | 130 | 0 |
| C | 0 | 130 | 0 |
| D | 0 | 130 | 0 |
| Mode M0 | |||
|---|---|---|---|
| Quadrant | BADHDUFLAG | Total packets | Discarded packets |
| A | 0 | 13869 | 2 |
| B | 0 | 14537 | 2 |
| C | 0 | 18122 | 2 |
| D | 0 | 18701 | 2 |
| Quadrant | Total seconds | Saturated seconds | Saturation percentage |
|---|---|---|---|
| A | 6510 | 119 | 1.827957% |
| B | 6510 | 245 | 3.763441% |
| C | 6510 | 358 | 5.499232% |
| D | 6510 | 977 | 15.007680% |
Noise dominated data is calculated using 1-second bins in cleaned event files. If a bin has >2000 counts, and if more than 50% of those come from <1% of pixels, then it is considered to be noise-dominated and hence unusable.
| Quadrant | # 1 sec bins | Bins with >0 counts | Bins with >2000 counts | High rate bins dominated by noise | Noise dominated (total time) | Noise dominated (detector-on time) | Marked lightcurve |
|---|---|---|---|---|---|---|---|
| A | 7675 | 6510 | 24 | 24 | 0.31% | 0.37% | 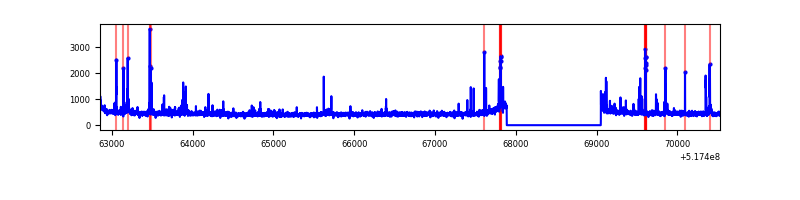 |
| B | 7675 | 6510 | 72 | 72 | 0.94% | 1.11% | 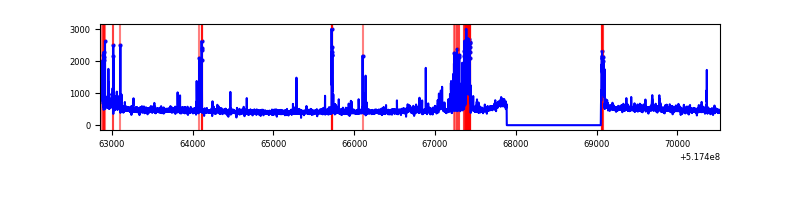 |
| C | 7675 | 6510 | 242 | 242 | 3.15% | 3.72% | 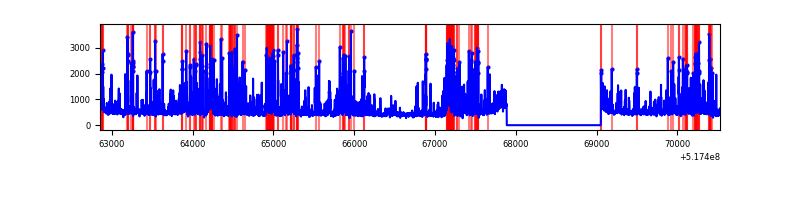 |
| D | 7675 | 6510 | 528 | 528 | 6.88% | 8.11% | 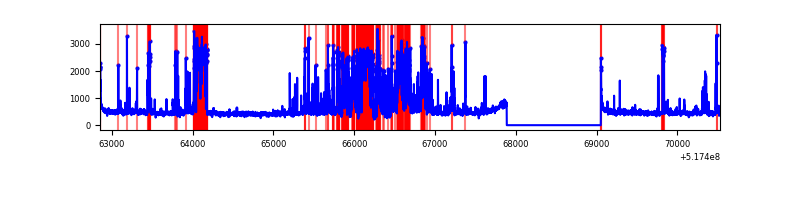 |
Top three noisy pixels from each quadrant. If the there are fewer than three noisy pixels in the level2.evt file, extra rows are filled as -1
| Pixel properties | Quadrant properties | ||||||
|---|---|---|---|---|---|---|---|
| Quadrant | DetID | PixID | Counts | Sigma | Mean | Median | Sigma |
| A | 7 | 223 | 98057 | 531.74 | 739 | 718 | 183.1 |
| A | 14 | 254 | 44036 | 236.64 | 739 | 718 | 183.1 |
| A | 7 | 160 | 34198 | 182.89 | 739 | 718 | 183.1 |
| B | 5 | 185 | 244206 | 1588.46 | 726 | 698 | 153.3 |
| B | 10 | 16 | 125899 | 816.72 | 726 | 698 | 153.3 |
| B | 4 | 80 | 52497 | 337.9 | 726 | 698 | 153.3 |
| C | 15 | 224 | 1502421 | 7731.65 | 715 | 708 | 194.2 |
| C | 14 | 254 | 124060 | 635.08 | 715 | 708 | 194.2 |
| C | 12 | 2 | 61407 | 312.51 | 715 | 708 | 194.2 |
| D | 8 | 240 | 1886405 | 10294.63 | 649 | 619 | 183.2 |
| D | 7 | 253 | 144950 | 787.91 | 649 | 619 | 183.2 |
| D | 3 | 12 | 49439 | 266.51 | 649 | 619 | 183.2 |
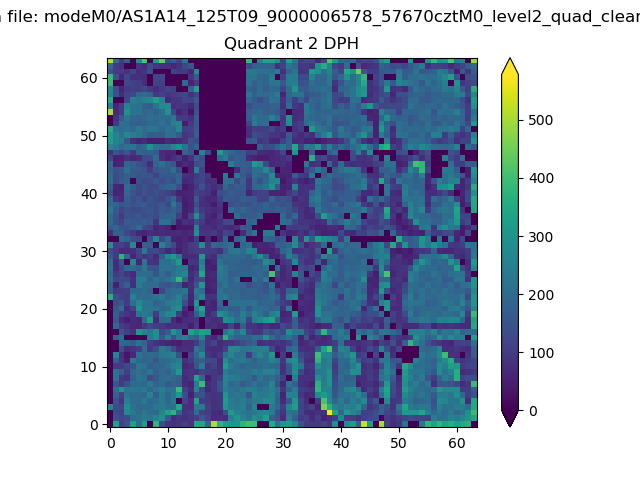
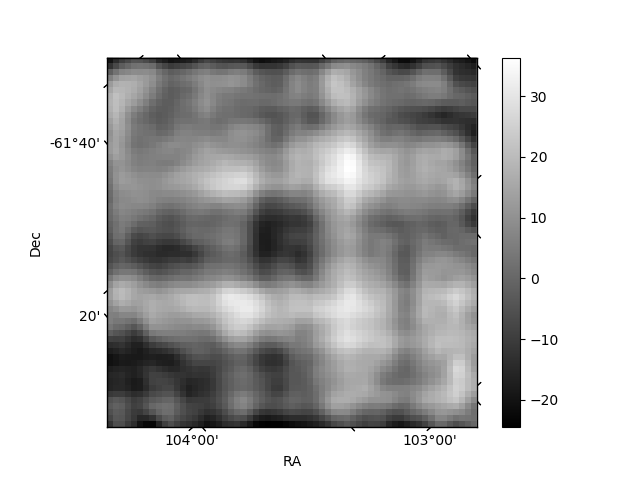
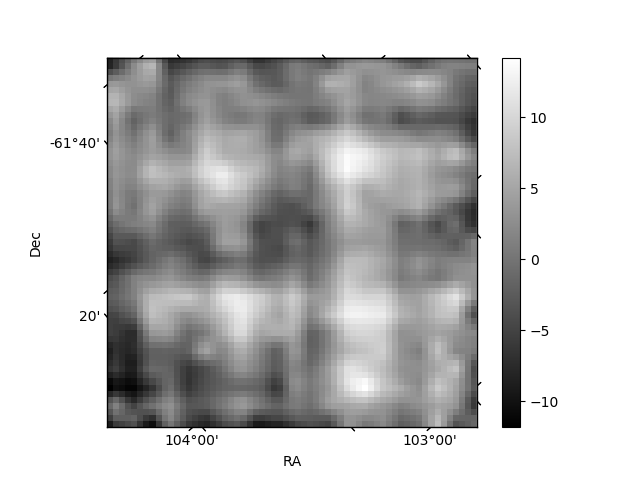
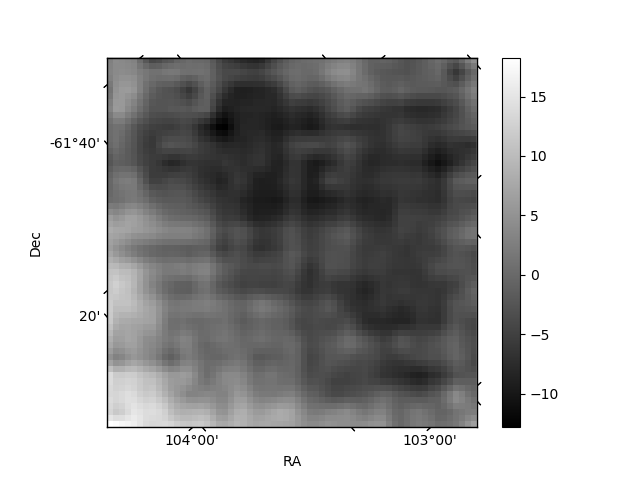
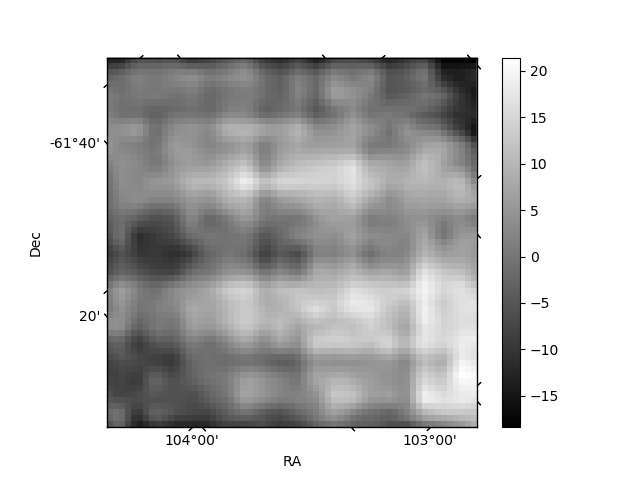
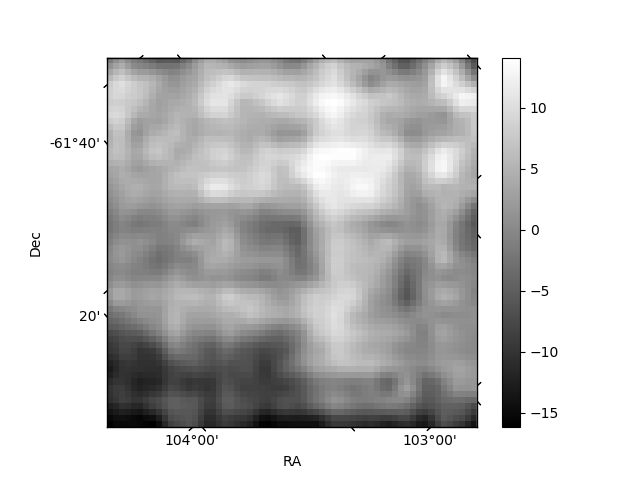
Histogram calculated using DETX and DETY for each event in the final _common_clean file
| Quadrant A | 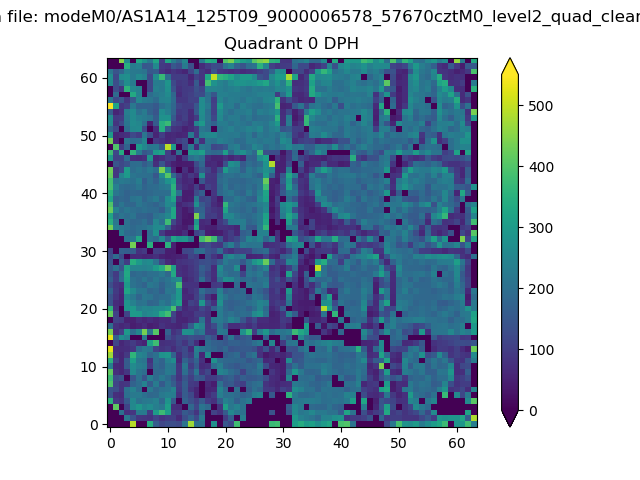 |
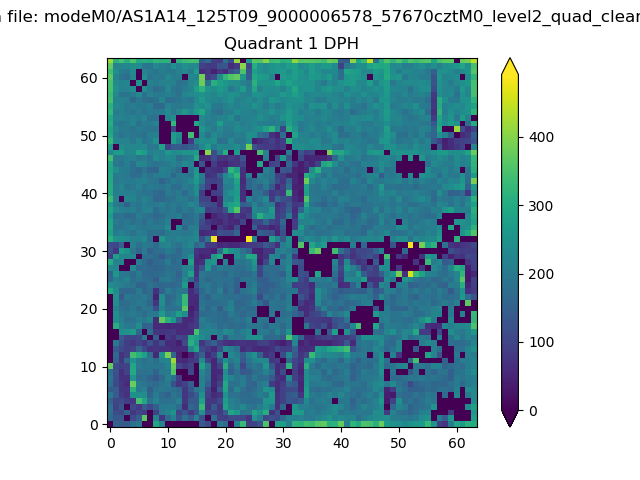 |
Quadrant B |
|---|---|---|---|
| Quadrant D | 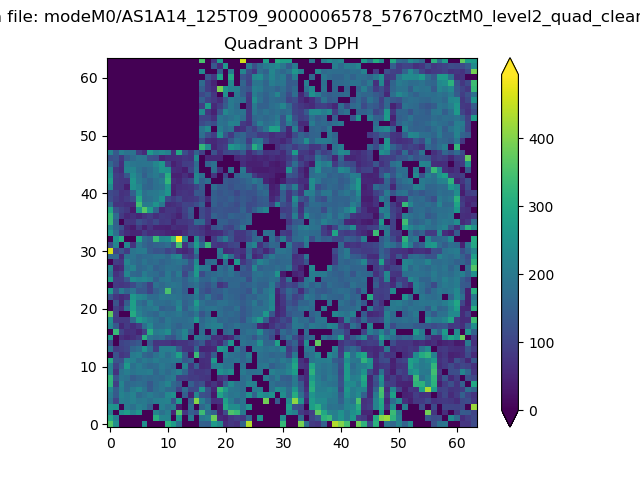 |
 |
Quadrant C |
| Plot type | Count rate plots | Images |
|---|---|---|
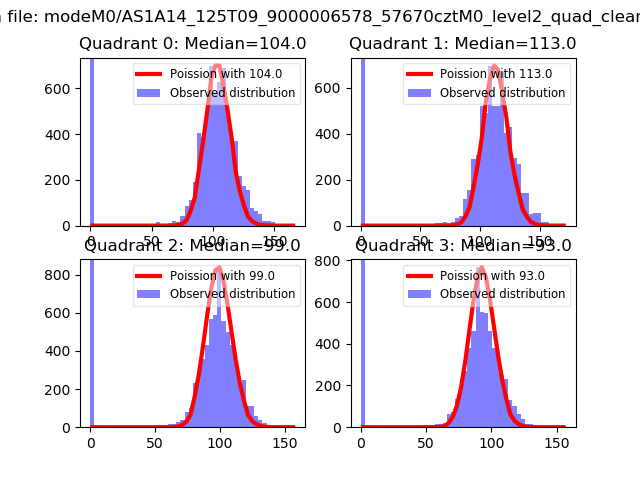
| Comparison with Poisson distribution Blue bars denote a histogram of data divided into 1 sec bins. Red curve is a Poisson curve with rate = median count rate of data. |
 |
 |
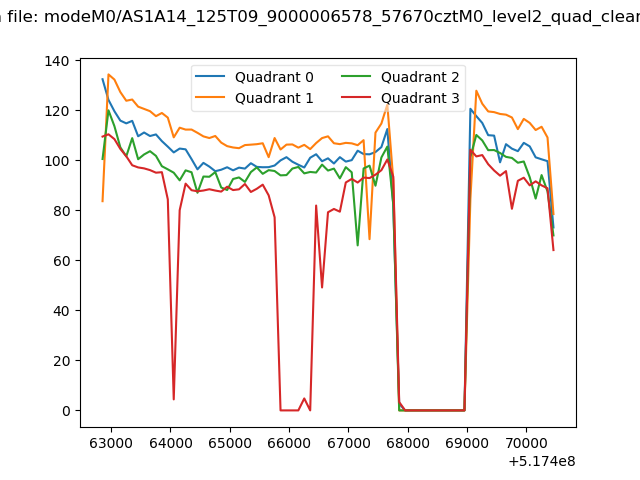
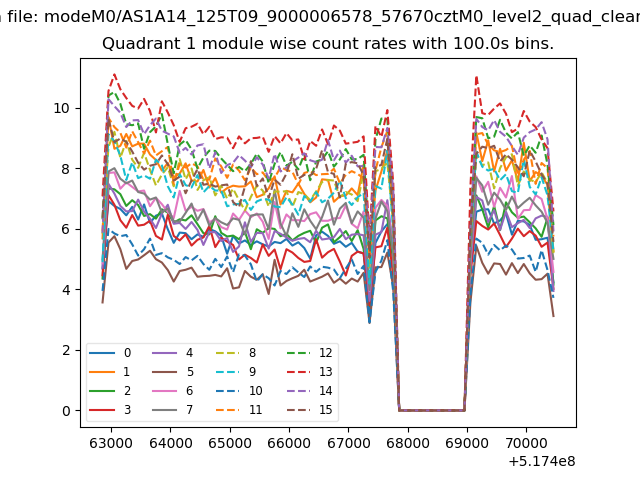
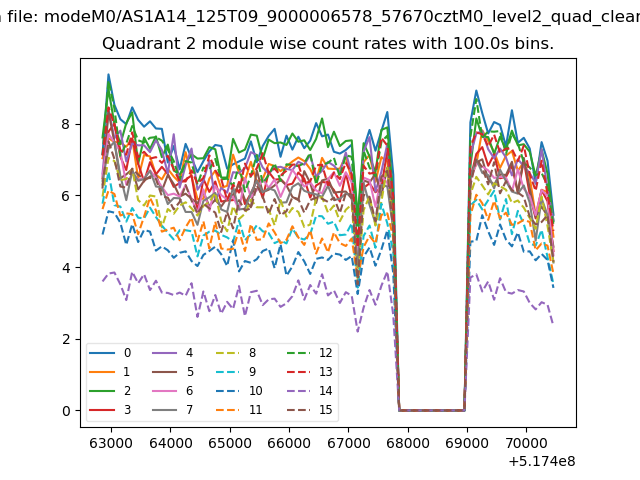
| Quadrant-wise count rates Data is divided into 100 sec bins |
 |
|
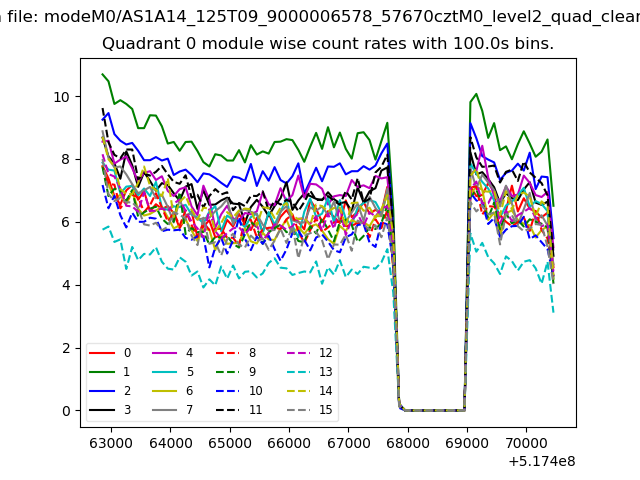
| Module-wise count rates for Quadrant A Data is divided into 100 sec bins |
 |
 |
| Module-wise count rates for Quadrant B Data is divided into 100 sec bins |
 |
 |
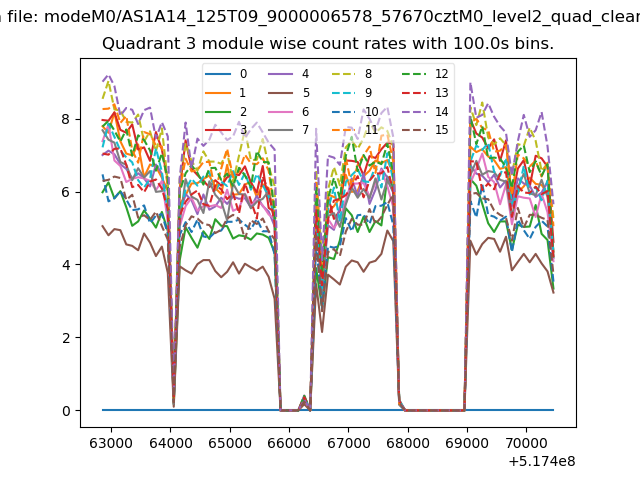
| Module-wise count rates for Quadrant C Data is divided into 100 sec bins |
 |
 |
| Module-wise count rates for Quadrant D Data is divided into 100 sec bins |
 |
 |
| Parameter | Plot |
|---|---|
| CZT HV Monitor | 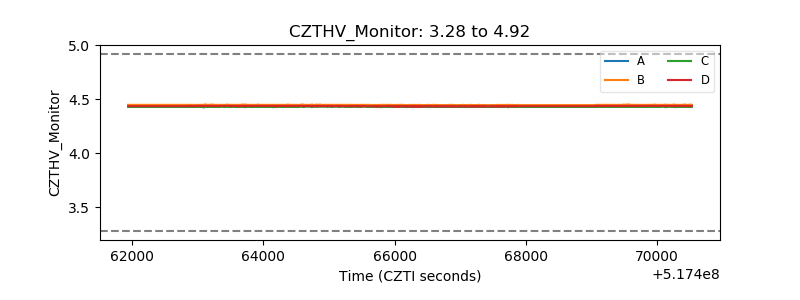 |
| D_VDD | 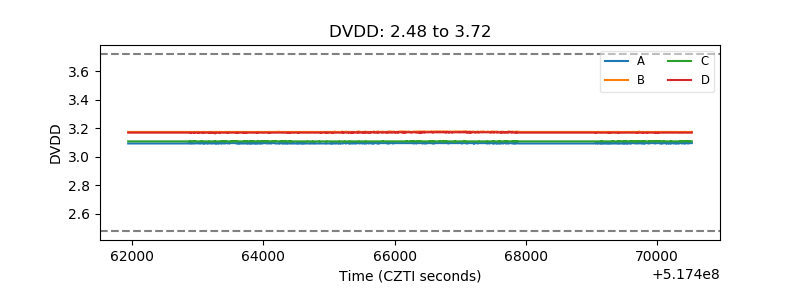 |
| Temperature 1 | 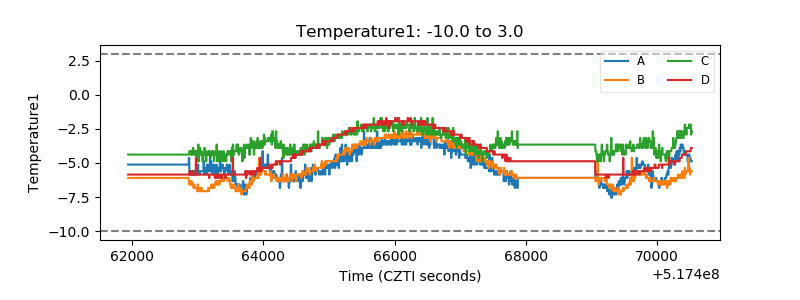 |
| Veto HV Monitor | 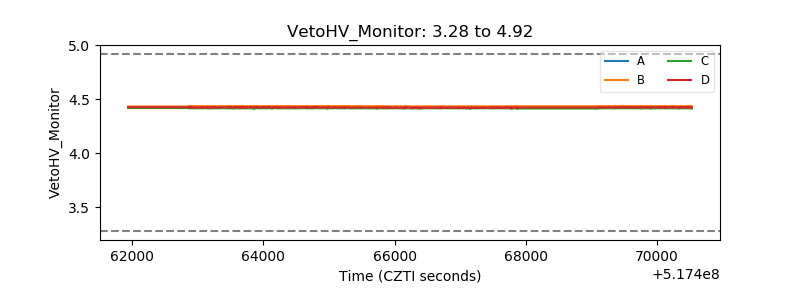 |
| Veto LLD | 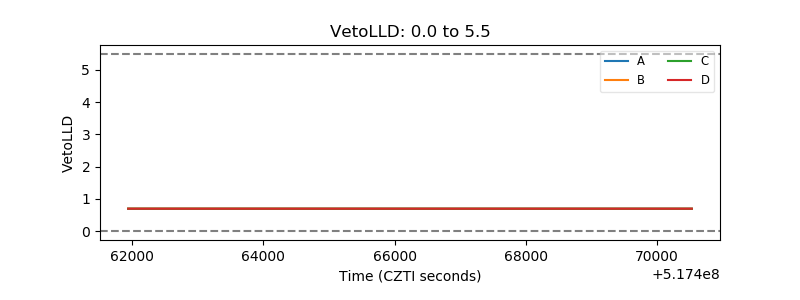 |
| Alpha Counter | 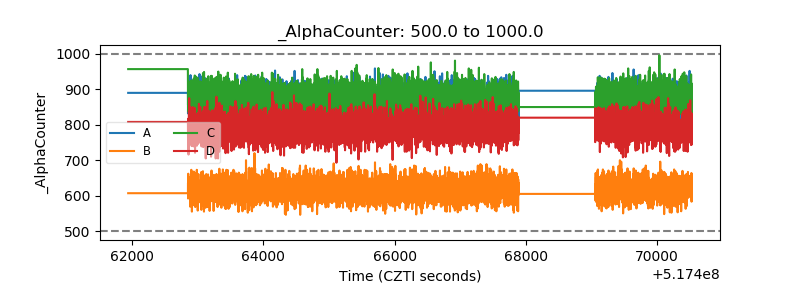 |
| _CPM_Rate | 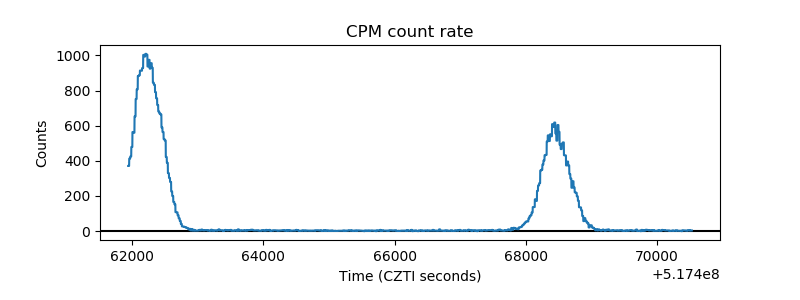 |
| CZT Counter | 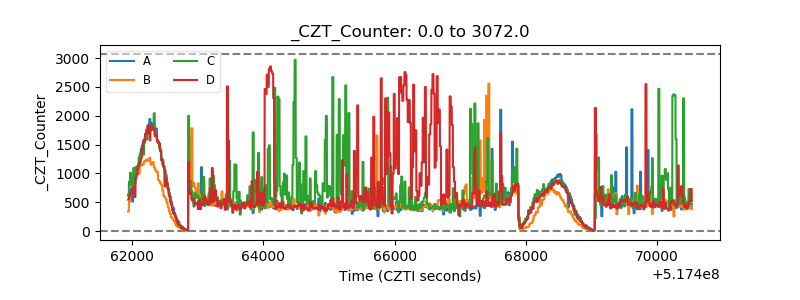 |
| +2.5 Volts monitor |  |
| +5 Volts monitor |  |
| _ROLL_ROT | 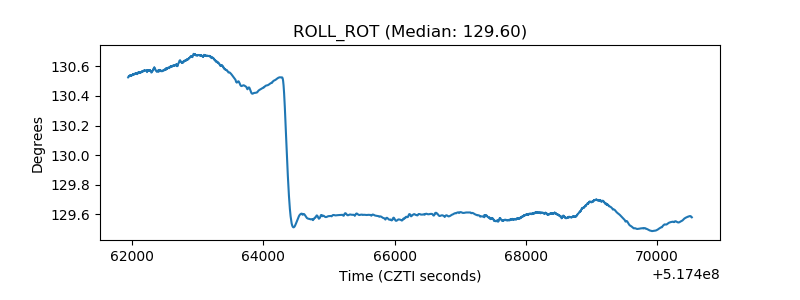 |
| _Roll_DEC | 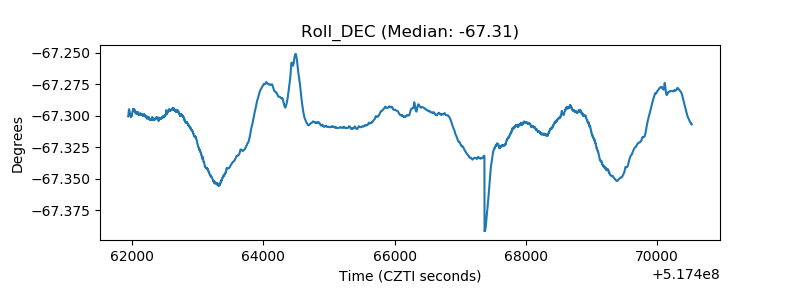 |
| _Roll_RA | 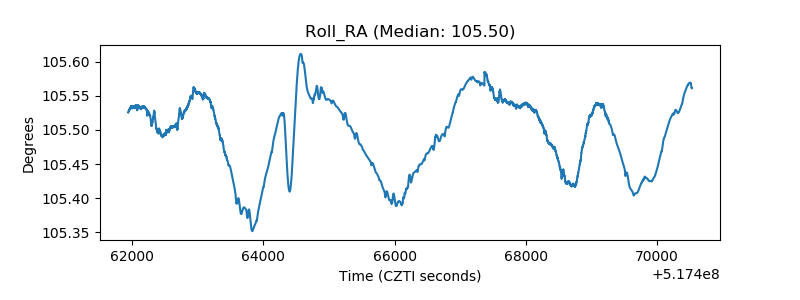 |
| Veto Counter | 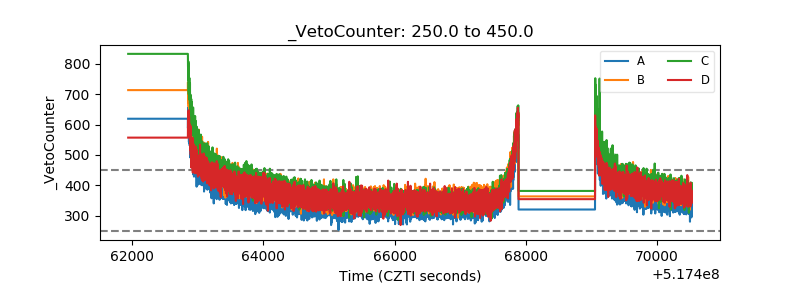 |