| Param | Original file | Final file |
|---|---|---|
| Filename | modeM0/AS1A14_125T09_9000006578_57671cztM0_level2.fits | modeM0/AS1A14_125T09_9000006578_57671cztM0_level2_quad_clean.evt |
| Size (bytes) | 446,313,600 | 87,088,320 |
| Size | 425.6 MB | 83.1 MB |
| Events in quadrant A | 2,803,190 | 586,278 |
| Events in quadrant B | 5,771,249 | 566,754 |
| Events in quadrant C | 4,113,019 | 552,705 |
| Events in quadrant D | 3,374,635 | 518,835 |
| Mode M9 | |||
|---|---|---|---|
| Quadrant | BADHDUFLAG | Total packets | Discarded packets |
| A | 0 | 11 | 0 |
| B | 0 | 11 | 0 |
| C | 0 | 11 | 0 |
| D | 0 | 11 | 0 |
| Mode SS | |||
|---|---|---|---|
| Quadrant | BADHDUFLAG | Total packets | Discarded packets |
| A | 0 | 120 | 0 |
| B | 0 | 120 | 0 |
| C | 0 | 120 | 0 |
| D | 0 | 120 | 0 |
| Mode M0 | |||
|---|---|---|---|
| Quadrant | BADHDUFLAG | Total packets | Discarded packets |
| A | 0 | 12428 | 1 |
| B | 0 | 21122 | 1 |
| C | 0 | 16295 | 3 |
| D | 0 | 14111 | 1 |
| Quadrant | Total seconds | Saturated seconds | Saturation percentage |
|---|---|---|---|
| A | 5902 | 60 | 1.016605% |
| B | 5902 | 986 | 16.706201% |
| C | 5901 | 246 | 4.168785% |
| D | 5902 | 174 | 2.948153% |
Noise dominated data is calculated using 1-second bins in cleaned event files. If a bin has >2000 counts, and if more than 50% of those come from <1% of pixels, then it is considered to be noise-dominated and hence unusable.
| Quadrant | # 1 sec bins | Bins with >0 counts | Bins with >2000 counts | High rate bins dominated by noise | Noise dominated (total time) | Noise dominated (detector-on time) | Marked lightcurve |
|---|---|---|---|---|---|---|---|
| A | 6972 | 5902 | 3 | 3 | 0.04% | 0.05% | 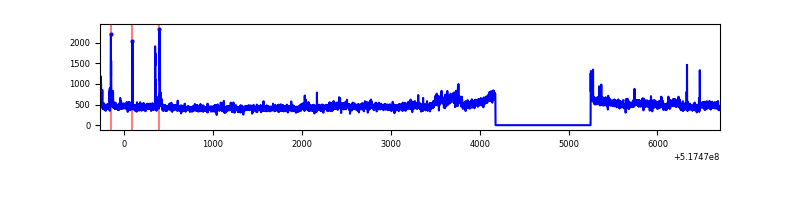 |
| B | 6972 | 5902 | 233 | 233 | 3.34% | 3.95% | 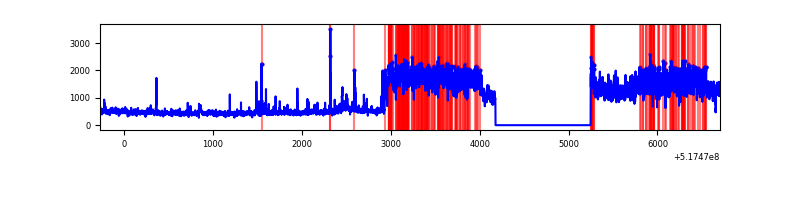 |
| C | 6971 | 5902 | 147 | 147 | 2.11% | 2.49% | 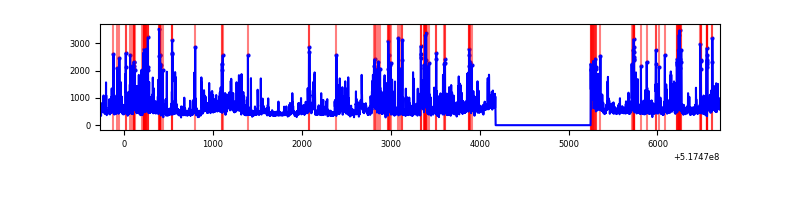 |
| D | 6972 | 5902 | 138 | 138 | 1.98% | 2.34% | 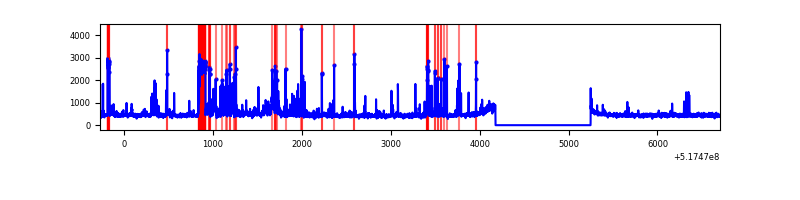 |
Top three noisy pixels from each quadrant. If the there are fewer than three noisy pixels in the level2.evt file, extra rows are filled as -1
| Pixel properties | Quadrant properties | ||||||
|---|---|---|---|---|---|---|---|
| Quadrant | DetID | PixID | Counts | Sigma | Mean | Median | Sigma |
| A | 4 | 95 | 151107 | 945.9 | 651 | 634 | 159.1 |
| A | 11 | 31 | 65208 | 405.92 | 651 | 634 | 159.1 |
| A | 7 | 223 | 42961 | 266.07 | 651 | 634 | 159.1 |
| B | 4 | 80 | 3076318 | 23289.32 | 623 | 599 | 132.1 |
| B | 5 | 185 | 90517 | 680.86 | 623 | 599 | 132.1 |
| B | 10 | 247 | 39568 | 295.07 | 623 | 599 | 132.1 |
| C | 15 | 224 | 1128775 | 6629.79 | 629 | 622 | 170.2 |
| C | 12 | 252 | 193425 | 1133.04 | 629 | 622 | 170.2 |
| C | 12 | 254 | 188717 | 1105.37 | 629 | 622 | 170.2 |
| D | 8 | 240 | 558076 | 3109.07 | 631 | 601 | 179.3 |
| D | 2 | 120 | 108460 | 601.53 | 631 | 601 | 179.3 |
| D | 15 | 201 | 50894 | 280.48 | 631 | 601 | 179.3 |
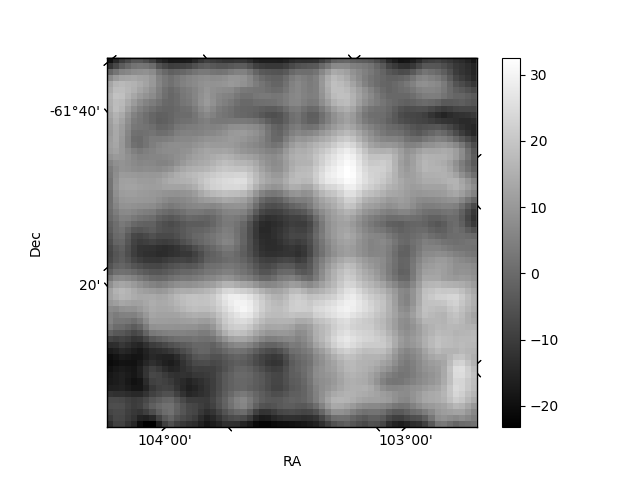
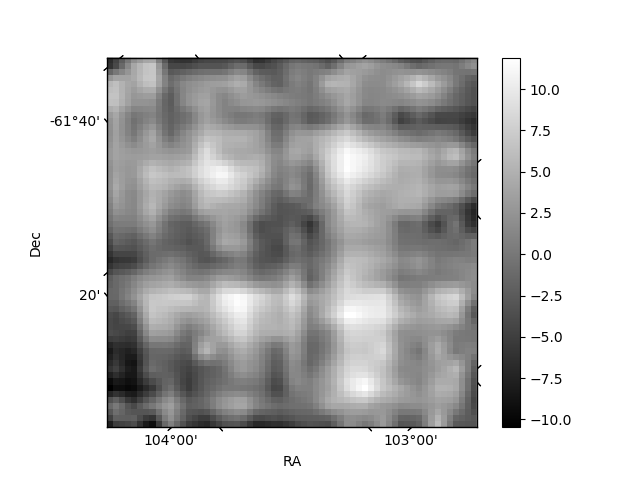
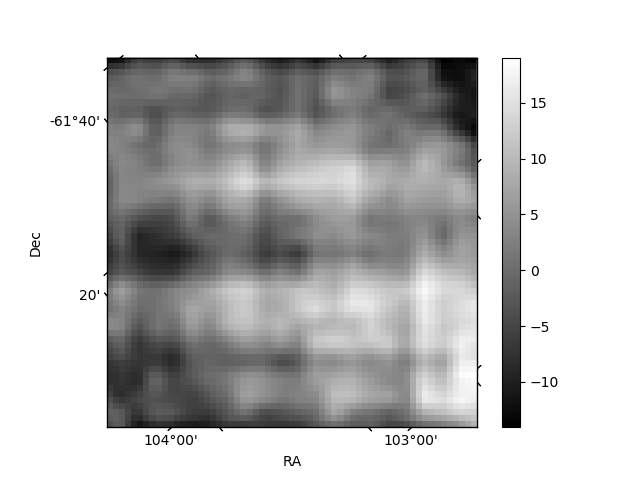
Histogram calculated using DETX and DETY for each event in the final _common_clean file
| Quadrant A | 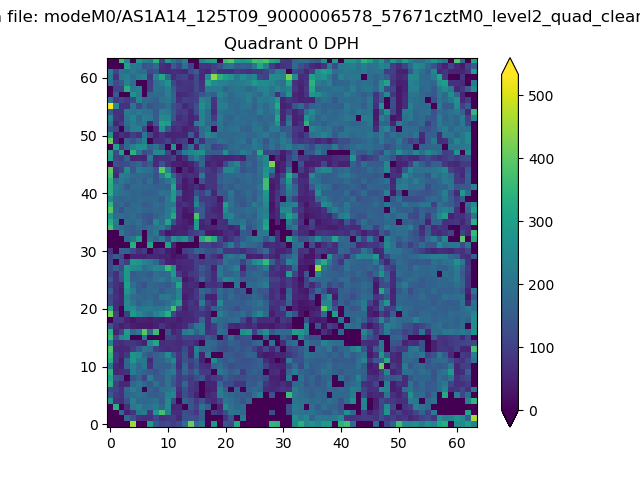 |
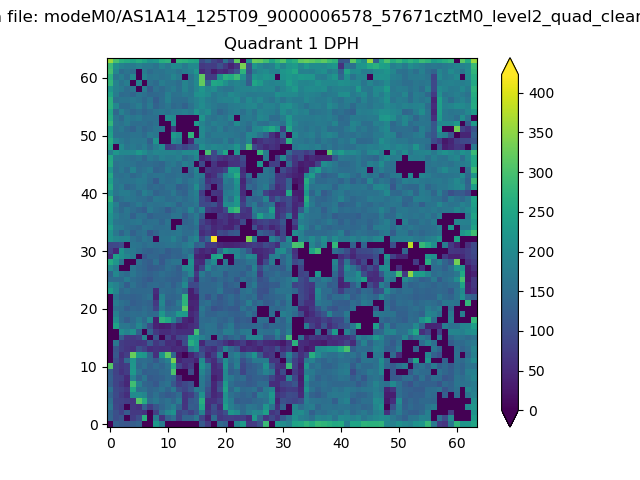 |
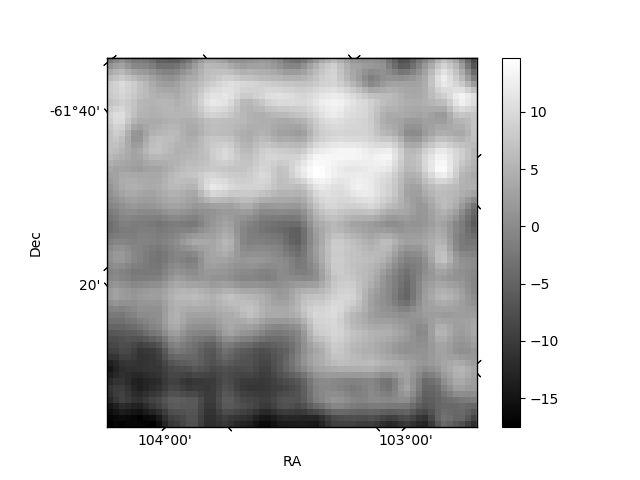
Quadrant B |
|---|---|---|---|
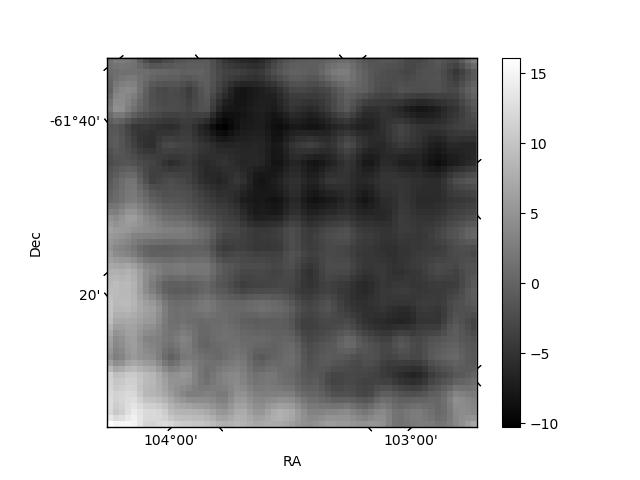
| Quadrant D | 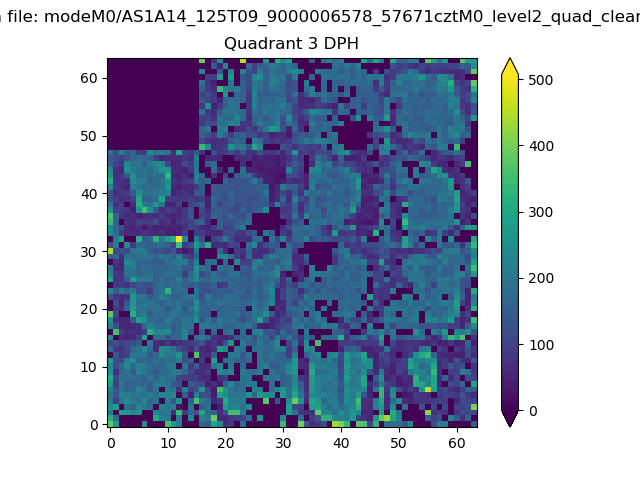 |
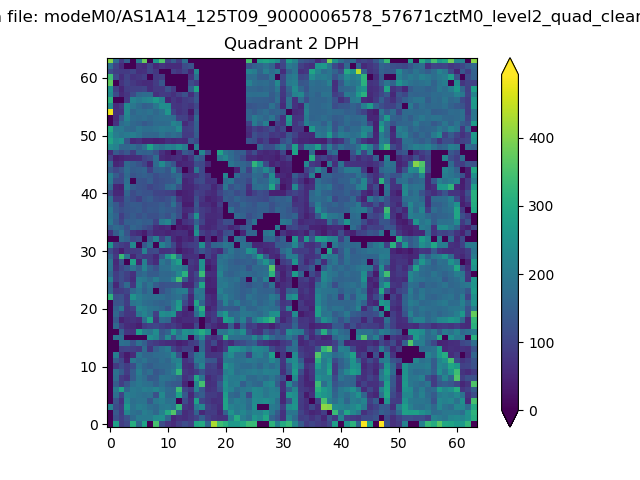 |
Quadrant C |
| Plot type | Count rate plots | Images |
|---|---|---|
| Comparison with Poisson distribution Blue bars denote a histogram of data divided into 1 sec bins. Red curve is a Poisson curve with rate = median count rate of data. |
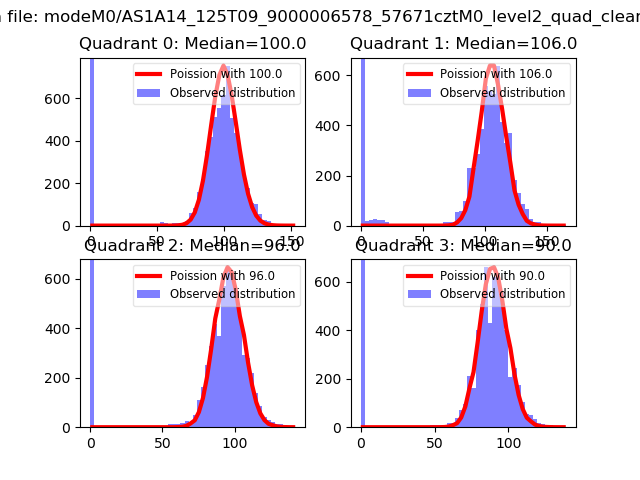 |
 |
| Quadrant-wise count rates Data is divided into 100 sec bins |
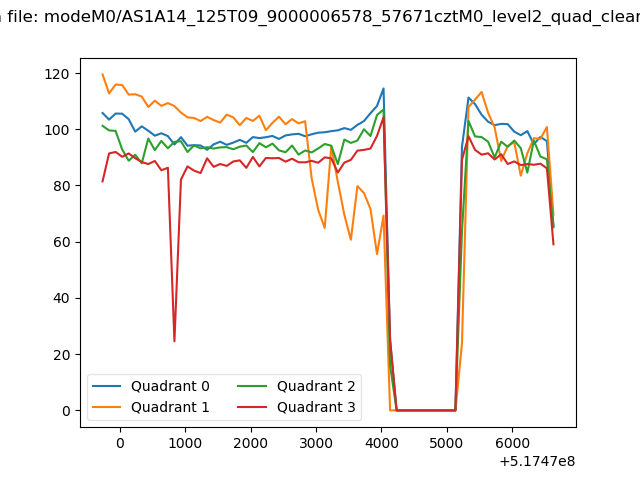 |
|
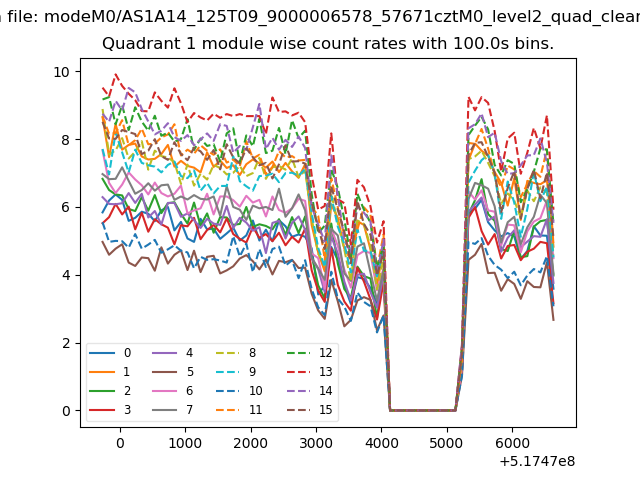
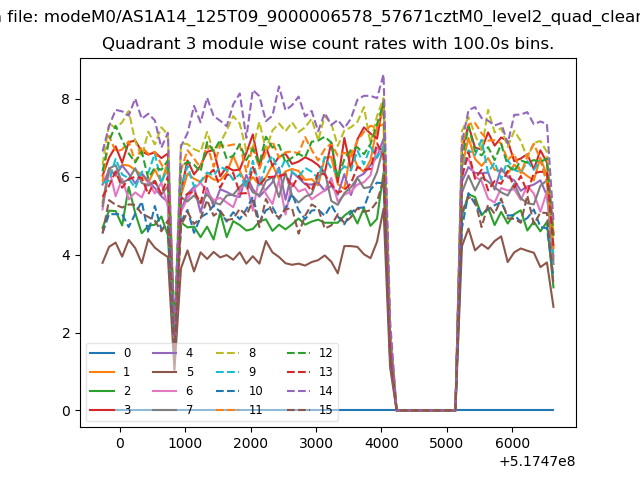
| Module-wise count rates for Quadrant A Data is divided into 100 sec bins |
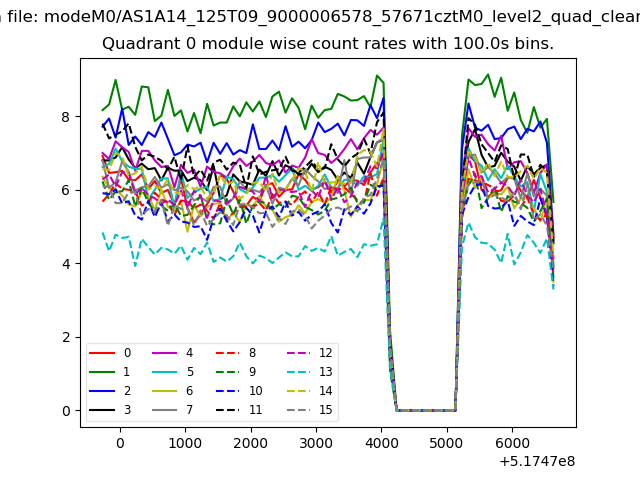 |
 |
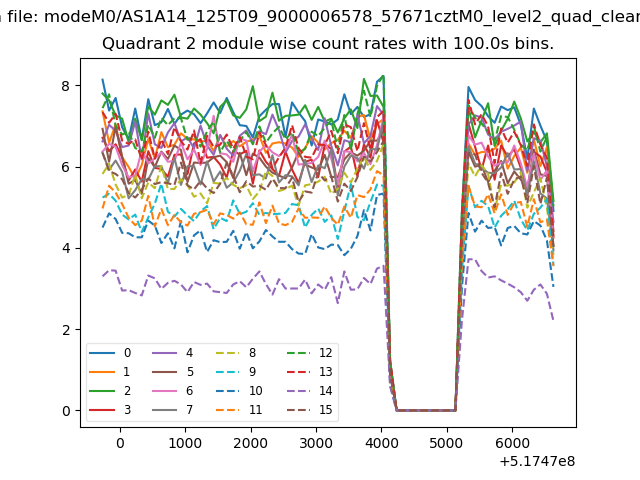
| Module-wise count rates for Quadrant B Data is divided into 100 sec bins |
 |
 |
| Module-wise count rates for Quadrant C Data is divided into 100 sec bins |
 |
 |
| Module-wise count rates for Quadrant D Data is divided into 100 sec bins |
 |
 |
| Parameter | Plot |
|---|---|
| CZT HV Monitor | 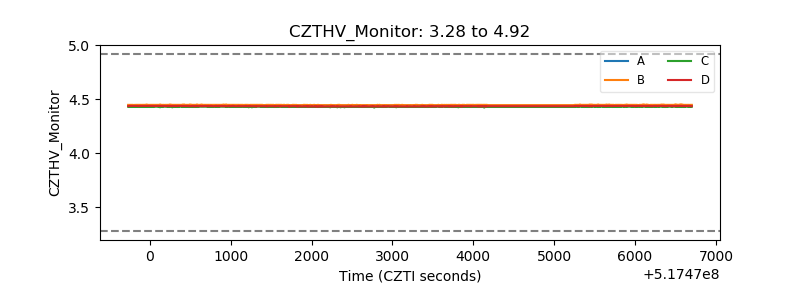 |
| D_VDD | 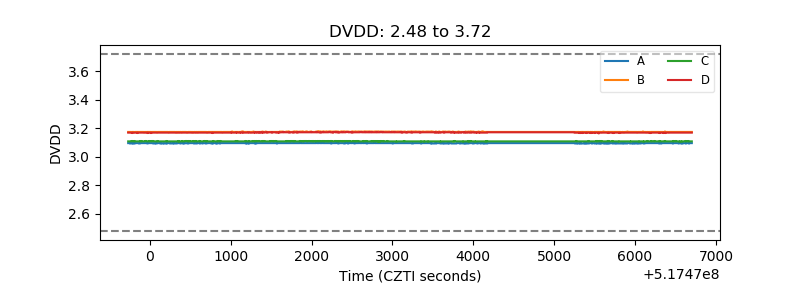 |
| Temperature 1 | 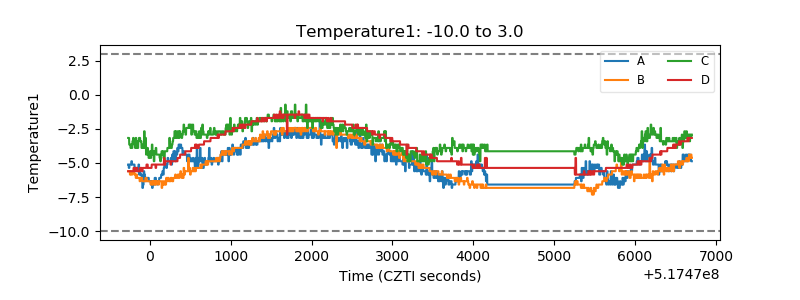 |
| Veto HV Monitor | 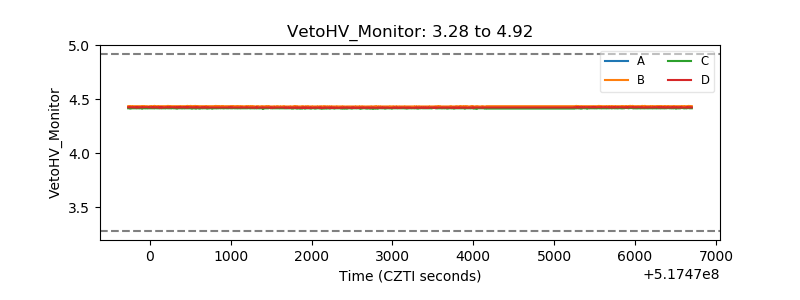 |
| Veto LLD | 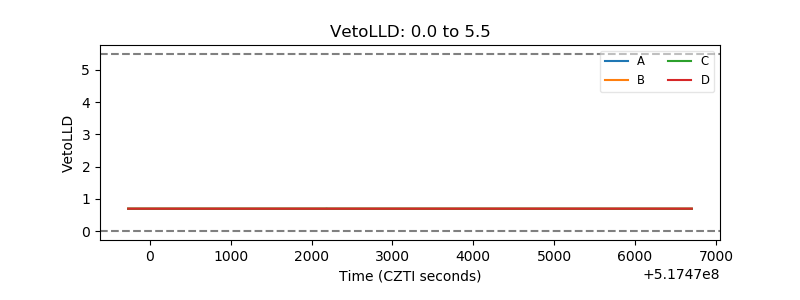 |
| Alpha Counter | 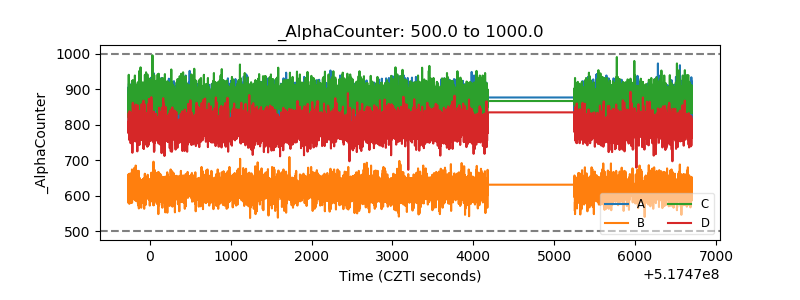 |
| _CPM_Rate | 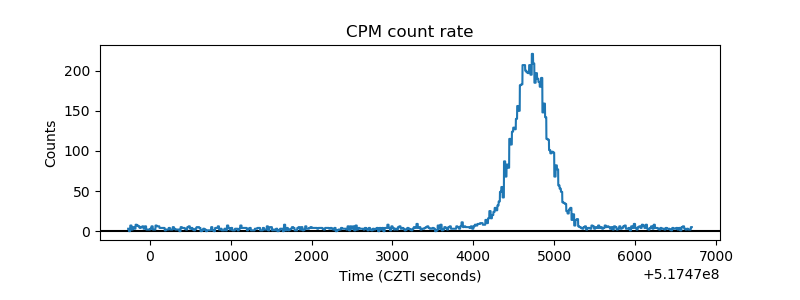 |
| CZT Counter | 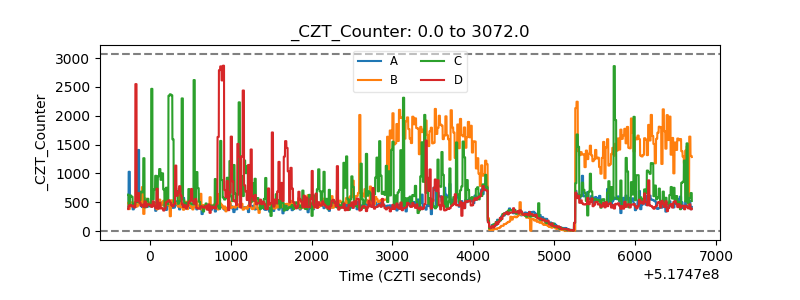 |
| +2.5 Volts monitor |  |
| +5 Volts monitor |  |
| _ROLL_ROT | 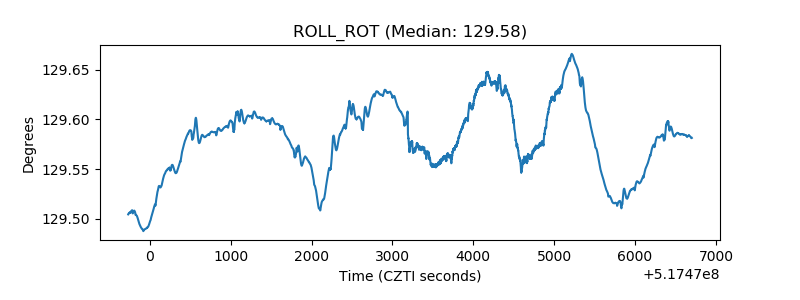 |
| _Roll_DEC | 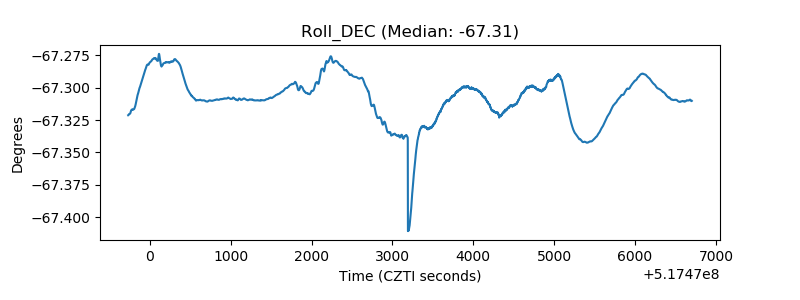 |
| _Roll_RA | 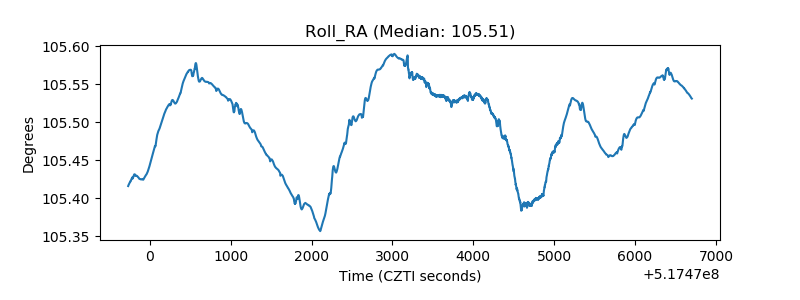 |
| Veto Counter | 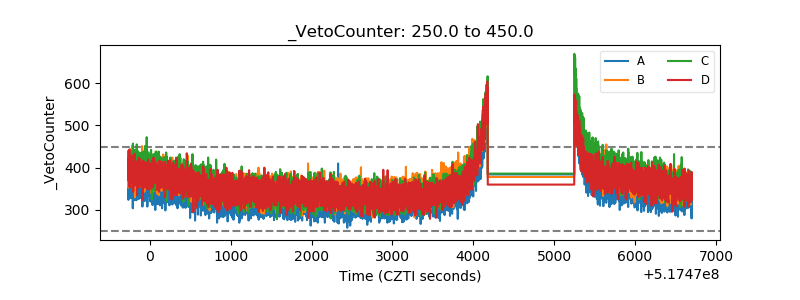 |