| Param | Original file | Final file |
|---|---|---|
| Filename | modeM0/AS1A14_125T09_9000006578_57672cztM0_level2.fits | modeM0/AS1A14_125T09_9000006578_57672cztM0_level2_quad_clean.evt |
| Size (bytes) | 441,385,920 | 92,707,200 |
| Size | 420.9 MB | 88.4 MB |
| Events in quadrant A | 2,888,480 | 608,938 |
| Events in quadrant B | 4,174,615 | 642,713 |
| Events in quadrant C | 4,578,104 | 575,940 |
| Events in quadrant D | 4,203,560 | 536,504 |
| Mode M9 | |||
|---|---|---|---|
| Quadrant | BADHDUFLAG | Total packets | Discarded packets |
| A | 0 | 7 | 0 |
| B | 0 | 7 | 0 |
| C | 0 | 7 | 0 |
| D | 0 | 7 | 0 |
| Mode SS | |||
|---|---|---|---|
| Quadrant | BADHDUFLAG | Total packets | Discarded packets |
| A | 0 | 128 | 0 |
| B | 0 | 128 | 0 |
| C | 0 | 128 | 0 |
| D | 0 | 128 | 0 |
| Mode M0 | |||
|---|---|---|---|
| Quadrant | BADHDUFLAG | Total packets | Discarded packets |
| A | 0 | 13087 | 1 |
| B | 0 | 16689 | 1 |
| C | 0 | 18027 | 1 |
| D | 0 | 16882 | 1 |
| Quadrant | Total seconds | Saturated seconds | Saturation percentage |
|---|---|---|---|
| A | 6351 | 113 | 1.779247% |
| B | 6351 | 357 | 5.621162% |
| C | 6351 | 318 | 5.007085% |
| D | 6351 | 309 | 4.865376% |
Noise dominated data is calculated using 1-second bins in cleaned event files. If a bin has >2000 counts, and if more than 50% of those come from <1% of pixels, then it is considered to be noise-dominated and hence unusable.
| Quadrant | # 1 sec bins | Bins with >0 counts | Bins with >2000 counts | High rate bins dominated by noise | Noise dominated (total time) | Noise dominated (detector-on time) | Marked lightcurve |
|---|---|---|---|---|---|---|---|
| A | 7066 | 6351 | 3 | 3 | 0.04% | 0.05% | 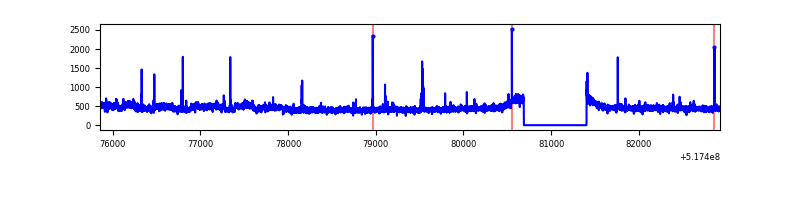 |
| B | 7066 | 6351 | 74 | 74 | 1.05% | 1.17% | 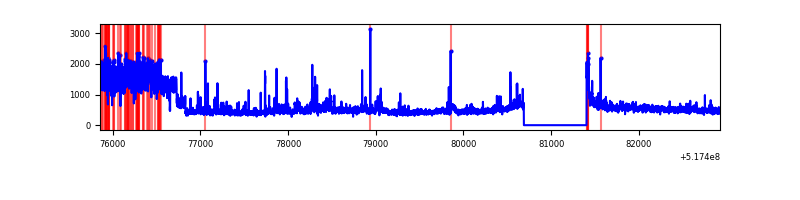 |
| C | 7066 | 6351 | 221 | 221 | 3.13% | 3.48% | 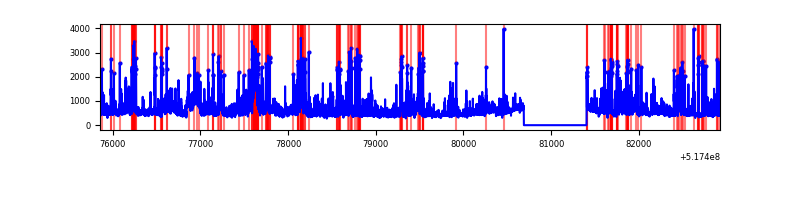 |
| D | 7066 | 6351 | 226 | 226 | 3.20% | 3.56% | 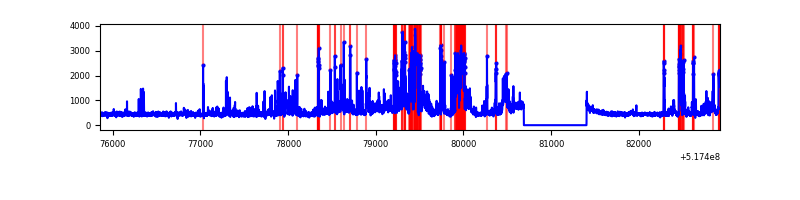 |
Top three noisy pixels from each quadrant. If the there are fewer than three noisy pixels in the level2.evt file, extra rows are filled as -1
| Pixel properties | Quadrant properties | ||||||
|---|---|---|---|---|---|---|---|
| Quadrant | DetID | PixID | Counts | Sigma | Mean | Median | Sigma |
| A | 11 | 31 | 99870 | 582.91 | 695 | 674 | 170.2 |
| A | 4 | 95 | 38641 | 223.11 | 695 | 674 | 170.2 |
| A | 10 | 251 | 26367 | 150.98 | 695 | 674 | 170.2 |
| B | 4 | 80 | 1248349 | 8635.61 | 678 | 652 | 144.5 |
| B | 5 | 185 | 83817 | 575.6 | 678 | 652 | 144.5 |
| B | 0 | 213 | 31376 | 212.65 | 678 | 652 | 144.5 |
| C | 15 | 224 | 1223773 | 6734.91 | 668 | 659 | 181.6 |
| C | 9 | 38 | 242360 | 1330.89 | 668 | 659 | 181.6 |
| C | 12 | 252 | 201927 | 1108.25 | 668 | 659 | 181.6 |
| D | 8 | 240 | 776869 | 4125.47 | 670 | 638 | 188.2 |
| D | 8 | 160 | 321707 | 1706.4 | 670 | 638 | 188.2 |
| D | 2 | 120 | 97969 | 517.29 | 670 | 638 | 188.2 |
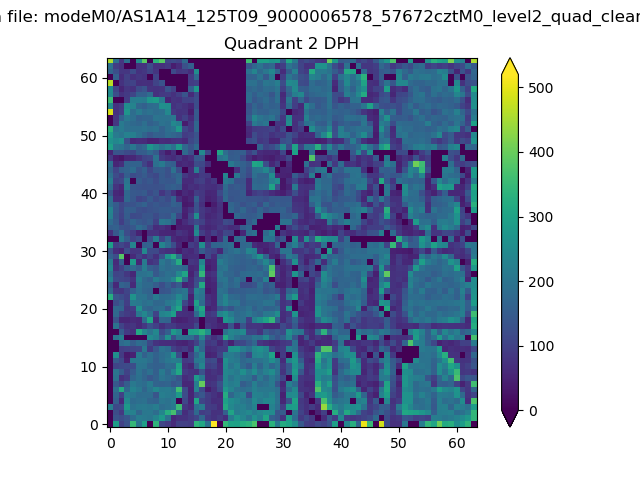
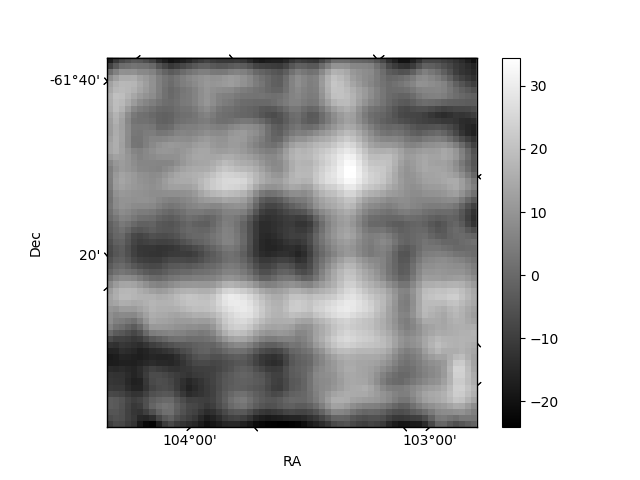
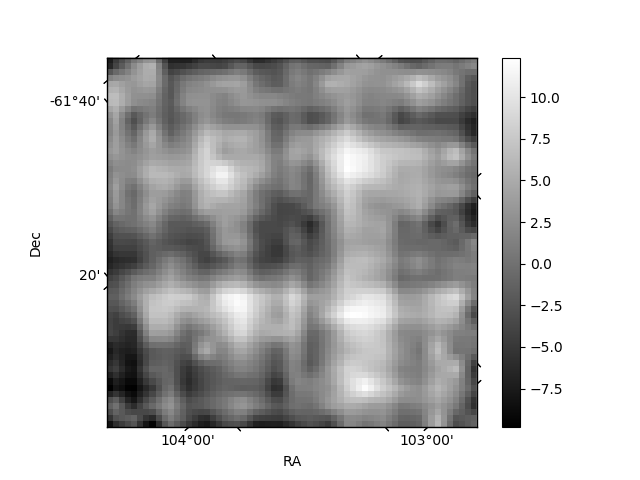
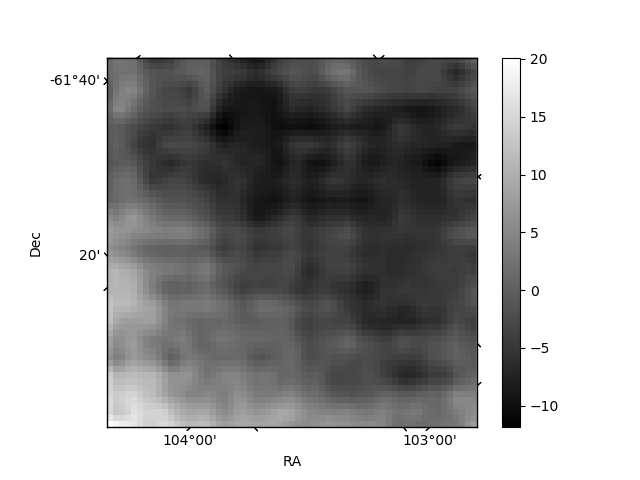
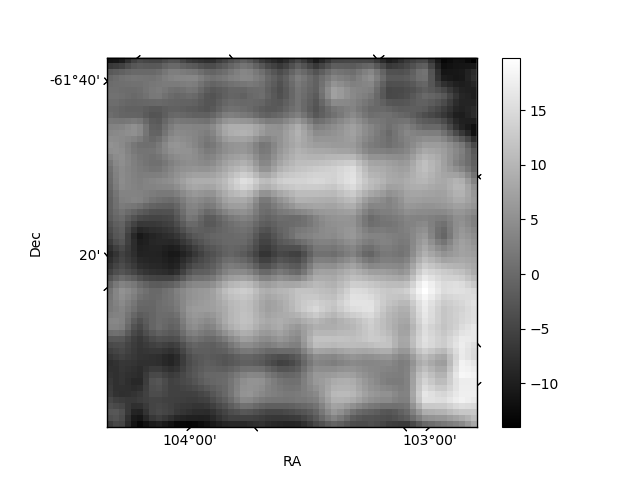
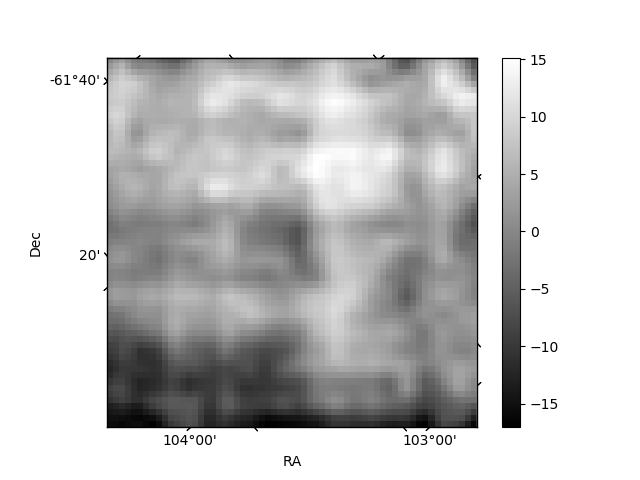
Histogram calculated using DETX and DETY for each event in the final _common_clean file
| Quadrant A | 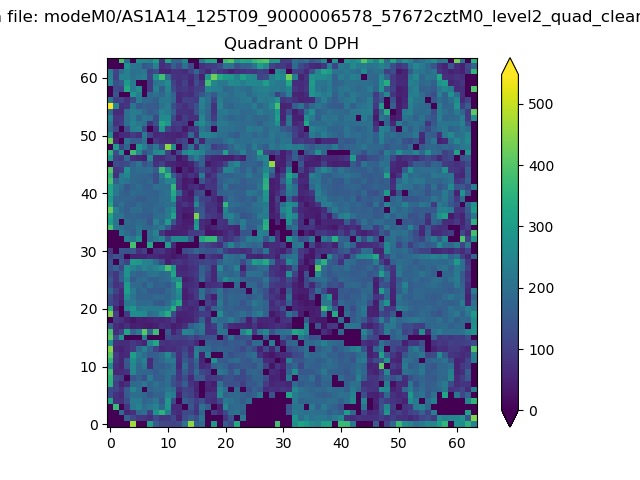 |
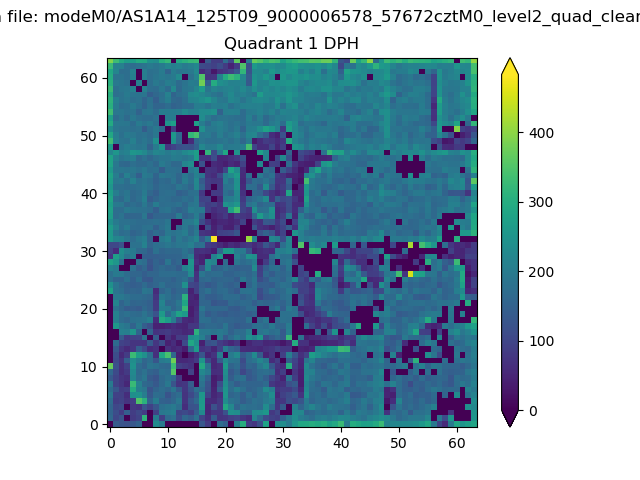 |
Quadrant B |
|---|---|---|---|
| Quadrant D | 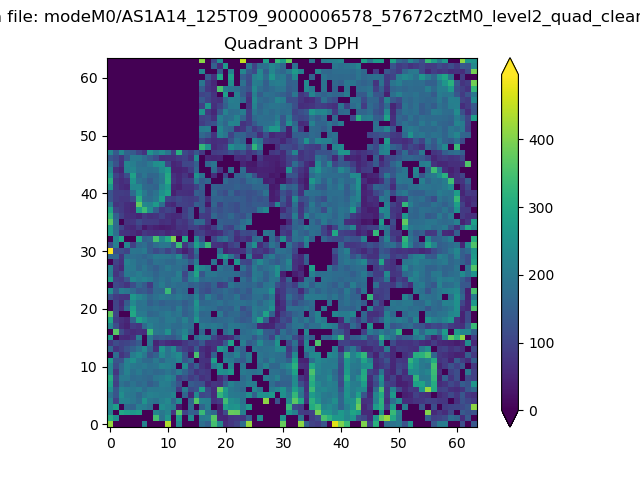 |
 |
Quadrant C |
| Plot type | Count rate plots | Images |
|---|---|---|
| Comparison with Poisson distribution Blue bars denote a histogram of data divided into 1 sec bins. Red curve is a Poisson curve with rate = median count rate of data. |
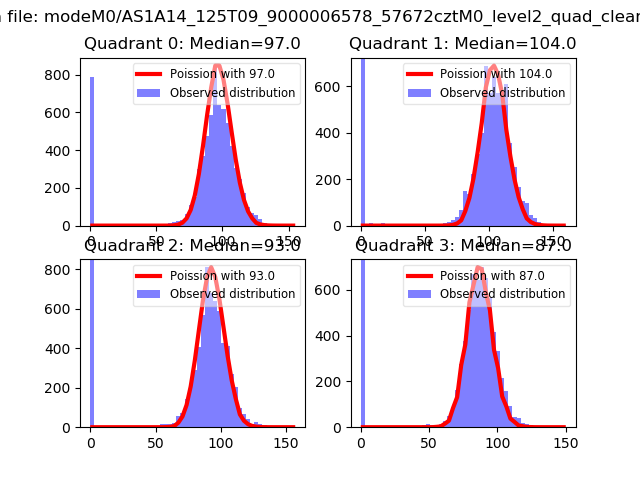 |
 |
| Quadrant-wise count rates Data is divided into 100 sec bins |
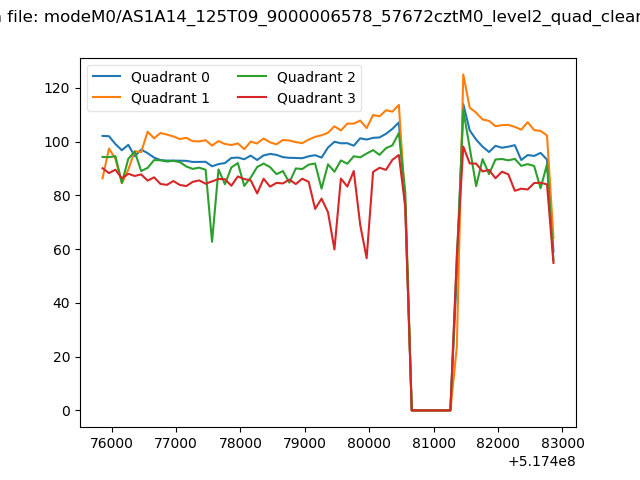 |
|
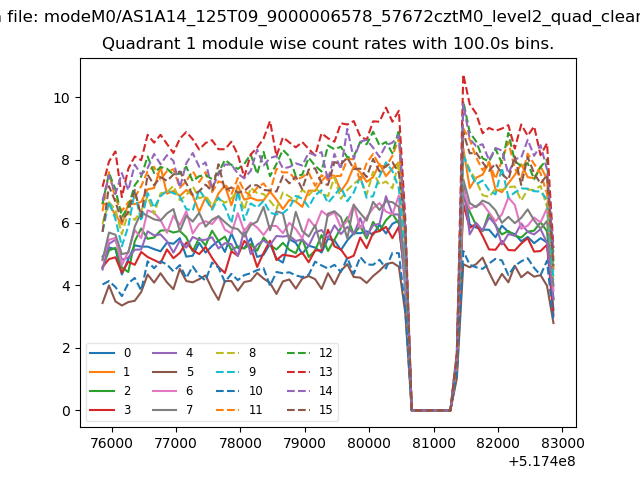
| Module-wise count rates for Quadrant A Data is divided into 100 sec bins |
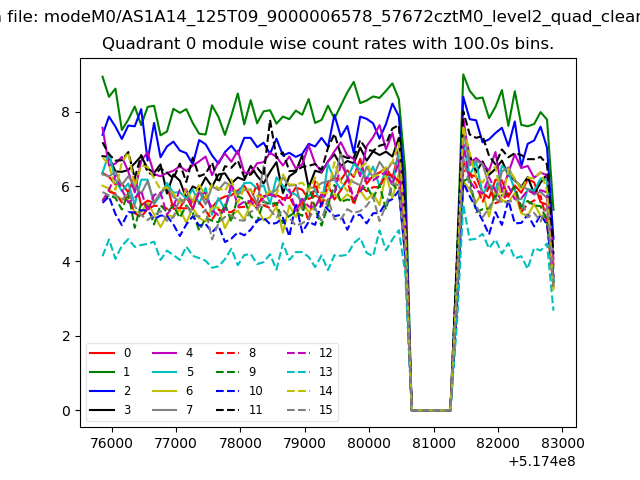 |
 |
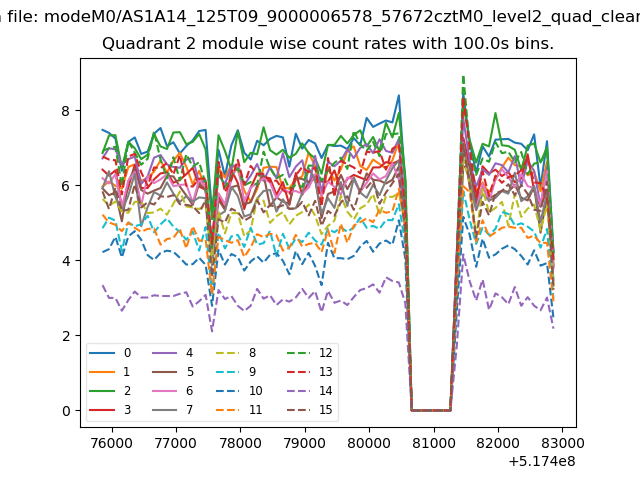
| Module-wise count rates for Quadrant B Data is divided into 100 sec bins |
 |
 |
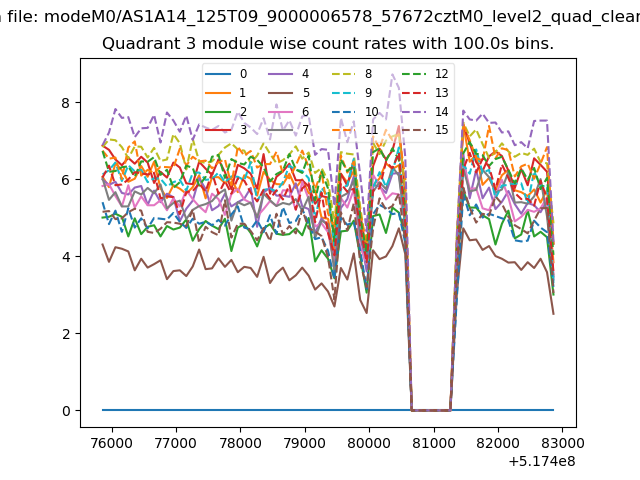
| Module-wise count rates for Quadrant C Data is divided into 100 sec bins |
 |
 |
| Module-wise count rates for Quadrant D Data is divided into 100 sec bins |
 |
 |
| Parameter | Plot |
|---|---|
| CZT HV Monitor | 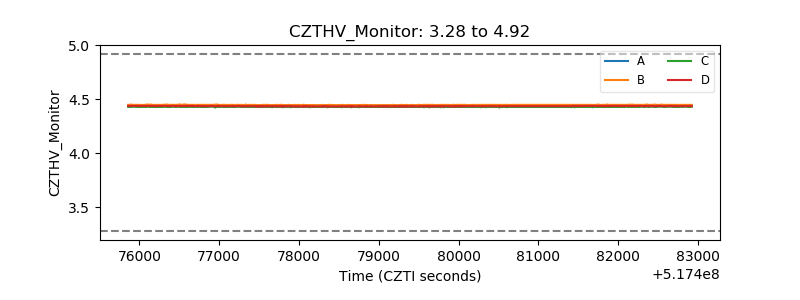 |
| D_VDD | 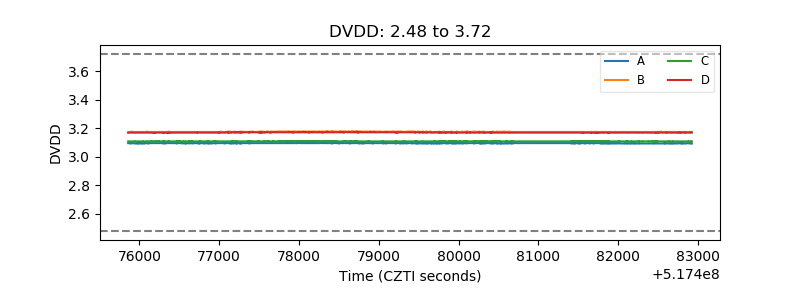 |
| Temperature 1 | 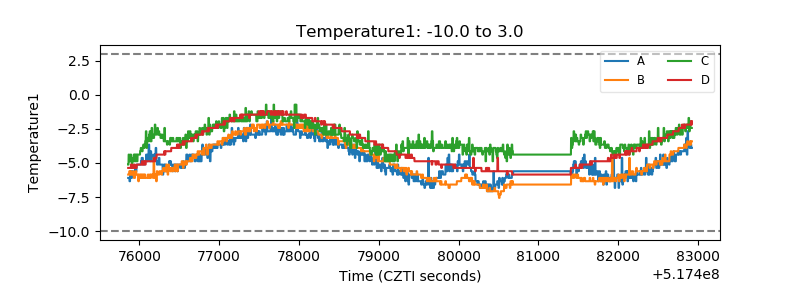 |
| Veto HV Monitor |  |
| Veto LLD | 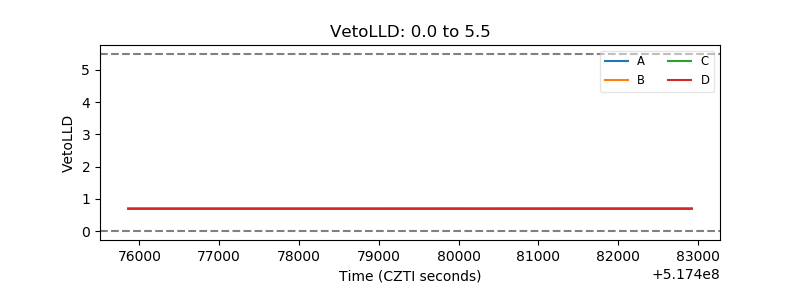 |
| Alpha Counter | 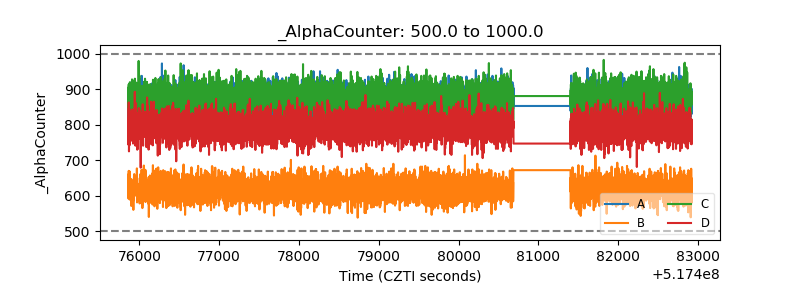 |
| _CPM_Rate | 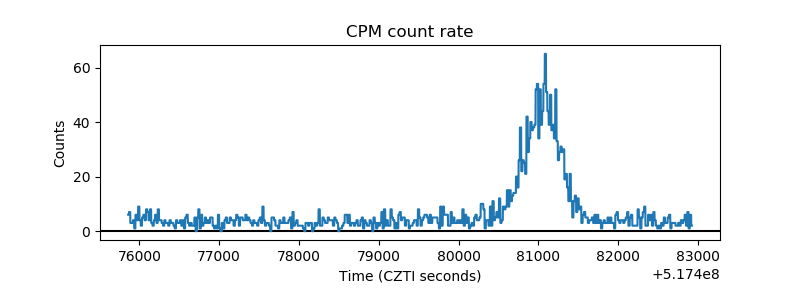 |
| CZT Counter | 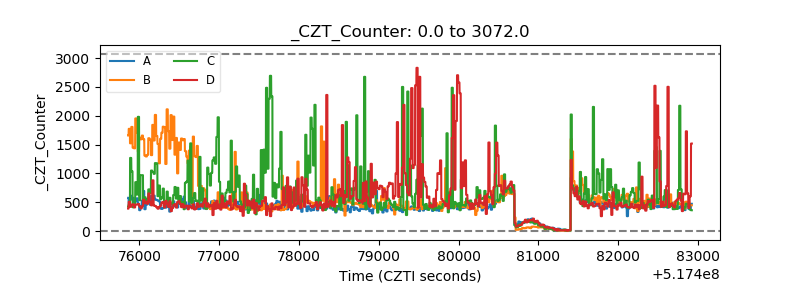 |
| +2.5 Volts monitor | 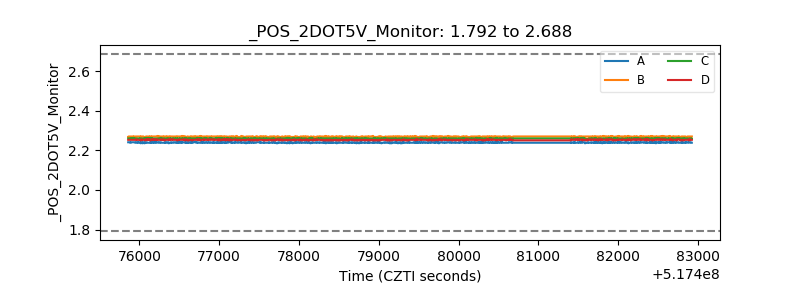 |
| +5 Volts monitor | 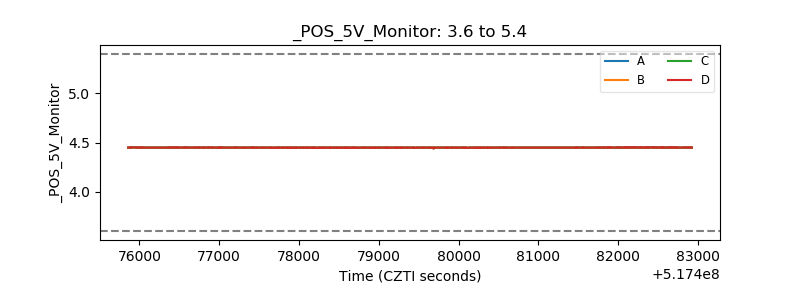 |
| _ROLL_ROT | 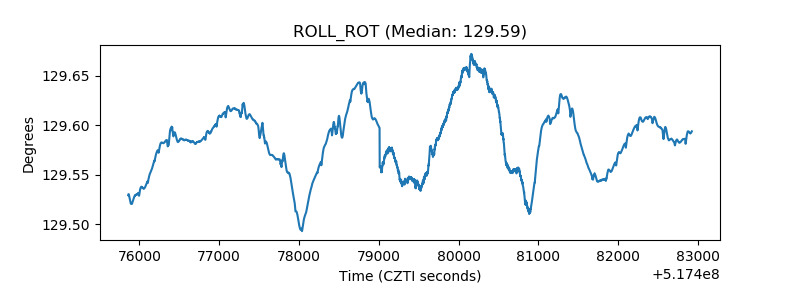 |
| _Roll_DEC | 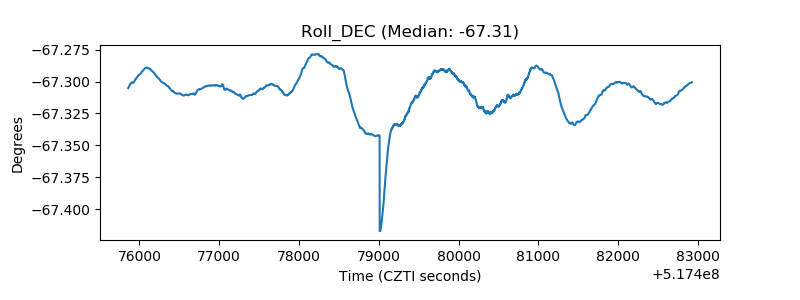 |
| _Roll_RA | 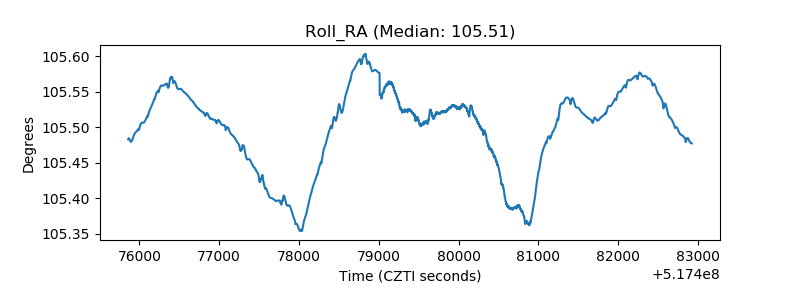 |
| Veto Counter | 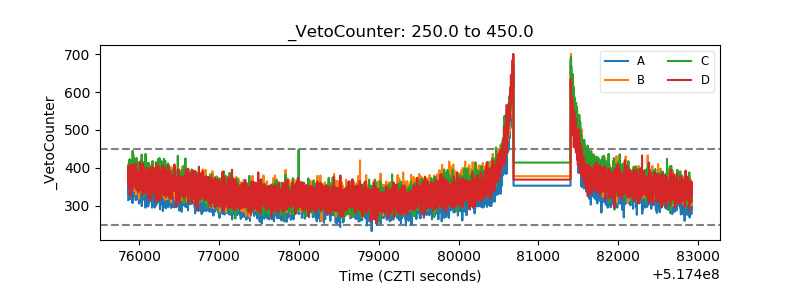 |