| Param | Original file | Final file |
|---|---|---|
| Filename | modeM0/AS1A14_125T09_9000006578_57673cztM0_level2.fits | modeM0/AS1A14_125T09_9000006578_57673cztM0_level2_quad_clean.evt |
| Size (bytes) | 481,996,800 | 106,646,400 |
| Size | 459.7 MB | 101.7 MB |
| Events in quadrant A | 3,324,364 | 700,097 |
| Events in quadrant B | 4,359,865 | 727,232 |
| Events in quadrant C | 5,002,057 | 664,826 |
| Events in quadrant D | 4,581,831 | 622,907 |
| Mode SS | |||
|---|---|---|---|
| Quadrant | BADHDUFLAG | Total packets | Discarded packets |
| A | 0 | 150 | 0 |
| B | 0 | 150 | 0 |
| C | 0 | 150 | 0 |
| D | 0 | 150 | 0 |
| Mode M0 | |||
|---|---|---|---|
| Quadrant | BADHDUFLAG | Total packets | Discarded packets |
| A | 0 | 15388 | 2 |
| B | 0 | 18078 | 2 |
| C | 0 | 20064 | 2 |
| D | 0 | 18776 | 2 |
| Quadrant | Total seconds | Saturated seconds | Saturation percentage |
|---|---|---|---|
| A | 7380 | 175 | 2.371274% |
| B | 7381 | 414 | 5.608996% |
| C | 7381 | 354 | 4.796098% |
| D | 7381 | 332 | 4.498035% |
Noise dominated data is calculated using 1-second bins in cleaned event files. If a bin has >2000 counts, and if more than 50% of those come from <1% of pixels, then it is considered to be noise-dominated and hence unusable.
| Quadrant | # 1 sec bins | Bins with >0 counts | Bins with >2000 counts | High rate bins dominated by noise | Noise dominated (total time) | Noise dominated (detector-on time) | Marked lightcurve |
|---|---|---|---|---|---|---|---|
| A | 7455 | 7382 | 7 | 7 | 0.09% | 0.09% | 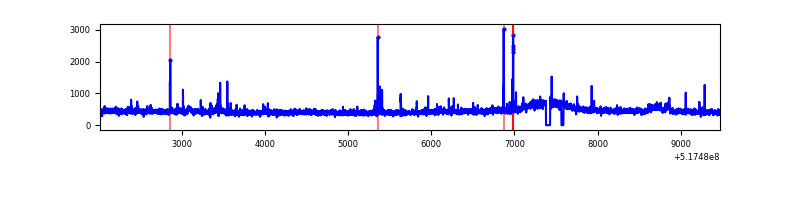 |
| B | 7456 | 7383 | 57 | 57 | 0.76% | 0.77% | 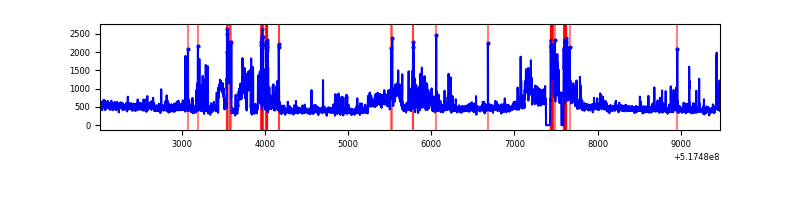 |
| C | 7456 | 7383 | 226 | 226 | 3.03% | 3.06% | 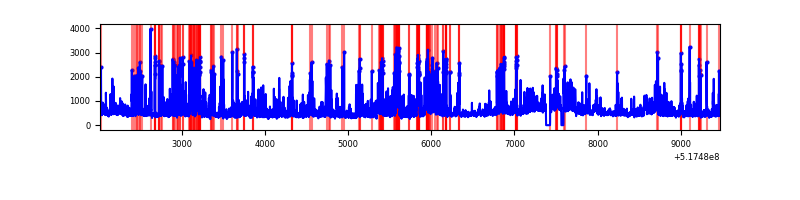 |
| D | 7456 | 7382 | 269 | 269 | 3.61% | 3.64% | 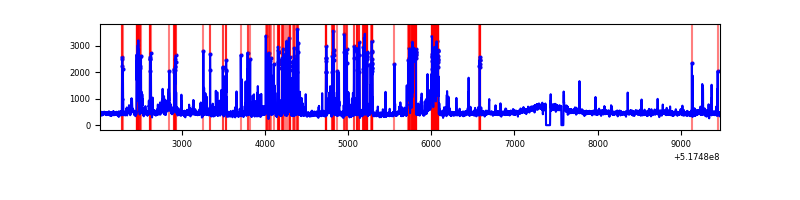 |
Top three noisy pixels from each quadrant. If the there are fewer than three noisy pixels in the level2.evt file, extra rows are filled as -1
| Pixel properties | Quadrant properties | ||||||
|---|---|---|---|---|---|---|---|
| Quadrant | DetID | PixID | Counts | Sigma | Mean | Median | Sigma |
| A | 4 | 95 | 74579 | 367.37 | 813 | 789 | 200.9 |
| A | 7 | 160 | 43634 | 213.3 | 813 | 789 | 200.9 |
| A | 10 | 251 | 25340 | 122.23 | 813 | 789 | 200.9 |
| B | 4 | 80 | 627291 | 3710.48 | 786 | 757 | 168.9 |
| B | 10 | 16 | 212088 | 1251.55 | 786 | 757 | 168.9 |
| B | 0 | 213 | 190337 | 1122.74 | 786 | 757 | 168.9 |
| C | 15 | 224 | 1451909 | 6906.23 | 780 | 772 | 210.1 |
| C | 12 | 2 | 285954 | 1357.23 | 780 | 772 | 210.1 |
| C | 14 | 254 | 55832 | 262.04 | 780 | 772 | 210.1 |
| D | 8 | 240 | 585707 | 2637.76 | 784 | 750 | 221.8 |
| D | 2 | 120 | 503407 | 2266.64 | 784 | 750 | 221.8 |
| D | 2 | 31 | 88914 | 397.56 | 784 | 750 | 221.8 |
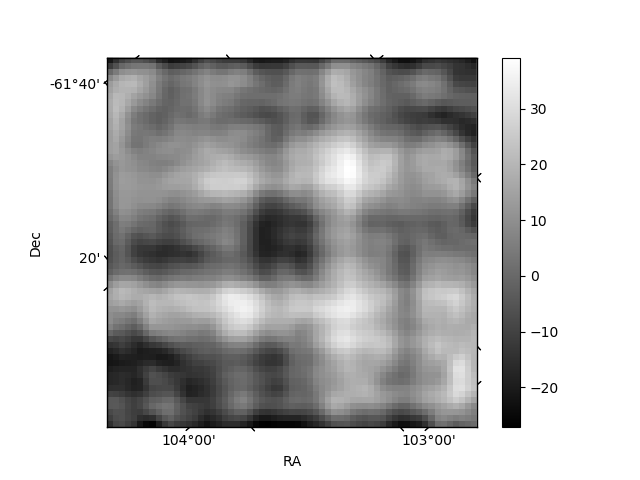
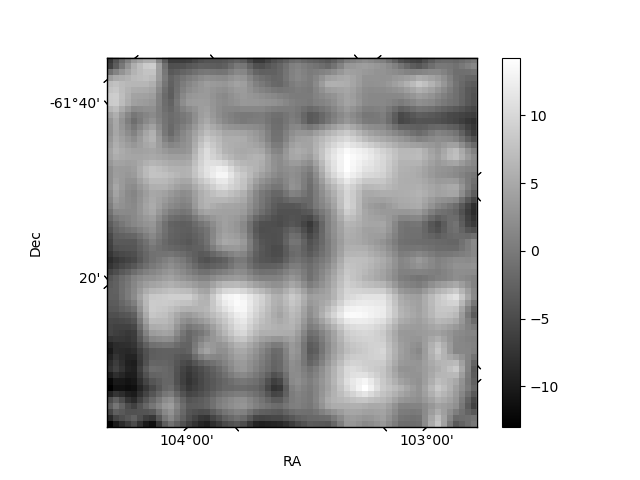
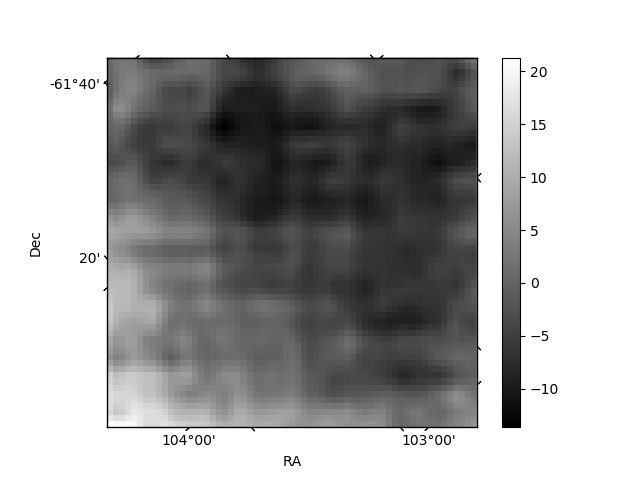
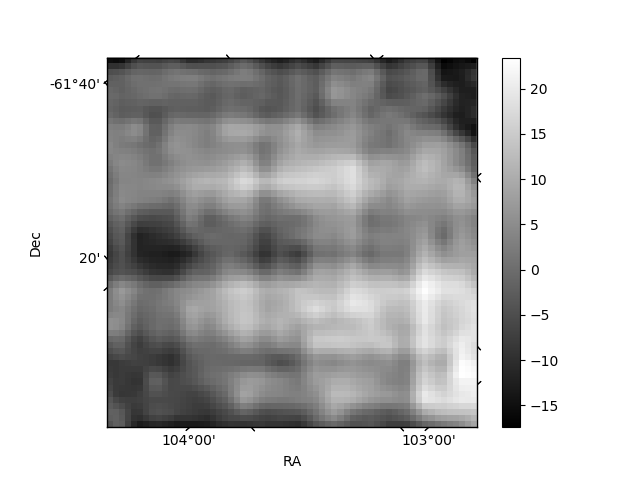
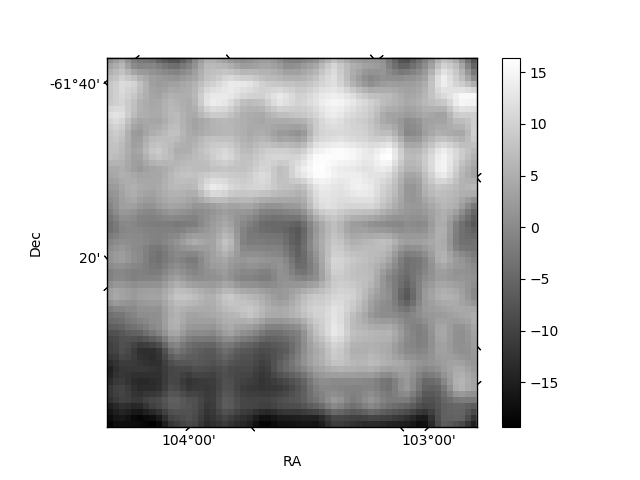
Histogram calculated using DETX and DETY for each event in the final _common_clean file
| Quadrant A | 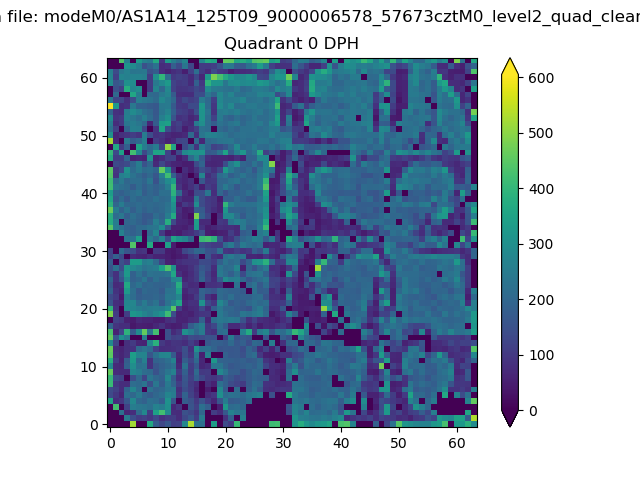 |
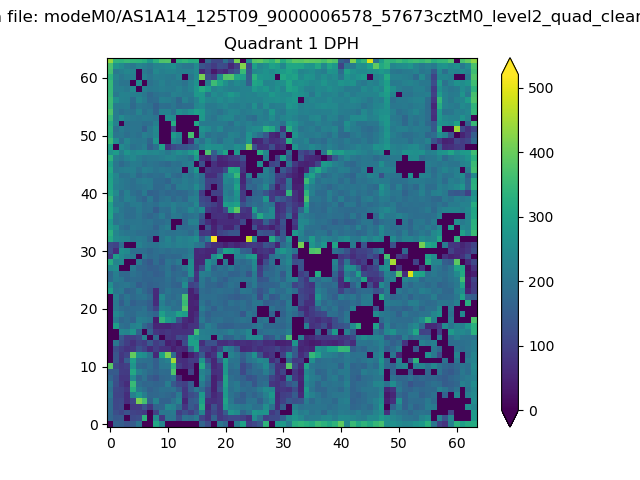 |
Quadrant B |
|---|---|---|---|
| Quadrant D | 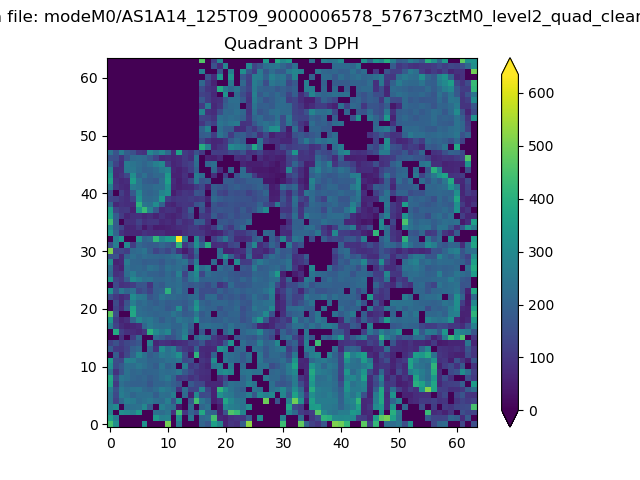 |
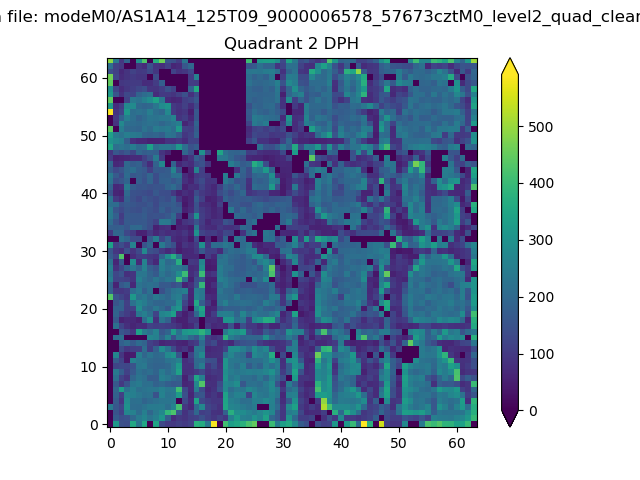 |
Quadrant C |
| Plot type | Count rate plots | Images |
|---|---|---|
| Comparison with Poisson distribution Blue bars denote a histogram of data divided into 1 sec bins. Red curve is a Poisson curve with rate = median count rate of data. |
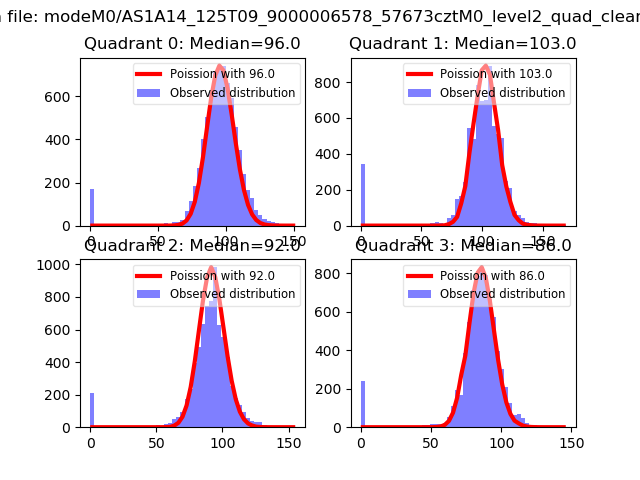 |
 |
| Quadrant-wise count rates Data is divided into 100 sec bins |
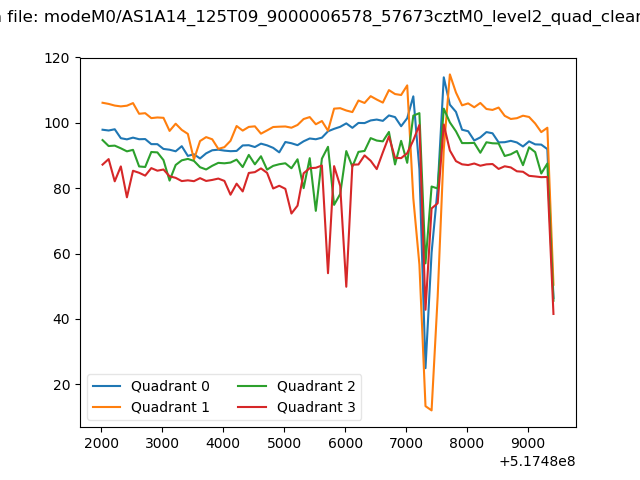 |
|
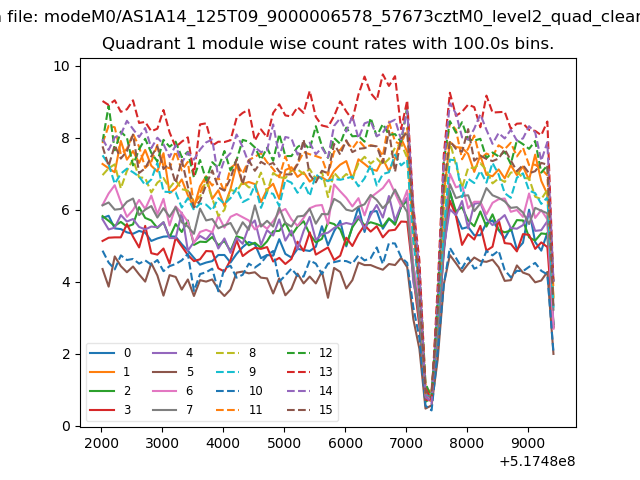
| Module-wise count rates for Quadrant A Data is divided into 100 sec bins |
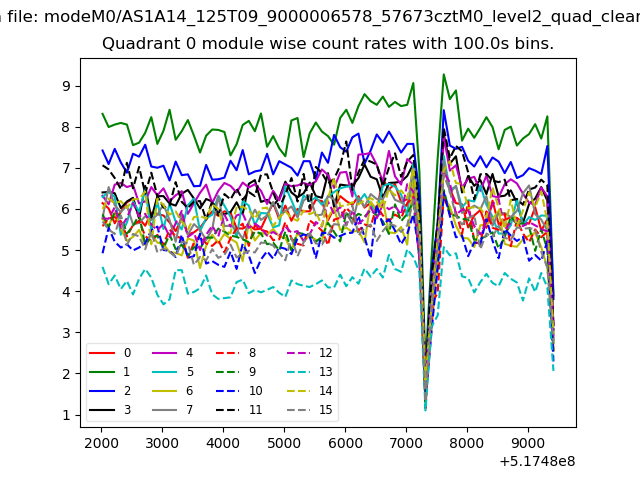 |
 |
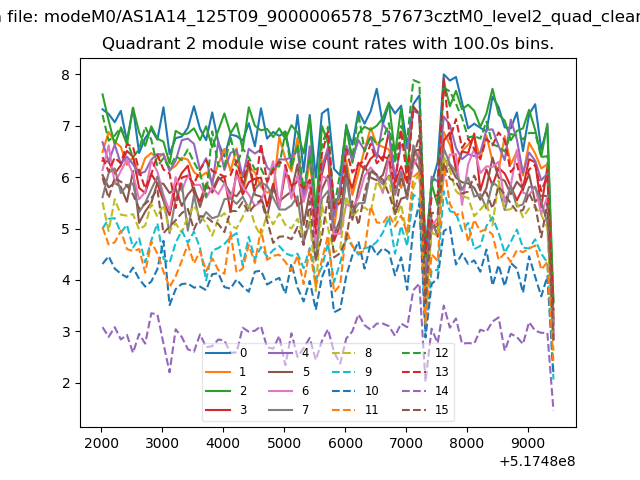
| Module-wise count rates for Quadrant B Data is divided into 100 sec bins |
 |
 |
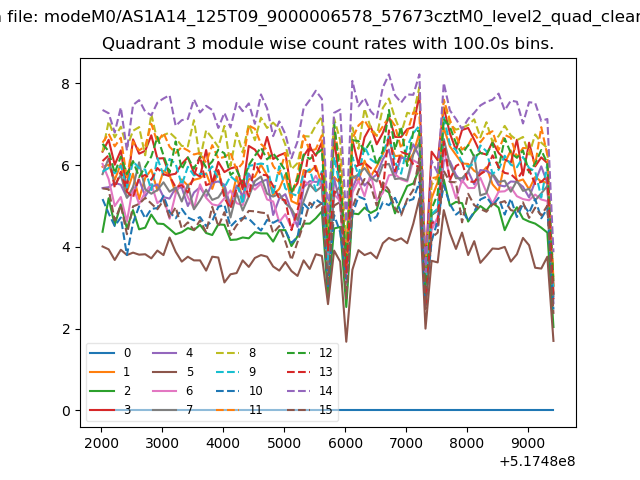
| Module-wise count rates for Quadrant C Data is divided into 100 sec bins |
 |
 |
| Module-wise count rates for Quadrant D Data is divided into 100 sec bins |
 |
 |
| Parameter | Plot |
|---|---|
| CZT HV Monitor |  |
| D_VDD | 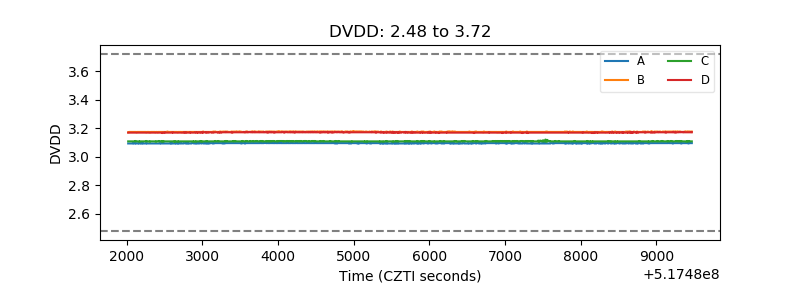 |
| Temperature 1 | 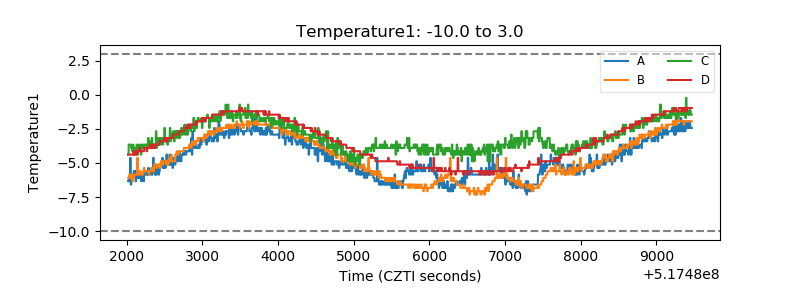 |
| Veto HV Monitor | 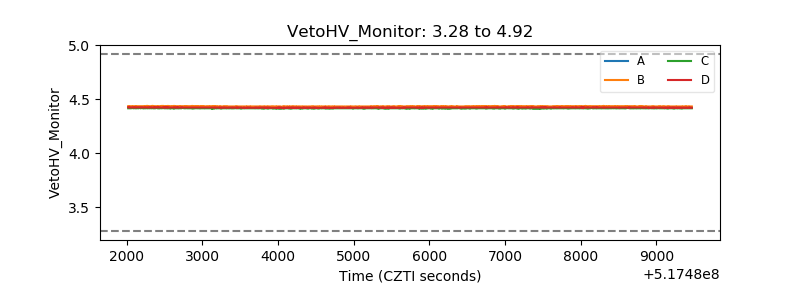 |
| Veto LLD | 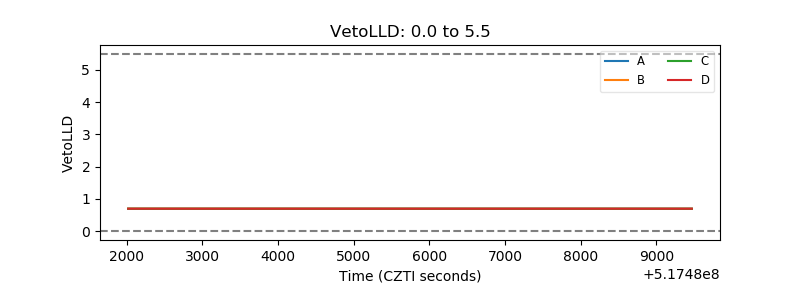 |
| Alpha Counter | 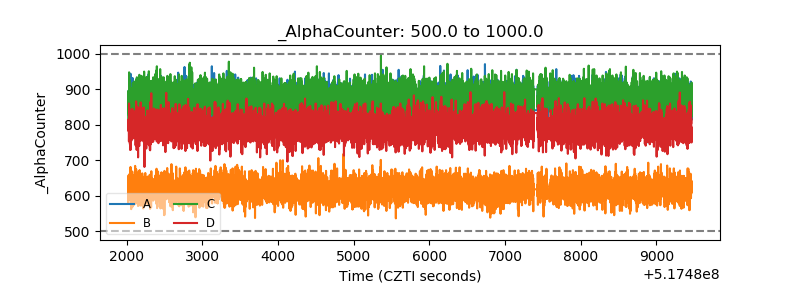 |
| _CPM_Rate | 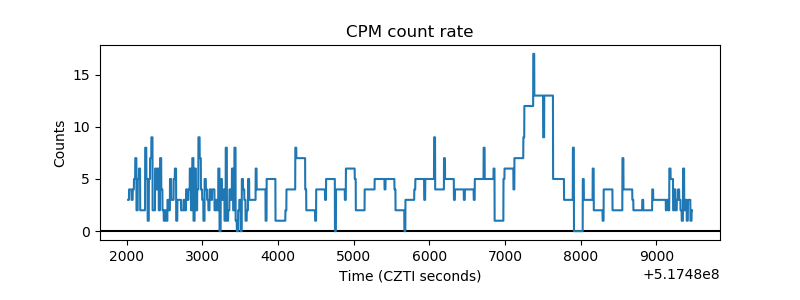 |
| CZT Counter | 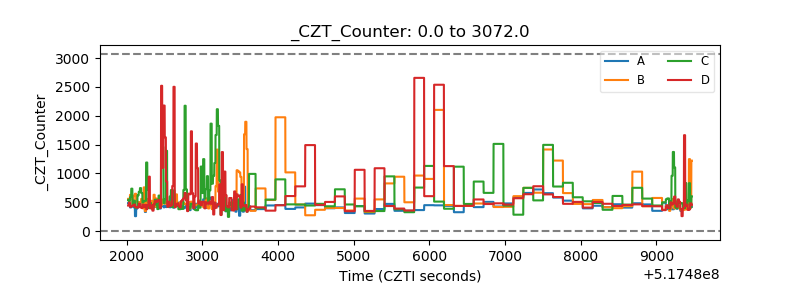 |
| +2.5 Volts monitor |  |
| +5 Volts monitor |  |
| _ROLL_ROT | 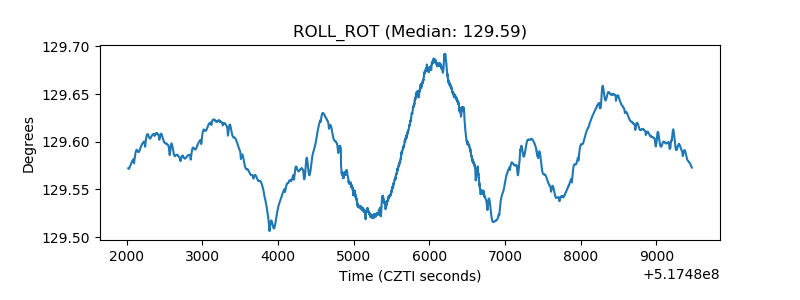 |
| _Roll_DEC | 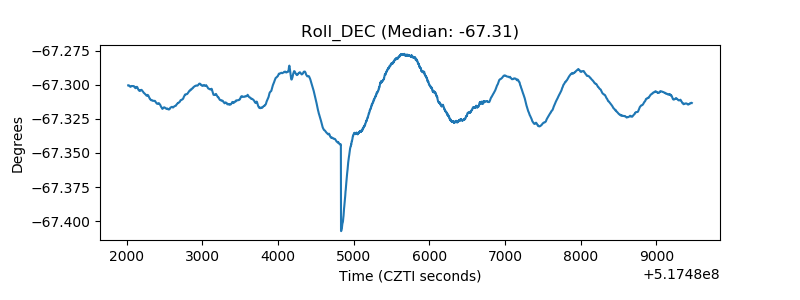 |
| _Roll_RA | 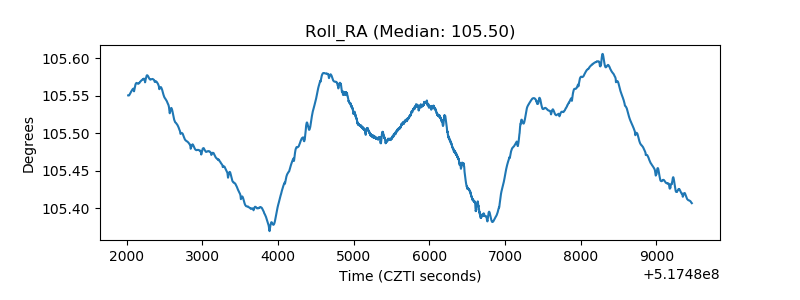 |
| Veto Counter | 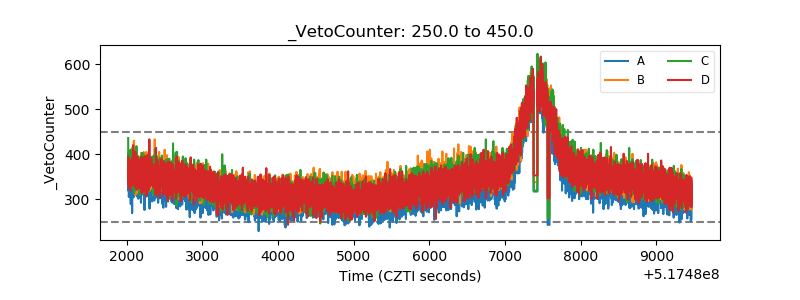 |