| Param | Original file | Final file |
|---|---|---|
| Filename | modeM0/AS1A14_125T09_9000006578_57674cztM0_level2.fits | modeM0/AS1A14_125T09_9000006578_57674cztM0_level2_quad_clean.evt |
| Size (bytes) | 455,855,040 | 110,442,240 |
| Size | 434.7 MB | 105.3 MB |
| Events in quadrant A | 3,315,350 | 727,141 |
| Events in quadrant B | 3,699,080 | 775,902 |
| Events in quadrant C | 5,467,782 | 658,935 |
| Events in quadrant D | 3,799,314 | 651,500 |
| Mode SS | |||
|---|---|---|---|
| Quadrant | BADHDUFLAG | Total packets | Discarded packets |
| A | 0 | 154 | 0 |
| B | 0 | 154 | 0 |
| C | 0 | 154 | 0 |
| D | 0 | 154 | 0 |
| Mode M0 | |||
|---|---|---|---|
| Quadrant | BADHDUFLAG | Total packets | Discarded packets |
| A | 0 | 15474 | 0 |
| B | 0 | 16431 | 0 |
| C | 0 | 21538 | 0 |
| D | 0 | 16563 | 0 |
| Quadrant | Total seconds | Saturated seconds | Saturation percentage |
|---|---|---|---|
| A | 7622 | 7 | 0.091839% |
| B | 7623 | 96 | 1.259347% |
| C | 7623 | 473 | 6.204906% |
| D | 7622 | 68 | 0.892154% |
Noise dominated data is calculated using 1-second bins in cleaned event files. If a bin has >2000 counts, and if more than 50% of those come from <1% of pixels, then it is considered to be noise-dominated and hence unusable.
| Quadrant | # 1 sec bins | Bins with >0 counts | Bins with >2000 counts | High rate bins dominated by noise | Noise dominated (total time) | Noise dominated (detector-on time) | Marked lightcurve |
|---|---|---|---|---|---|---|---|
| A | 7622 | 7622 | 3 | 3 | 0.04% | 0.04% | 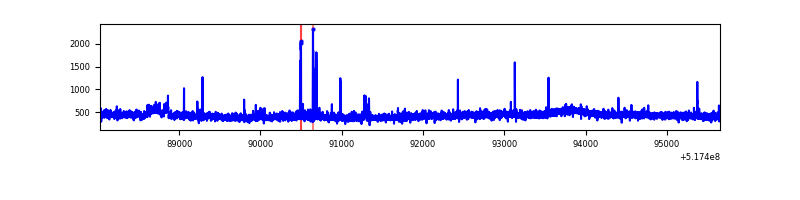 |
| B | 7623 | 7623 | 41 | 41 | 0.54% | 0.54% | 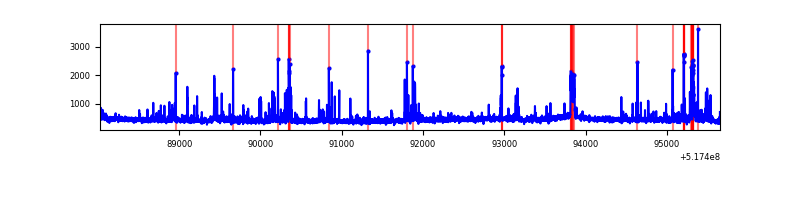 |
| C | 7623 | 7623 | 466 | 466 | 6.11% | 6.11% | 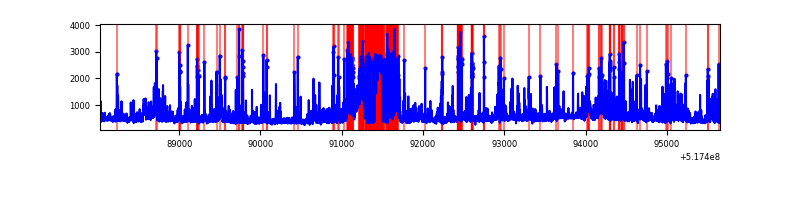 |
| D | 7622 | 7622 | 62 | 62 | 0.81% | 0.81% | 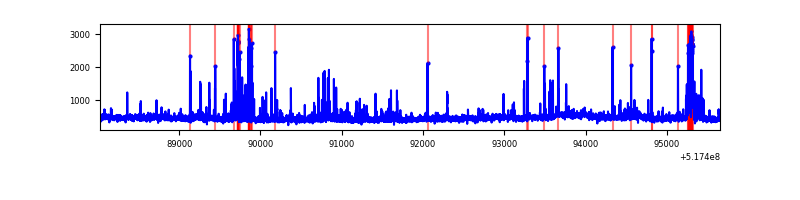 |
Top three noisy pixels from each quadrant. If the there are fewer than three noisy pixels in the level2.evt file, extra rows are filled as -1
| Pixel properties | Quadrant properties | ||||||
|---|---|---|---|---|---|---|---|
| Quadrant | DetID | PixID | Counts | Sigma | Mean | Median | Sigma |
| A | 3 | 14 | 62855 | 305.25 | 822 | 800 | 203.3 |
| A | 4 | 95 | 45139 | 218.1 | 822 | 800 | 203.3 |
| A | 10 | 251 | 17430 | 81.8 | 822 | 800 | 203.3 |
| B | 5 | 185 | 173089 | 979.74 | 809 | 776 | 175.9 |
| B | 0 | 213 | 156289 | 884.22 | 809 | 776 | 175.9 |
| B | 10 | 247 | 65216 | 366.39 | 809 | 776 | 175.9 |
| C | 12 | 2 | 1311700 | 6237.96 | 775 | 768 | 210.2 |
| C | 15 | 224 | 886484 | 4214.6 | 775 | 768 | 210.2 |
| C | 14 | 96 | 66563 | 313.08 | 775 | 768 | 210.2 |
| D | 2 | 120 | 152084 | 670.36 | 799 | 763 | 225.7 |
| D | 8 | 240 | 151251 | 666.67 | 799 | 763 | 225.7 |
| D | 2 | 31 | 76612 | 336.02 | 799 | 763 | 225.7 |
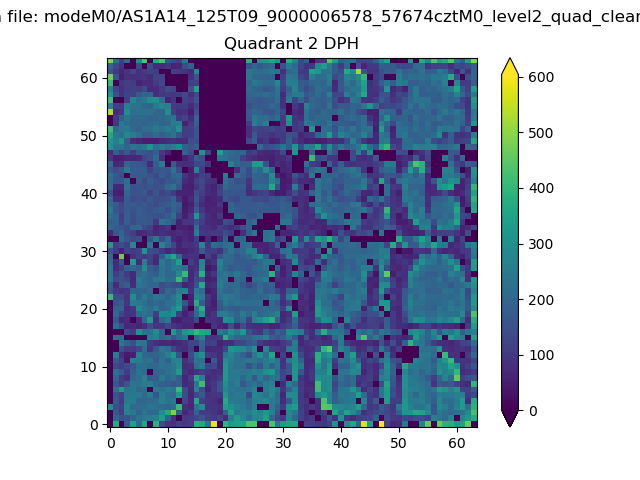
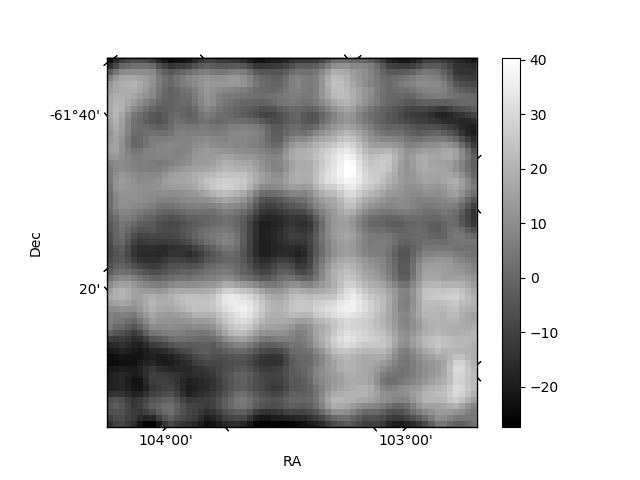
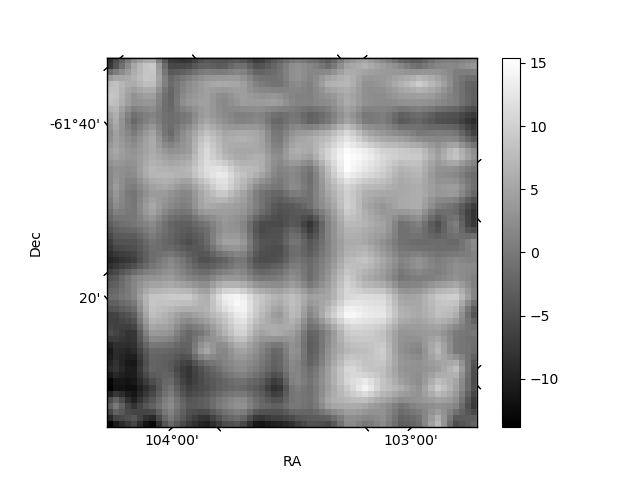
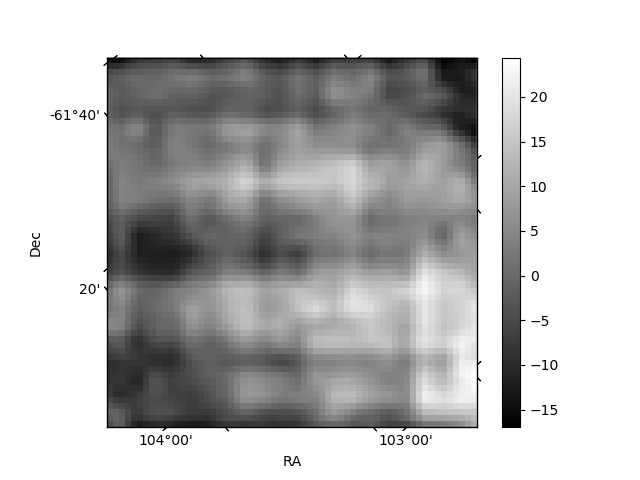
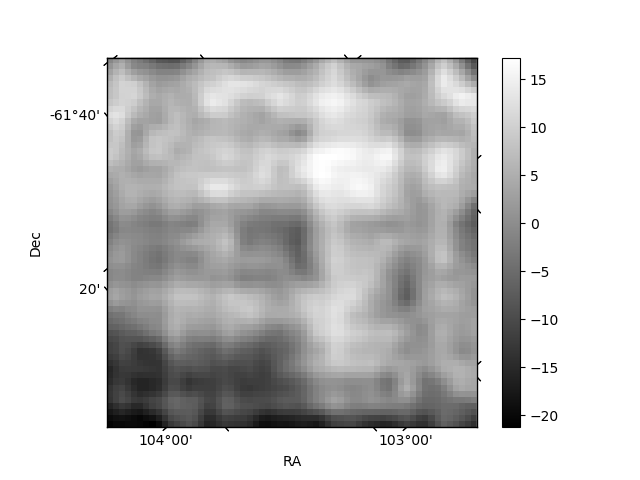
Histogram calculated using DETX and DETY for each event in the final _common_clean file
| Quadrant A | 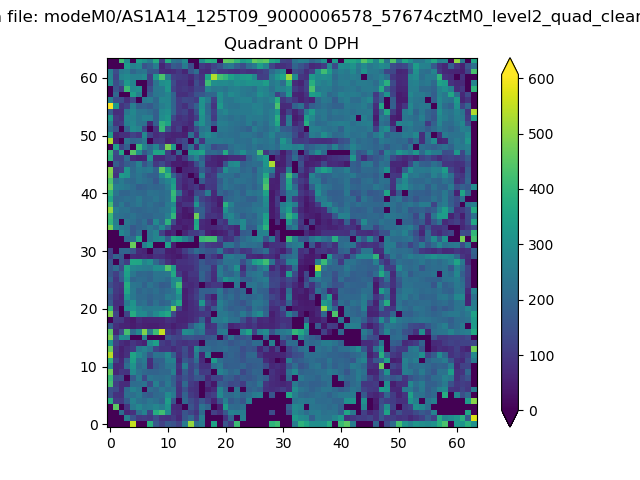 |
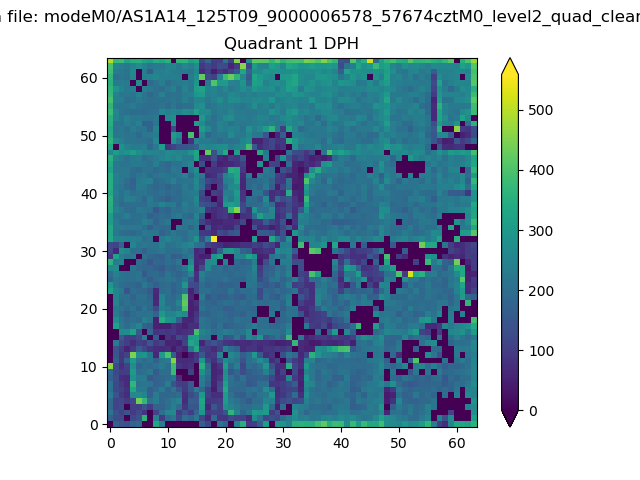 |
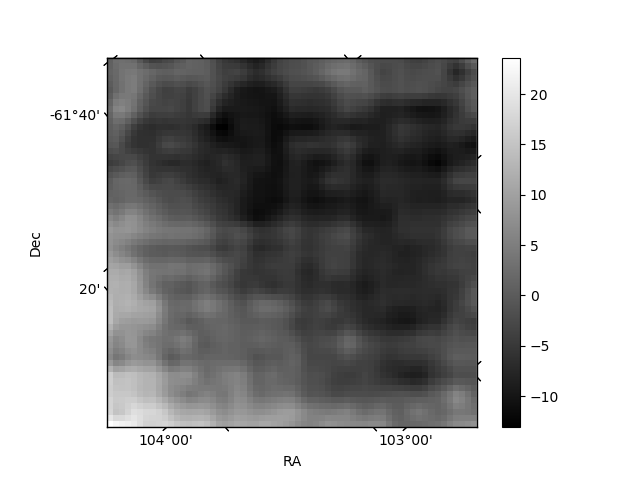
Quadrant B |
|---|---|---|---|
| Quadrant D | 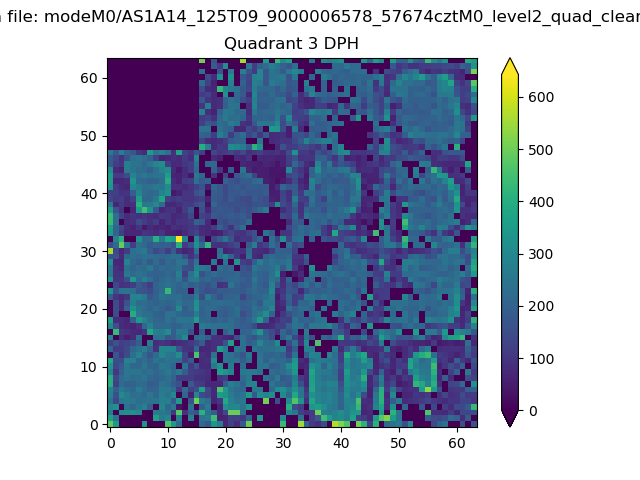 |
 |
Quadrant C |
| Plot type | Count rate plots | Images |
|---|---|---|
| Comparison with Poisson distribution Blue bars denote a histogram of data divided into 1 sec bins. Red curve is a Poisson curve with rate = median count rate of data. |
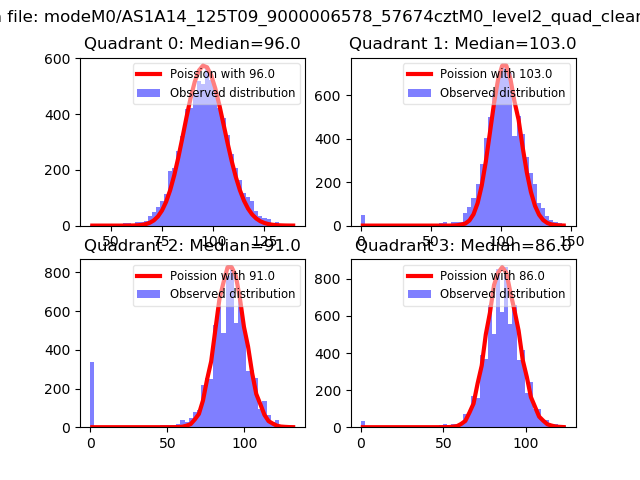 |
 |
| Quadrant-wise count rates Data is divided into 100 sec bins |
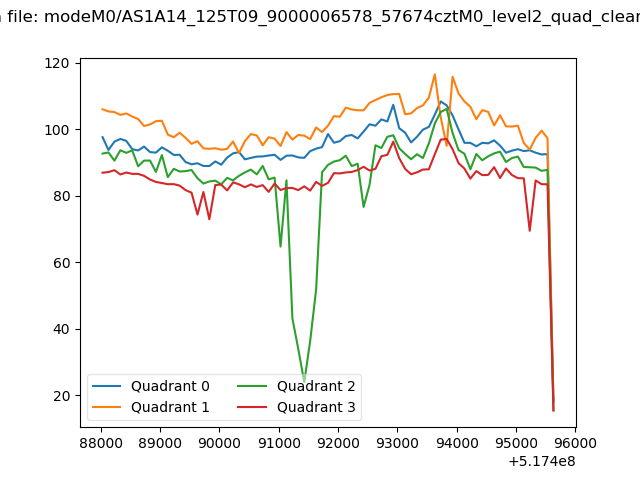 |
|
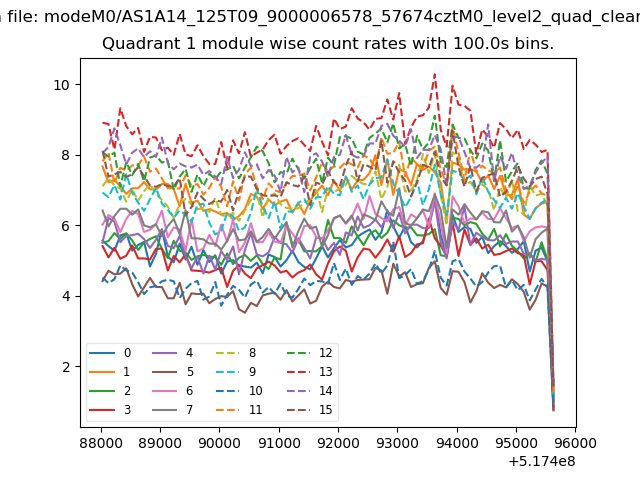
| Module-wise count rates for Quadrant A Data is divided into 100 sec bins |
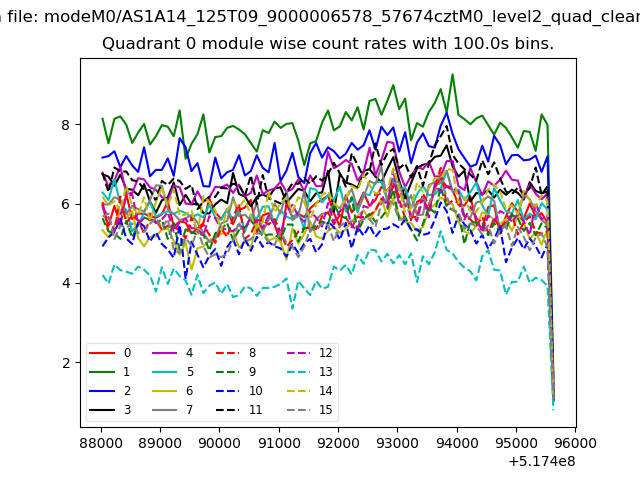 |
 |
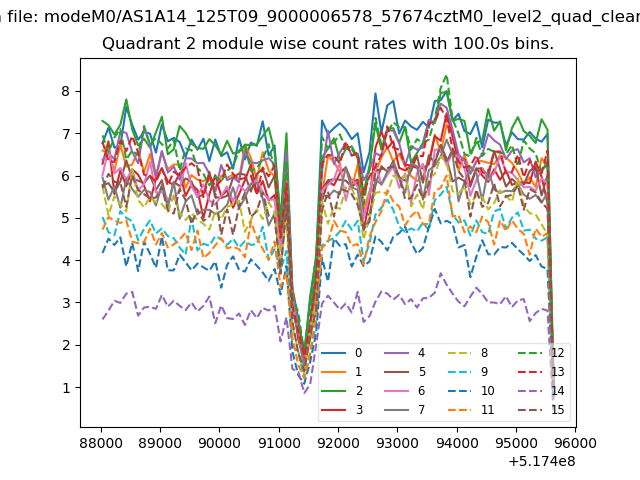
| Module-wise count rates for Quadrant B Data is divided into 100 sec bins |
 |
 |
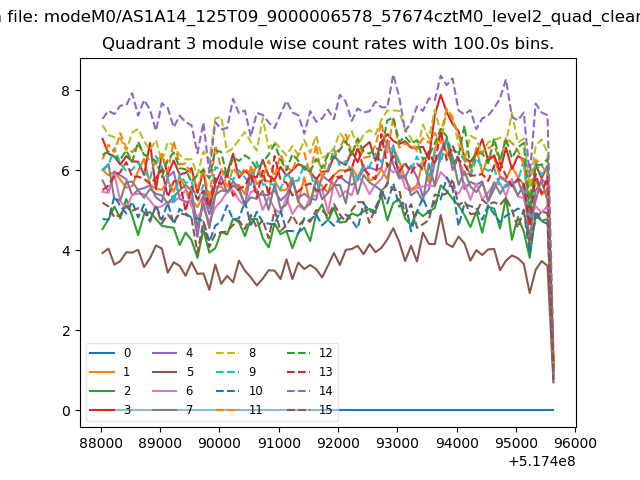
| Module-wise count rates for Quadrant C Data is divided into 100 sec bins |
 |
 |
| Module-wise count rates for Quadrant D Data is divided into 100 sec bins |
 |
 |
| Parameter | Plot |
|---|---|
| CZT HV Monitor | 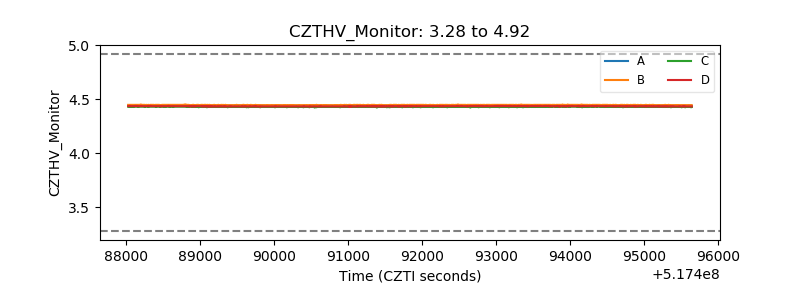 |
| D_VDD | 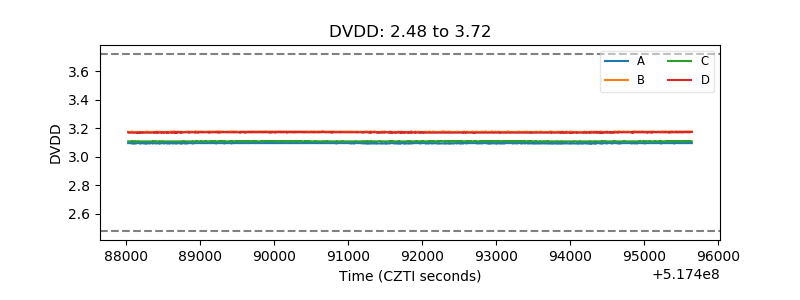 |
| Temperature 1 | 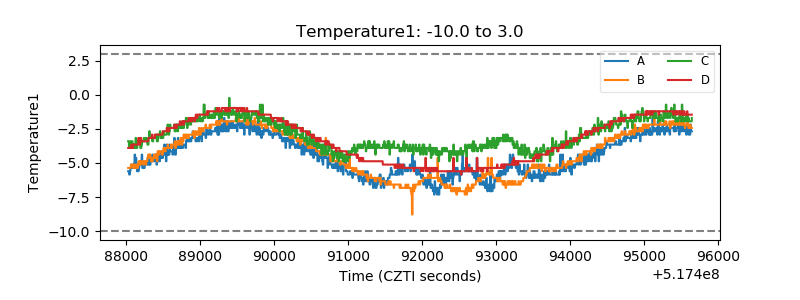 |
| Veto HV Monitor | 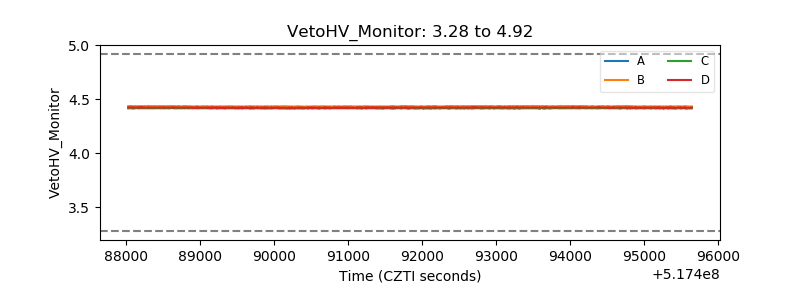 |
| Veto LLD | 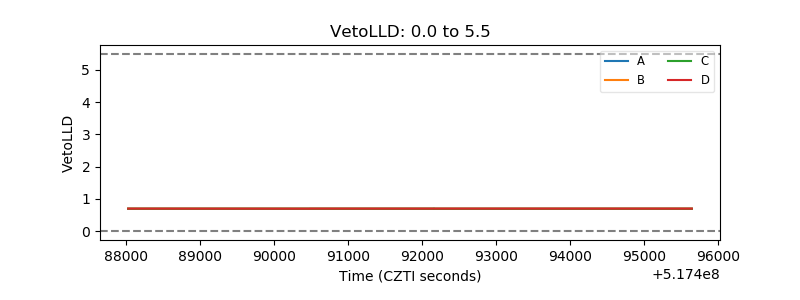 |
| Alpha Counter | 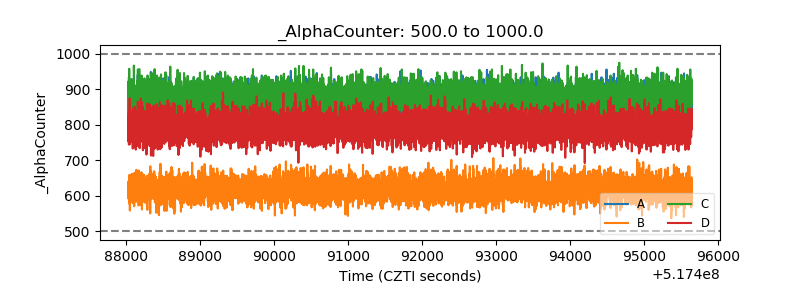 |
| _CPM_Rate | 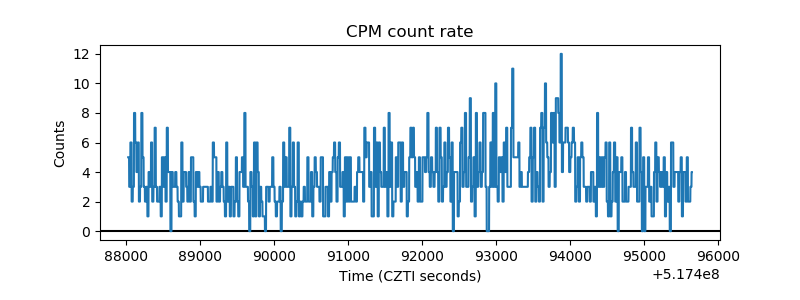 |
| CZT Counter | 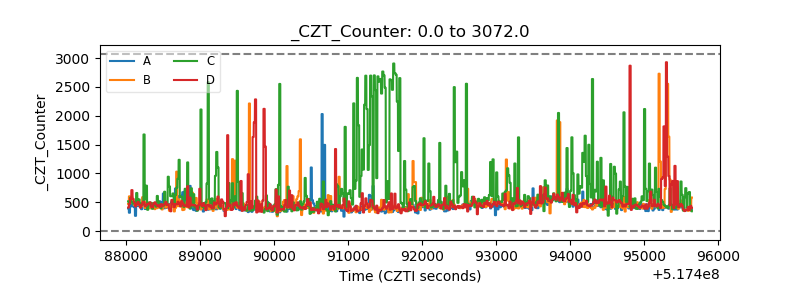 |
| +2.5 Volts monitor | 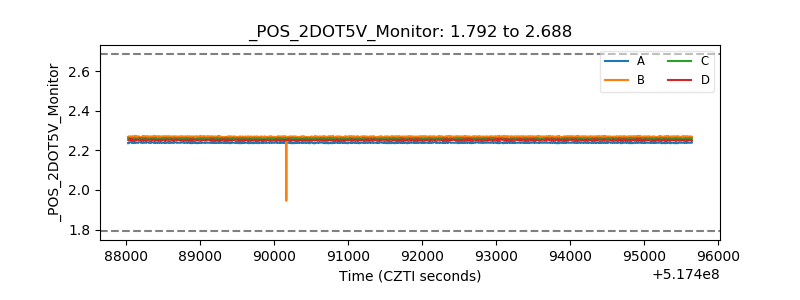 |
| +5 Volts monitor | 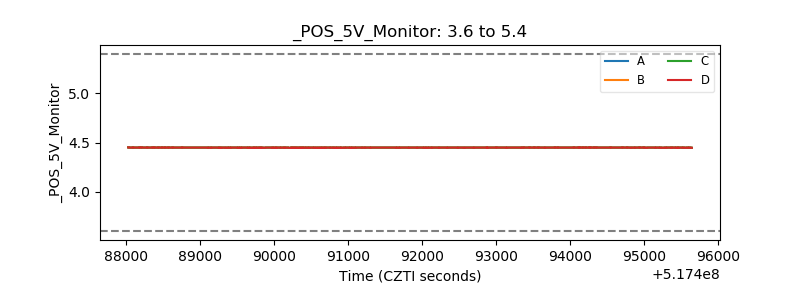 |
| _ROLL_ROT | 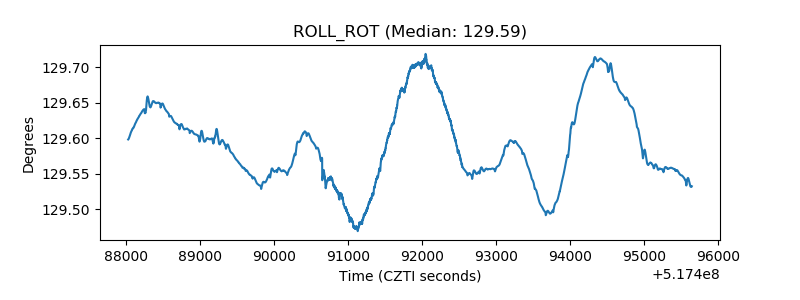 |
| _Roll_DEC | 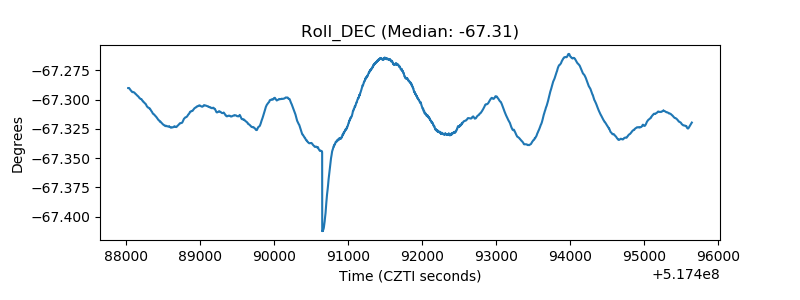 |
| _Roll_RA | 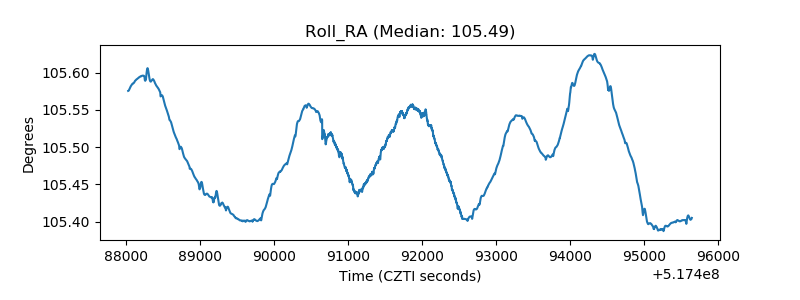 |
| Veto Counter | 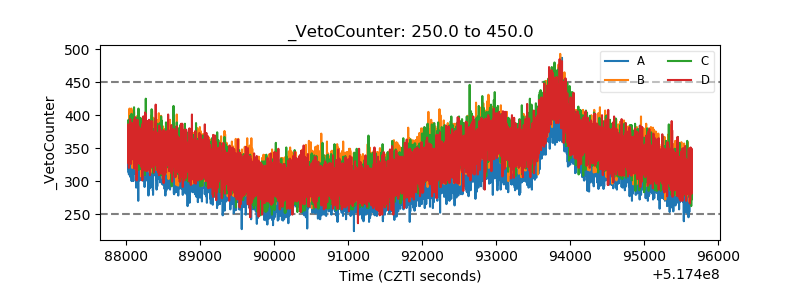 |