| Param | Original file | Final file |
|---|---|---|
| Filename | modeM0/AS1A14_125T09_9000006578_57675cztM0_level2.fits | modeM0/AS1A14_125T09_9000006578_57675cztM0_level2_quad_clean.evt |
| Size (bytes) | 448,214,400 | 111,522,240 |
| Size | 427.5 MB | 106.4 MB |
| Events in quadrant A | 3,253,154 | 727,745 |
| Events in quadrant B | 3,715,333 | 781,730 |
| Events in quadrant C | 5,026,510 | 681,036 |
| Events in quadrant D | 4,003,348 | 655,358 |
| Mode SS | |||
|---|---|---|---|
| Quadrant | BADHDUFLAG | Total packets | Discarded packets |
| A | 0 | 154 | 0 |
| B | 0 | 154 | 0 |
| C | 0 | 154 | 0 |
| D | 0 | 154 | 0 |
| Mode M0 | |||
|---|---|---|---|
| Quadrant | BADHDUFLAG | Total packets | Discarded packets |
| A | 0 | 15424 | 0 |
| B | 0 | 16430 | 1 |
| C | 0 | 20398 | 0 |
| D | 0 | 17223 | 0 |
| Quadrant | Total seconds | Saturated seconds | Saturation percentage |
|---|---|---|---|
| A | 7628 | 9 | 0.117986% |
| B | 7628 | 55 | 0.721028% |
| C | 7629 | 251 | 3.290077% |
| D | 7629 | 70 | 0.917551% |
Noise dominated data is calculated using 1-second bins in cleaned event files. If a bin has >2000 counts, and if more than 50% of those come from <1% of pixels, then it is considered to be noise-dominated and hence unusable.
| Quadrant | # 1 sec bins | Bins with >0 counts | Bins with >2000 counts | High rate bins dominated by noise | Noise dominated (total time) | Noise dominated (detector-on time) | Marked lightcurve |
|---|---|---|---|---|---|---|---|
| A | 7628 | 7628 | 3 | 3 | 0.04% | 0.04% | 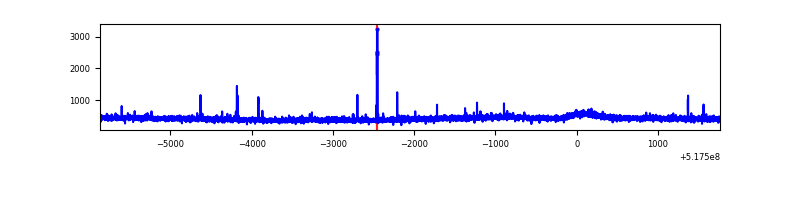 |
| B | 7629 | 7629 | 36 | 36 | 0.47% | 0.47% | 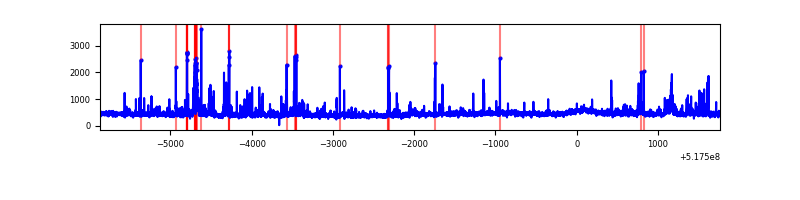 |
| C | 7629 | 7629 | 232 | 232 | 3.04% | 3.04% | 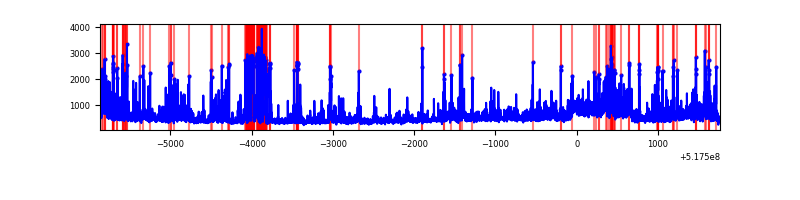 |
| D | 7629 | 7629 | 62 | 62 | 0.81% | 0.81% | 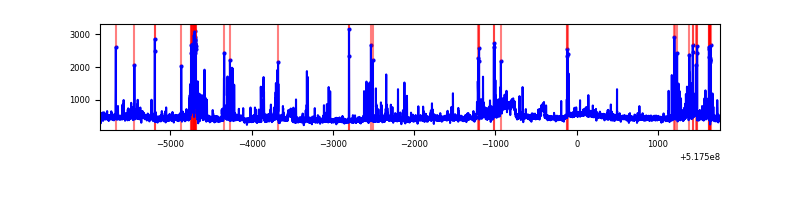 |
Top three noisy pixels from each quadrant. If the there are fewer than three noisy pixels in the level2.evt file, extra rows are filled as -1
| Pixel properties | Quadrant properties | ||||||
|---|---|---|---|---|---|---|---|
| Quadrant | DetID | PixID | Counts | Sigma | Mean | Median | Sigma |
| A | 10 | 251 | 26091 | 123.78 | 828 | 806 | 204.3 |
| A | 4 | 3 | 11366 | 51.7 | 828 | 806 | 204.3 |
| A | 4 | 13 | 10970 | 49.76 | 828 | 806 | 204.3 |
| B | 5 | 185 | 241305 | 1390.46 | 813 | 783 | 173.0 |
| B | 10 | 247 | 83034 | 475.49 | 813 | 783 | 173.0 |
| B | 0 | 213 | 69322 | 396.22 | 813 | 783 | 173.0 |
| C | 15 | 224 | 847099 | 3932.34 | 792 | 785 | 215.2 |
| C | 12 | 254 | 405363 | 1879.84 | 792 | 785 | 215.2 |
| C | 12 | 252 | 288909 | 1338.75 | 792 | 785 | 215.2 |
| D | 8 | 240 | 218832 | 957.96 | 803 | 769 | 227.6 |
| D | 5 | 38 | 146126 | 638.56 | 803 | 769 | 227.6 |
| D | 2 | 120 | 118124 | 515.54 | 803 | 769 | 227.6 |
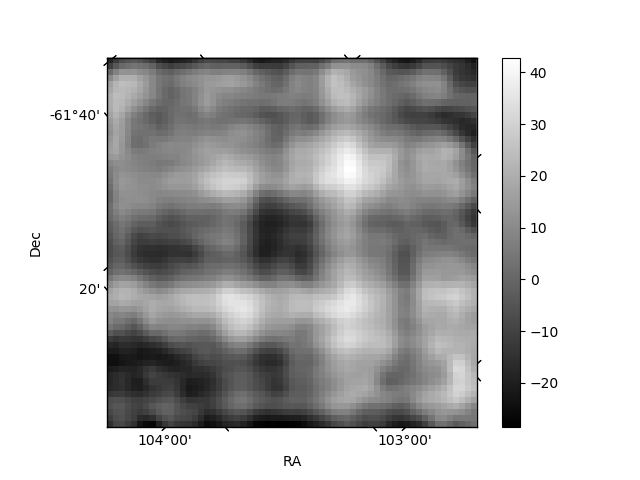
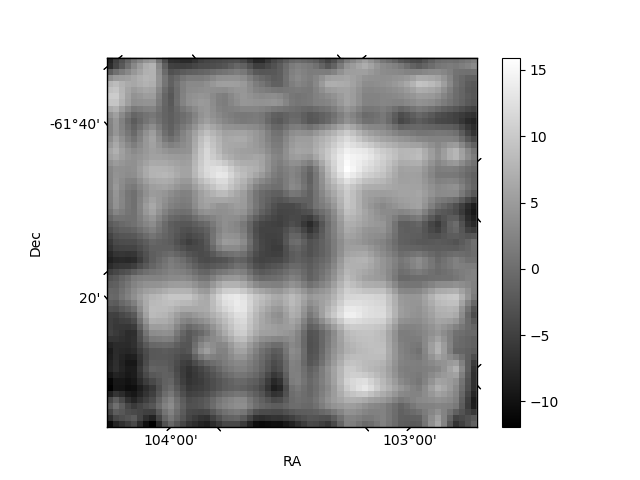
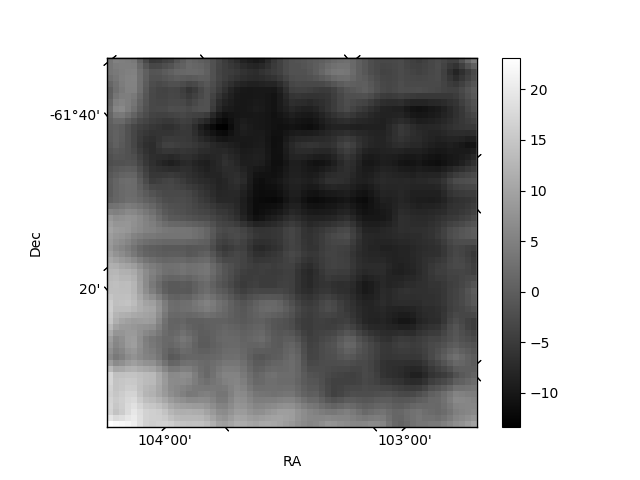
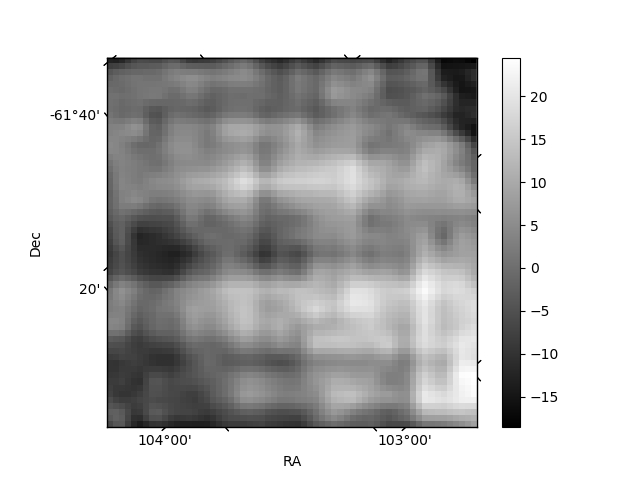
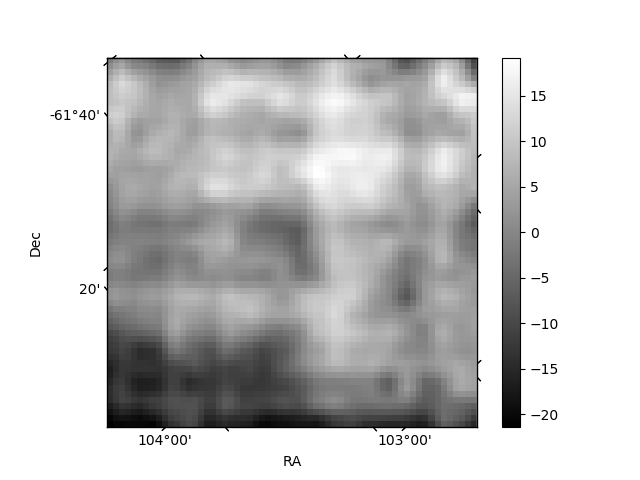
Histogram calculated using DETX and DETY for each event in the final _common_clean file
| Quadrant A | 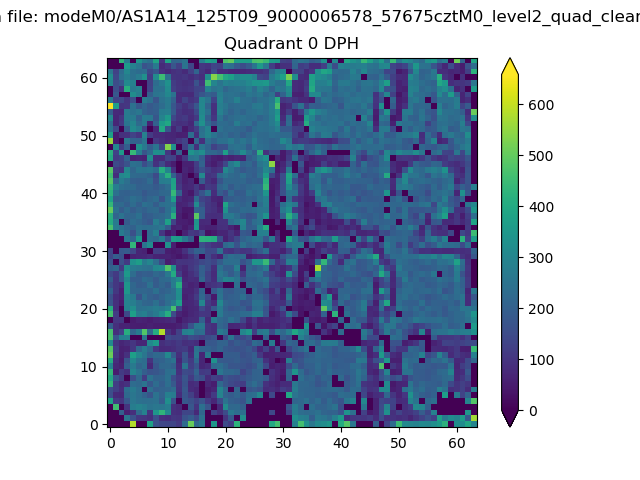 |
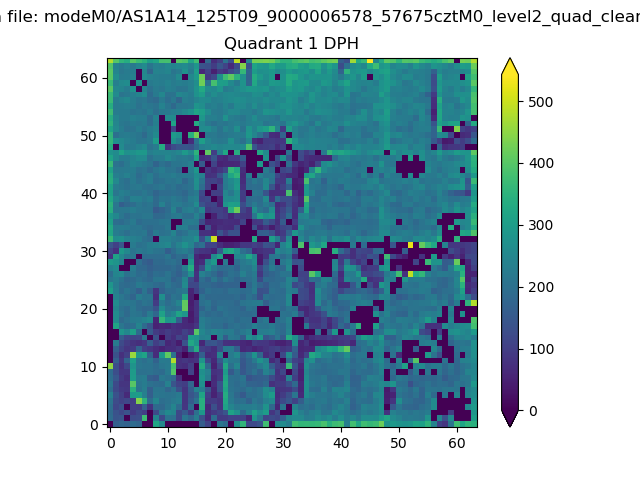 |
Quadrant B |
|---|---|---|---|
| Quadrant D | 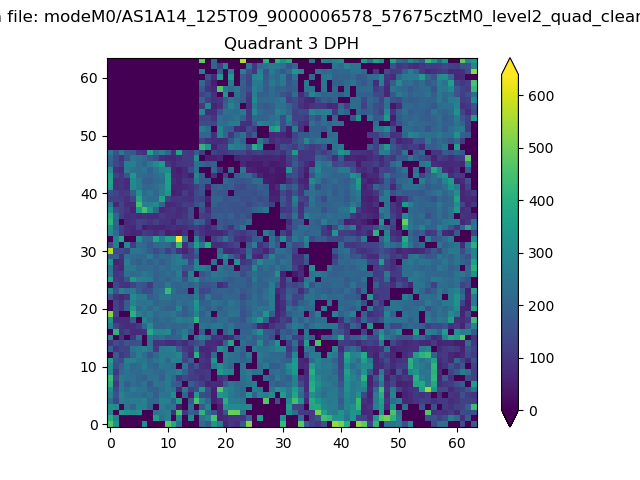 |
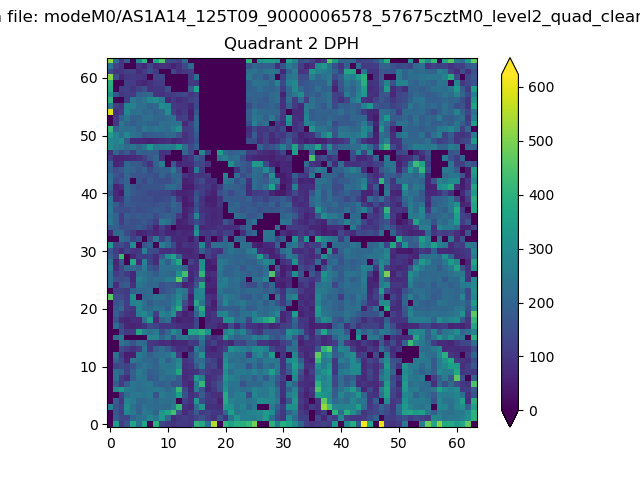 |
Quadrant C |
| Plot type | Count rate plots | Images |
|---|---|---|
| Comparison with Poisson distribution Blue bars denote a histogram of data divided into 1 sec bins. Red curve is a Poisson curve with rate = median count rate of data. |
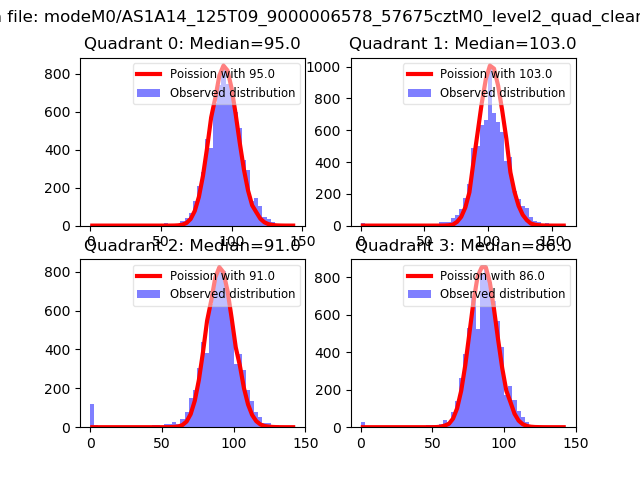 |
 |
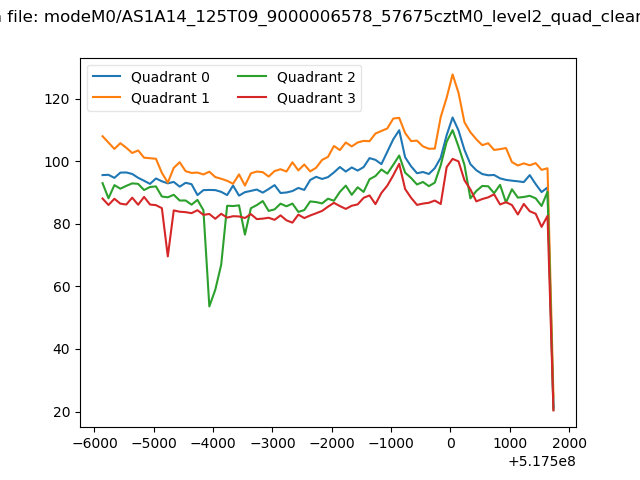
| Quadrant-wise count rates Data is divided into 100 sec bins |
 |
|
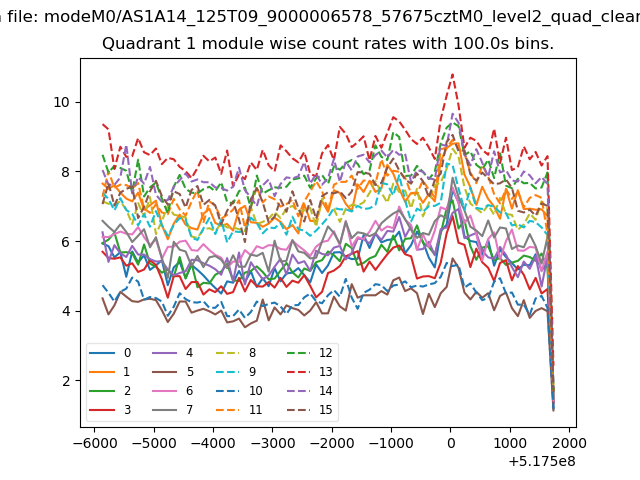
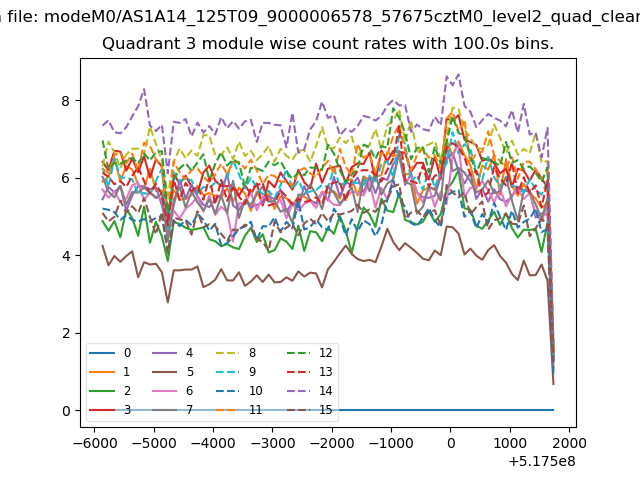
| Module-wise count rates for Quadrant A Data is divided into 100 sec bins |
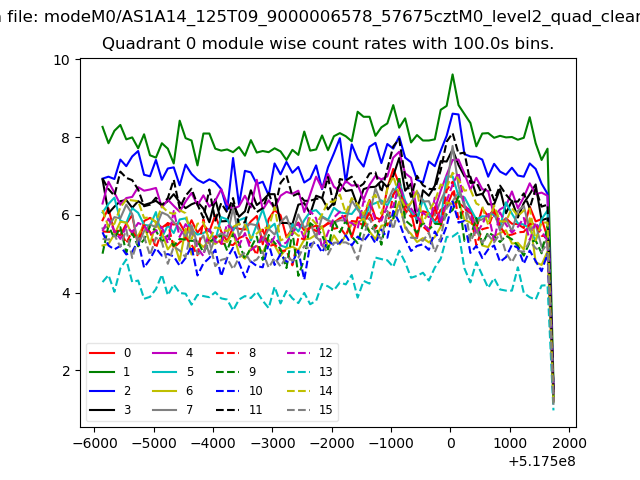 |
 |
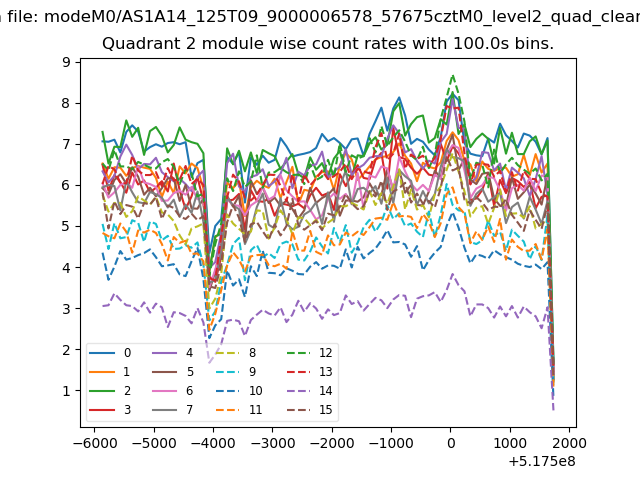
| Module-wise count rates for Quadrant B Data is divided into 100 sec bins |
 |
 |
| Module-wise count rates for Quadrant C Data is divided into 100 sec bins |
 |
 |
| Module-wise count rates for Quadrant D Data is divided into 100 sec bins |
 |
 |
| Parameter | Plot |
|---|---|
| CZT HV Monitor | 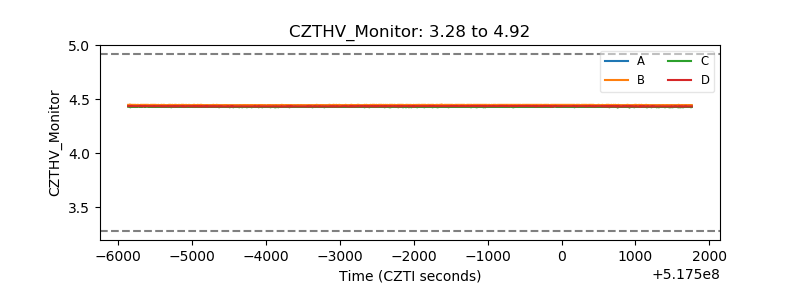 |
| D_VDD | 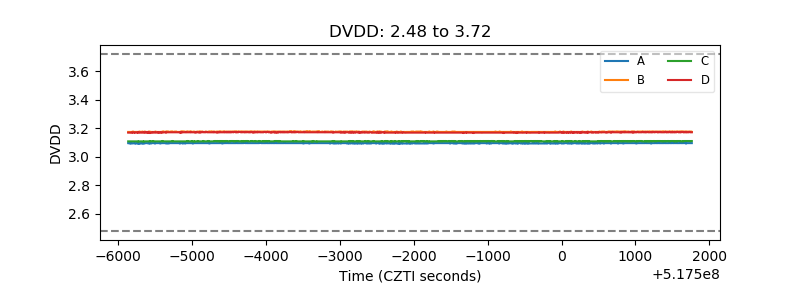 |
| Temperature 1 | 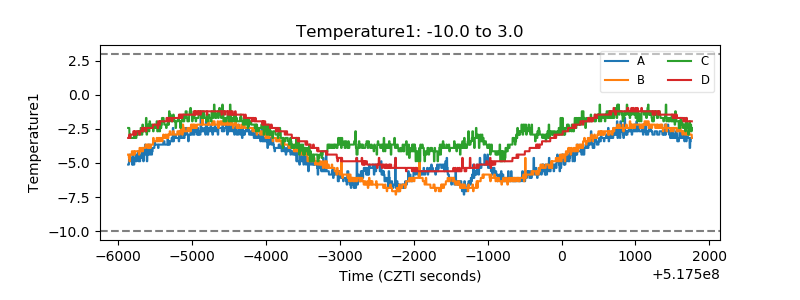 |
| Veto HV Monitor |  |
| Veto LLD | 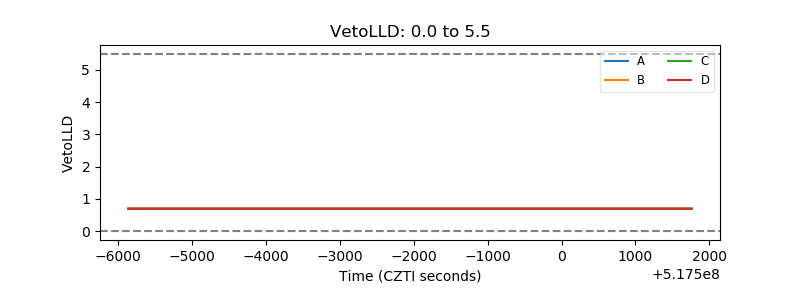 |
| Alpha Counter | 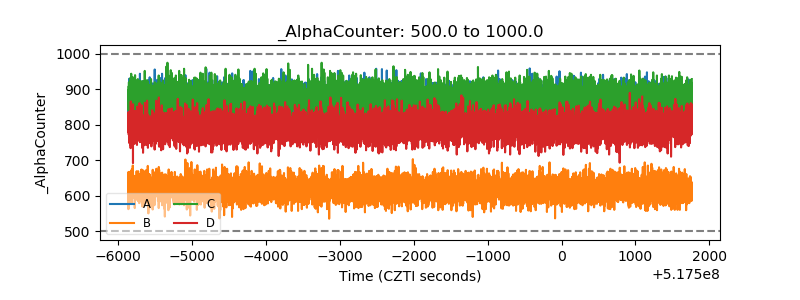 |
| _CPM_Rate | 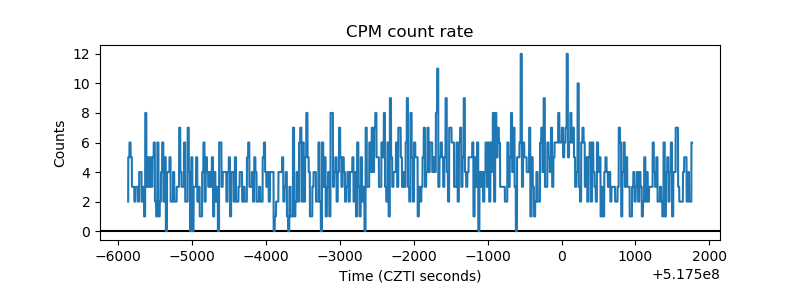 |
| CZT Counter | 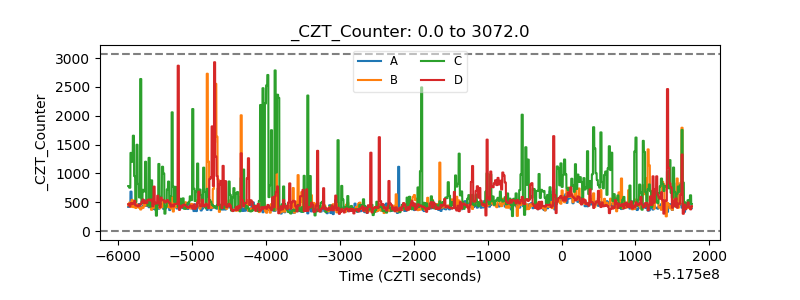 |
| +2.5 Volts monitor |  |
| +5 Volts monitor | 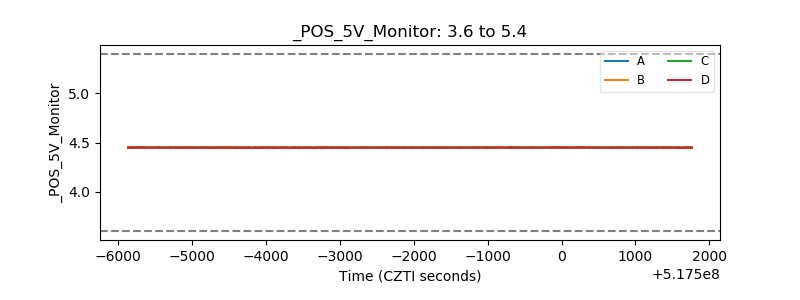 |
| _ROLL_ROT | 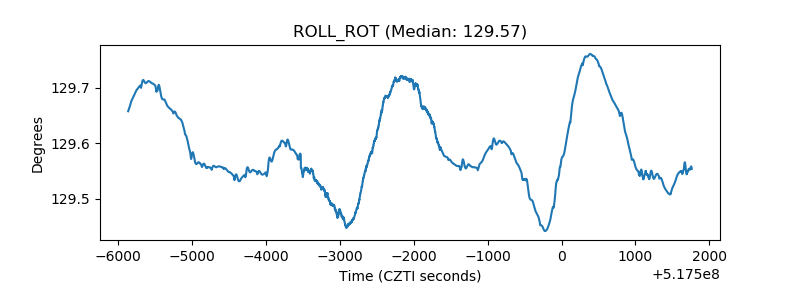 |
| _Roll_DEC | 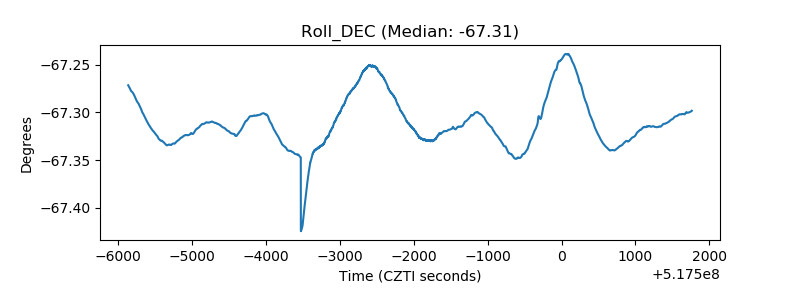 |
| _Roll_RA | 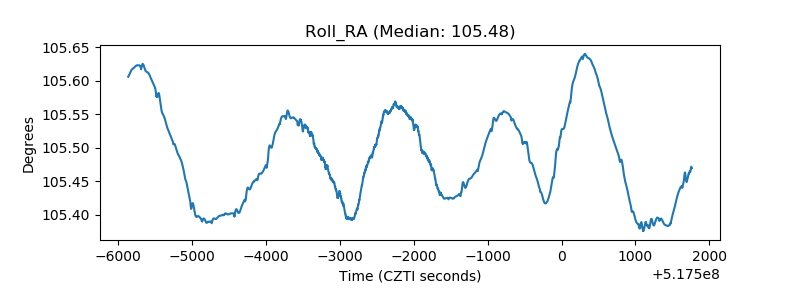 |
| Veto Counter | 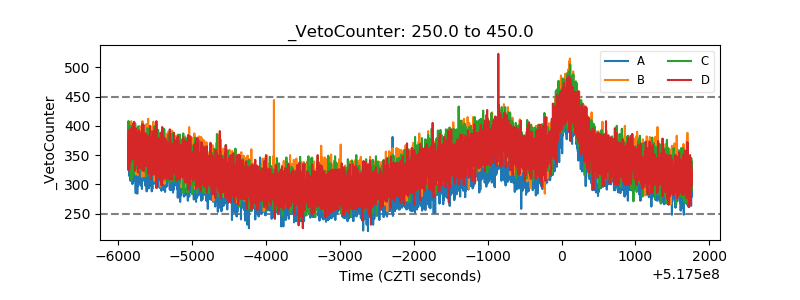 |