| Param | Original file | Final file |
|---|---|---|
| Filename | modeM0/AS1A14_125T09_9000006578_57678cztM0_level2.fits | modeM0/AS1A14_125T09_9000006578_57678cztM0_level2_quad_clean.evt |
| Size (bytes) | 1,237,818,240 | 266,218,560 |
| Size | 1.2 GB | 253.9 MB |
| Events in quadrant A | 8,014,772 | 1,780,115 |
| Events in quadrant B | 10,181,433 | 1,867,606 |
| Events in quadrant C | 16,470,900 | 1,532,722 |
| Events in quadrant D | 9,693,483 | 1,580,508 |
| Mode M9 | |||
|---|---|---|---|
| Quadrant | BADHDUFLAG | Total packets | Discarded packets |
| A | 0 | 13 | 0 |
| B | 0 | 13 | 0 |
| C | 0 | 13 | 0 |
| D | 0 | 13 | 0 |
| Mode SS | |||
|---|---|---|---|
| Quadrant | BADHDUFLAG | Total packets | Discarded packets |
| A | 0 | 384 | 0 |
| B | 0 | 384 | 0 |
| C | 0 | 384 | 0 |
| D | 0 | 384 | 0 |
| Mode M0 | |||
|---|---|---|---|
| Quadrant | BADHDUFLAG | Total packets | Discarded packets |
| A | 0 | 38323 | 3 |
| B | 0 | 43760 | 4 |
| C | 0 | 62090 | 3 |
| D | 0 | 42372 | 3 |
| Quadrant | Total seconds | Saturated seconds | Saturation percentage |
|---|---|---|---|
| A | 18853 | 104 | 0.551636% |
| B | 18853 | 547 | 2.901395% |
| C | 18853 | 1614 | 8.560972% |
| D | 18853 | 210 | 1.113881% |
Noise dominated data is calculated using 1-second bins in cleaned event files. If a bin has >2000 counts, and if more than 50% of those come from <1% of pixels, then it is considered to be noise-dominated and hence unusable.
| Quadrant | # 1 sec bins | Bins with >0 counts | Bins with >2000 counts | High rate bins dominated by noise | Noise dominated (total time) | Noise dominated (detector-on time) | Marked lightcurve |
|---|---|---|---|---|---|---|---|
| A | 20213 | 18855 | 10 | 10 | 0.05% | 0.05% | 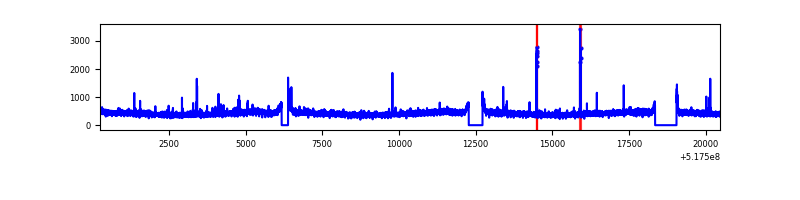 |
| B | 20213 | 18855 | 184 | 184 | 0.91% | 0.98% | 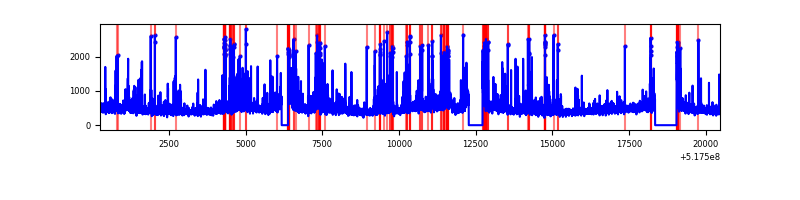 |
| C | 20213 | 18854 | 1457 | 1457 | 7.21% | 7.73% | 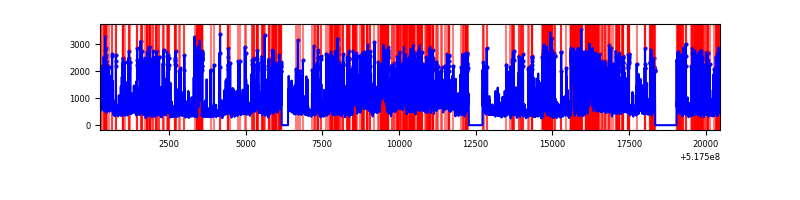 |
| D | 20213 | 18854 | 190 | 190 | 0.94% | 1.01% | 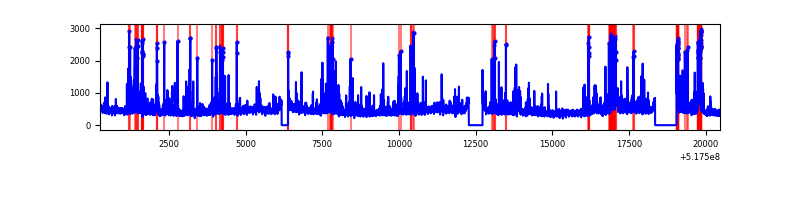 |
Top three noisy pixels from each quadrant. If the there are fewer than three noisy pixels in the level2.evt file, extra rows are filled as -1
| Pixel properties | Quadrant properties | ||||||
|---|---|---|---|---|---|---|---|
| Quadrant | DetID | PixID | Counts | Sigma | Mean | Median | Sigma |
| A | 3 | 245 | 35991 | 67.47 | 2041 | 1988 | 504.0 |
| A | 10 | 251 | 30349 | 56.27 | 2041 | 1988 | 504.0 |
| A | 3 | 137 | 25412 | 46.48 | 2041 | 1988 | 504.0 |
| B | 5 | 185 | 988654 | 2308.24 | 1993 | 1915 | 427.5 |
| B | 10 | 16 | 402782 | 937.73 | 1993 | 1915 | 427.5 |
| B | 4 | 80 | 393355 | 915.68 | 1993 | 1915 | 427.5 |
| C | 15 | 224 | 3825659 | 7459.94 | 1901 | 1880 | 512.6 |
| C | 12 | 254 | 1908641 | 3719.96 | 1901 | 1880 | 512.6 |
| C | 12 | 252 | 1740488 | 3391.91 | 1901 | 1880 | 512.6 |
| D | 8 | 240 | 566734 | 1026.45 | 1961 | 1874 | 550.3 |
| D | 3 | 12 | 353635 | 639.21 | 1961 | 1874 | 550.3 |
| D | 2 | 120 | 311346 | 562.37 | 1961 | 1874 | 550.3 |
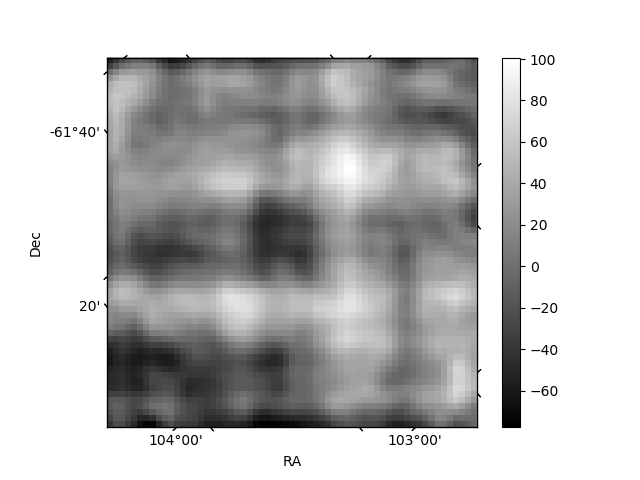
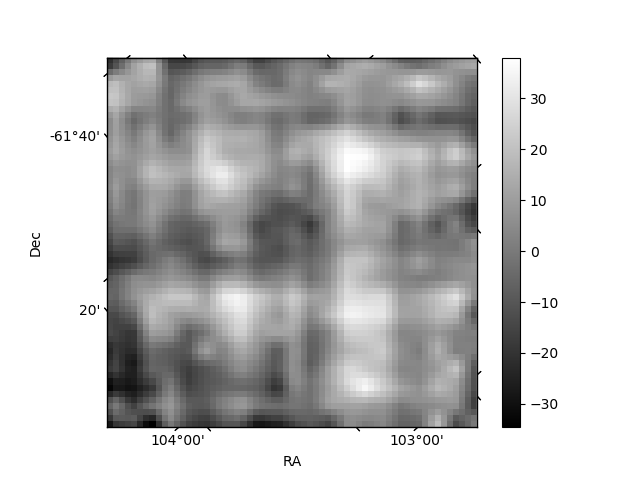
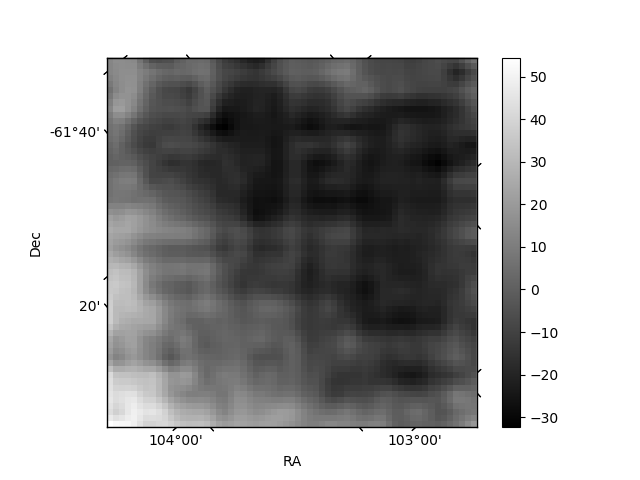
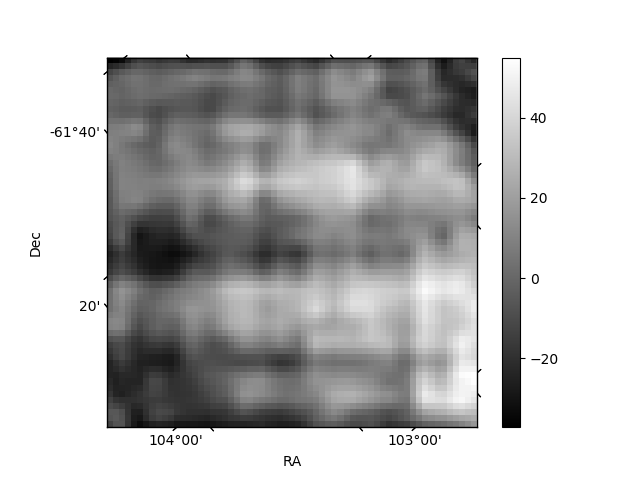
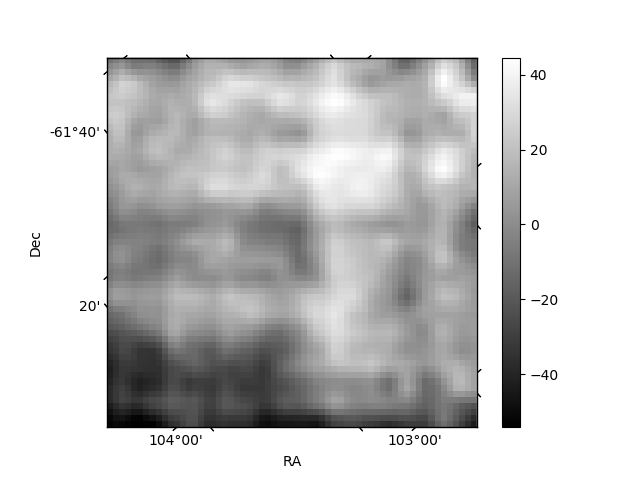
Histogram calculated using DETX and DETY for each event in the final _common_clean file
| Quadrant A | 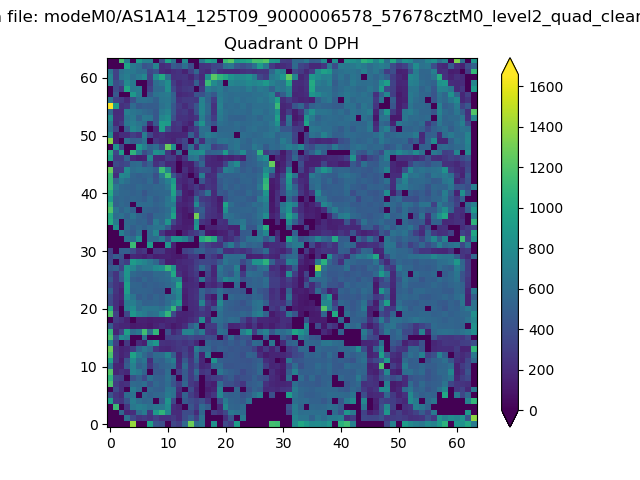 |
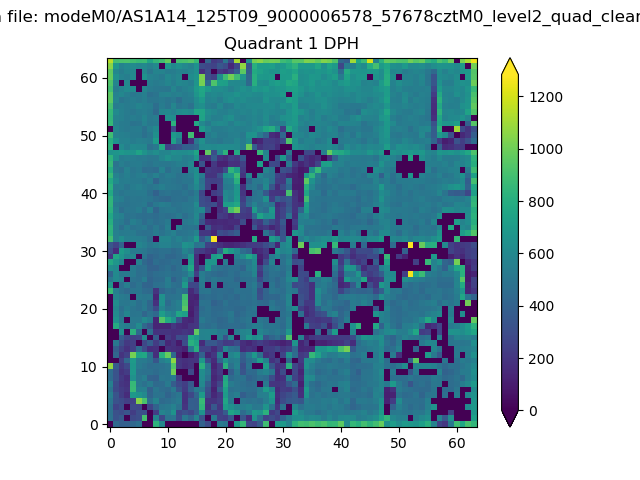 |
Quadrant B |
|---|---|---|---|
| Quadrant D | 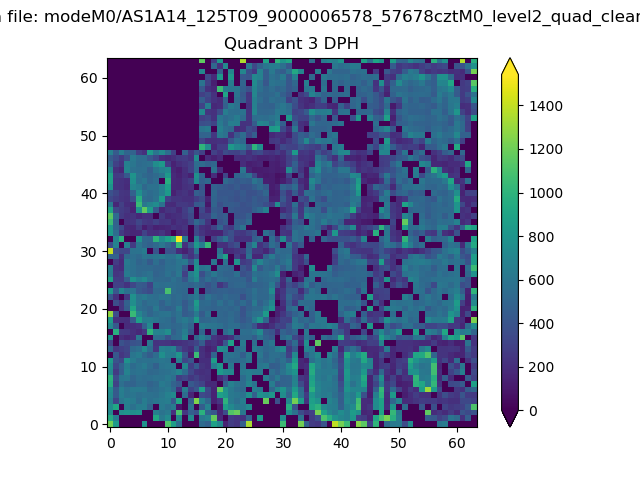 |
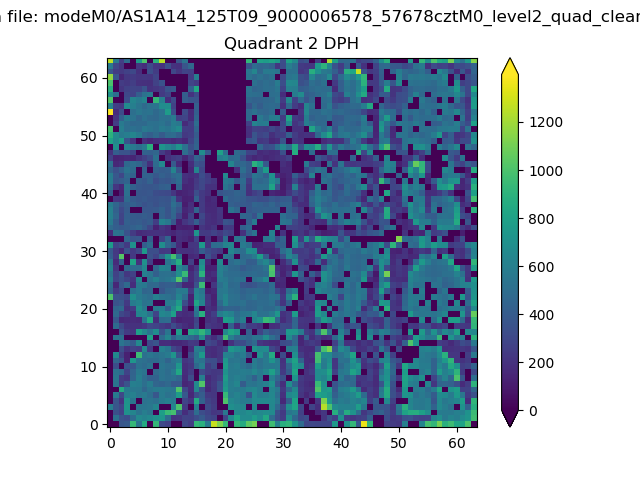 |
Quadrant C |
| Plot type | Count rate plots | Images |
|---|---|---|
| Comparison with Poisson distribution Blue bars denote a histogram of data divided into 1 sec bins. Red curve is a Poisson curve with rate = median count rate of data. |
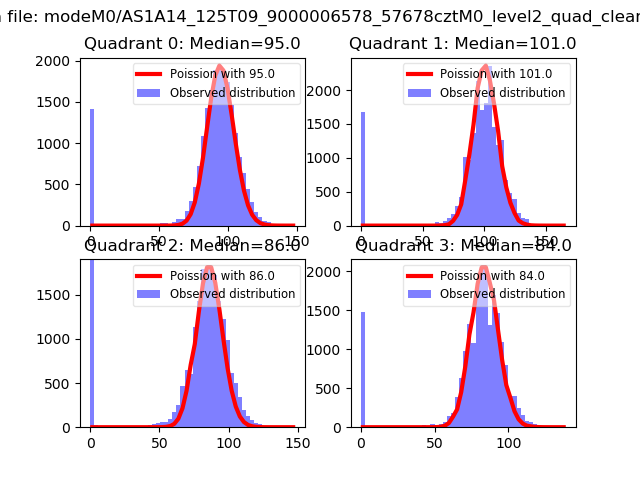 |
 |
| Quadrant-wise count rates Data is divided into 100 sec bins |
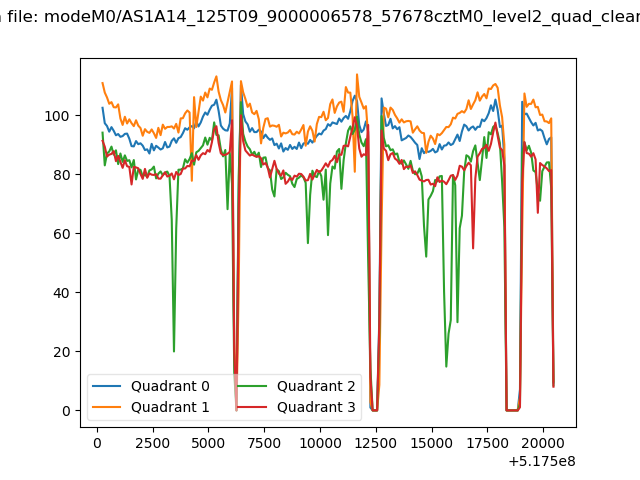 |
|
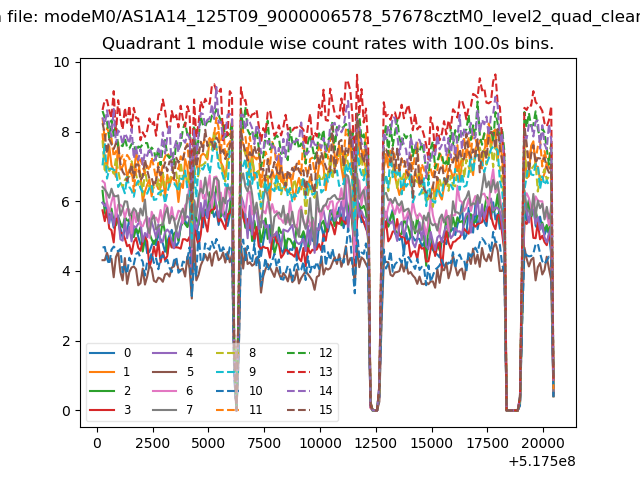
| Module-wise count rates for Quadrant A Data is divided into 100 sec bins |
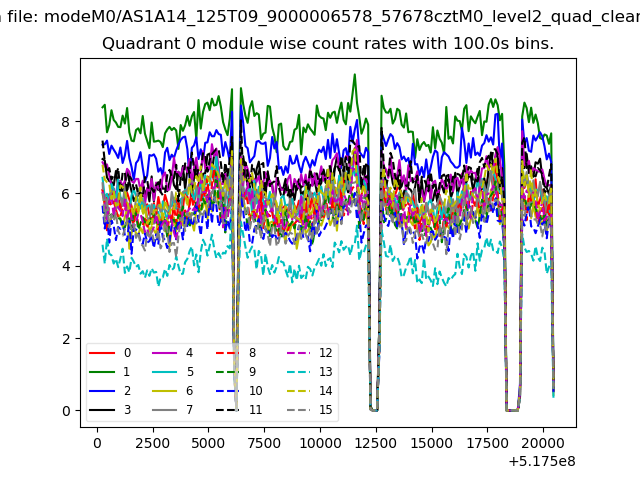 |
 |
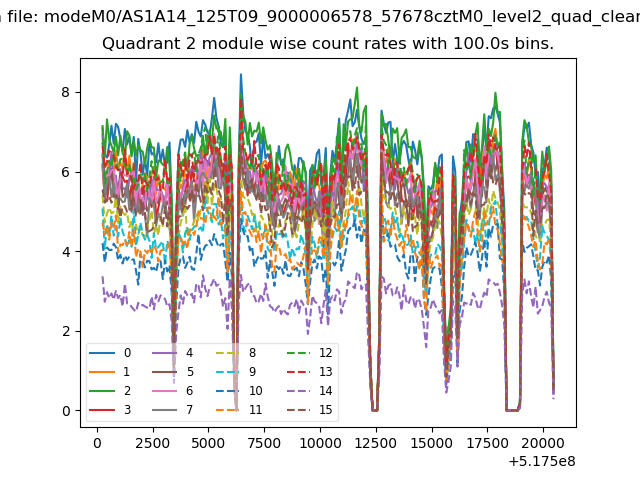
| Module-wise count rates for Quadrant B Data is divided into 100 sec bins |
 |
 |
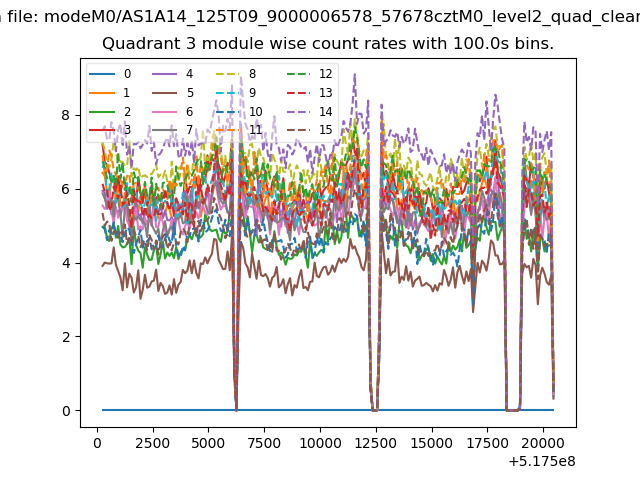
| Module-wise count rates for Quadrant C Data is divided into 100 sec bins |
 |
 |
| Module-wise count rates for Quadrant D Data is divided into 100 sec bins |
 |
 |
| Parameter | Plot |
|---|---|
| CZT HV Monitor | 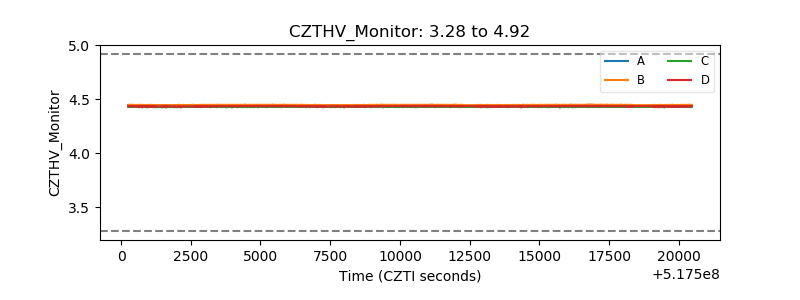 |
| D_VDD | 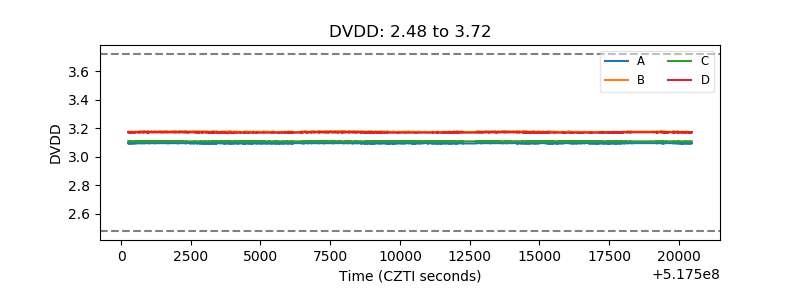 |
| Temperature 1 | 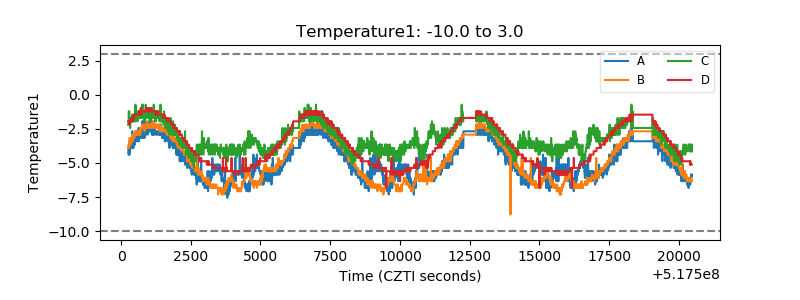 |
| Veto HV Monitor | 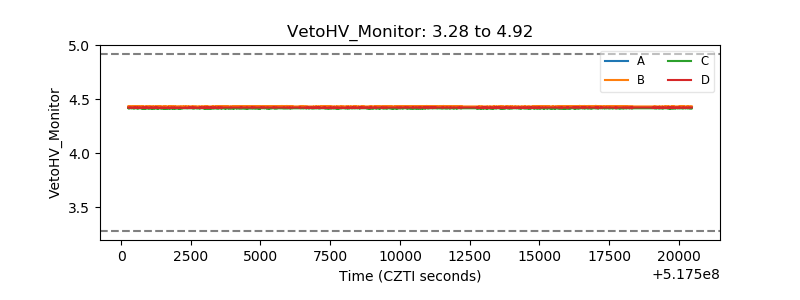 |
| Veto LLD | 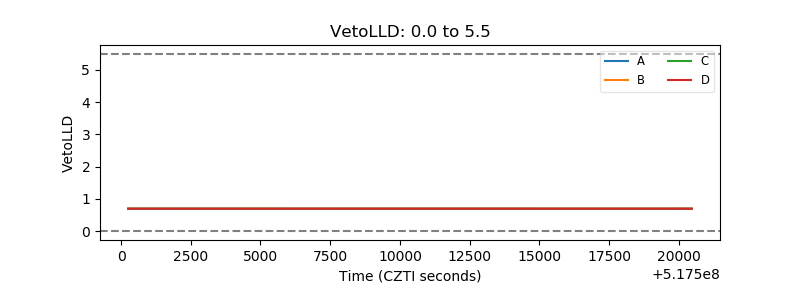 |
| Alpha Counter | 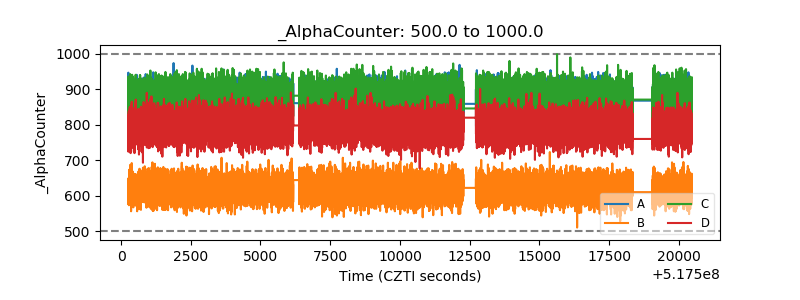 |
| _CPM_Rate | 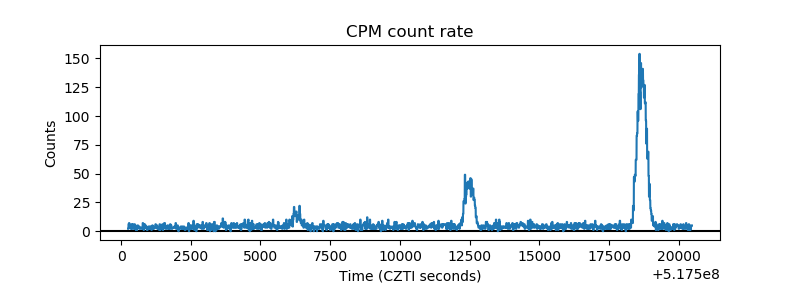 |
| CZT Counter | 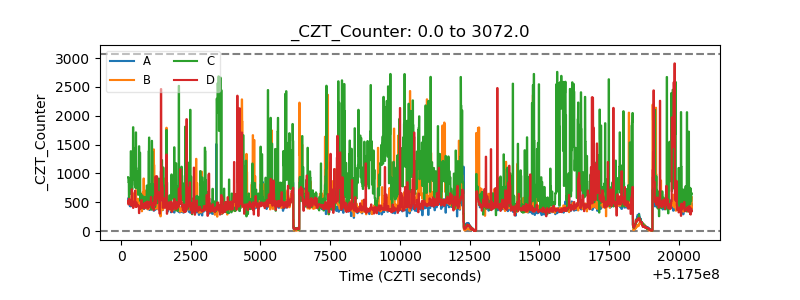 |
| +2.5 Volts monitor |  |
| +5 Volts monitor |  |
| _ROLL_ROT | 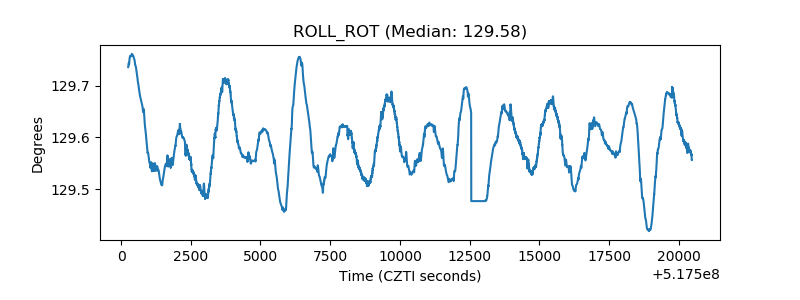 |
| _Roll_DEC | 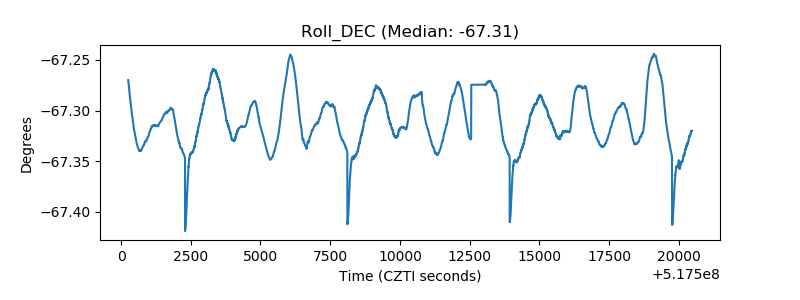 |
| _Roll_RA | 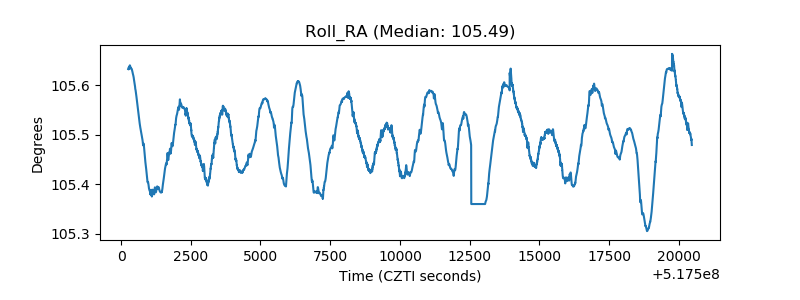 |
| Veto Counter | 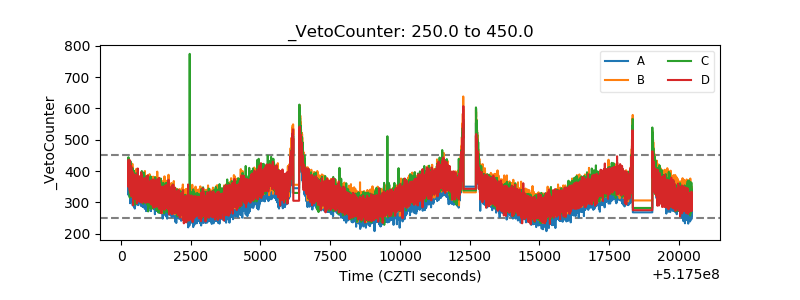 |