| Param | Original file | Final file |
|---|---|---|
| Filename | modeM0/AS1A14_125T09_9000006578_57681cztM0_level2.fits | modeM0/AS1A14_125T09_9000006578_57681cztM0_level2_quad_clean.evt |
| Size (bytes) | 432,362,880 | 95,826,240 |
| Size | 412.3 MB | 91.4 MB |
| Events in quadrant A | 2,840,550 | 638,533 |
| Events in quadrant B | 3,505,425 | 670,628 |
| Events in quadrant C | 4,602,917 | 581,583 |
| Events in quadrant D | 4,544,440 | 552,416 |
| Mode M9 | |||
|---|---|---|---|
| Quadrant | BADHDUFLAG | Total packets | Discarded packets |
| A | 0 | 16 | 0 |
| B | 0 | 17 | 0 |
| C | 0 | 17 | 0 |
| D | 0 | 17 | 0 |
| Mode SS | |||
|---|---|---|---|
| Quadrant | BADHDUFLAG | Total packets | Discarded packets |
| A | 0 | 134 | 0 |
| B | 0 | 134 | 0 |
| C | 0 | 134 | 0 |
| D | 0 | 134 | 0 |
| Mode M0 | |||
|---|---|---|---|
| Quadrant | BADHDUFLAG | Total packets | Discarded packets |
| A | 0 | 13443 | 2 |
| B | 0 | 15167 | 2 |
| C | 0 | 18328 | 2 |
| D | 0 | 18056 | 2 |
| Quadrant | Total seconds | Saturated seconds | Saturation percentage |
|---|---|---|---|
| A | 6570 | 26 | 0.395738% |
| B | 6570 | 218 | 3.318113% |
| C | 6570 | 366 | 5.570776% |
| D | 6570 | 345 | 5.251142% |
Noise dominated data is calculated using 1-second bins in cleaned event files. If a bin has >2000 counts, and if more than 50% of those come from <1% of pixels, then it is considered to be noise-dominated and hence unusable.
| Quadrant | # 1 sec bins | Bins with >0 counts | Bins with >2000 counts | High rate bins dominated by noise | Noise dominated (total time) | Noise dominated (detector-on time) | Marked lightcurve |
|---|---|---|---|---|---|---|---|
| A | 7600 | 6571 | 3 | 3 | 0.04% | 0.05% | 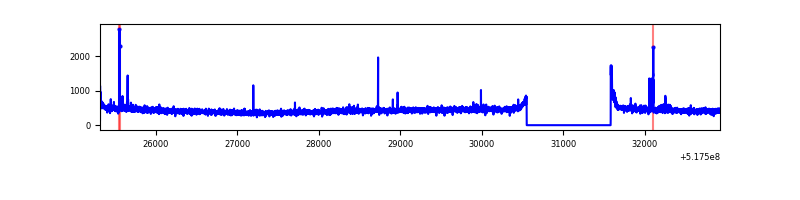 |
| B | 7600 | 6570 | 90 | 90 | 1.18% | 1.37% | 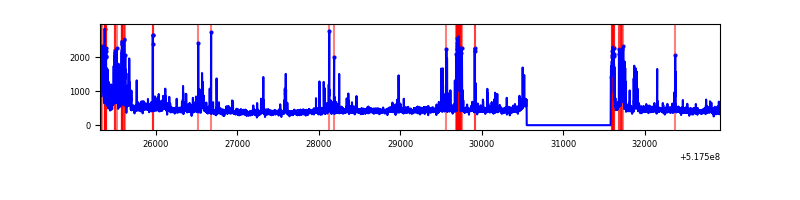 |
| C | 7600 | 6571 | 337 | 337 | 4.43% | 5.13% | 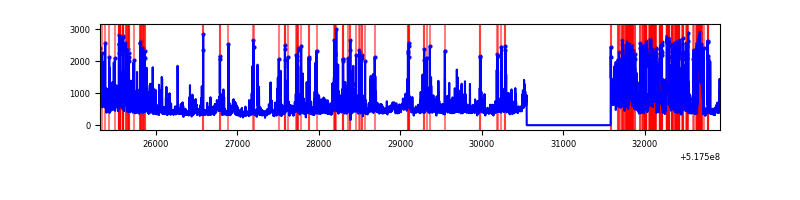 |
| D | 7600 | 6571 | 343 | 343 | 4.51% | 5.22% | 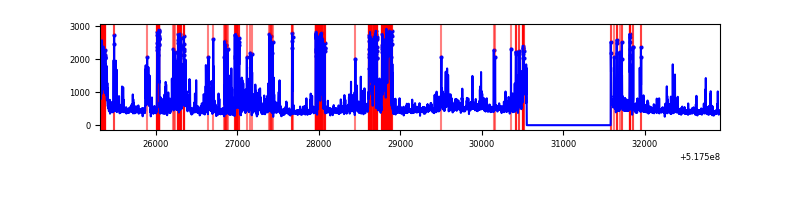 |
Top three noisy pixels from each quadrant. If the there are fewer than three noisy pixels in the level2.evt file, extra rows are filled as -1
| Pixel properties | Quadrant properties | ||||||
|---|---|---|---|---|---|---|---|
| Quadrant | DetID | PixID | Counts | Sigma | Mean | Median | Sigma |
| A | 3 | 14 | 28699 | 158.43 | 710 | 692 | 176.8 |
| A | 4 | 95 | 26016 | 143.25 | 710 | 692 | 176.8 |
| A | 10 | 251 | 18585 | 101.22 | 710 | 692 | 176.8 |
| B | 10 | 16 | 231596 | 1567.84 | 693 | 668 | 147.3 |
| B | 5 | 185 | 218476 | 1478.77 | 693 | 668 | 147.3 |
| B | 4 | 80 | 160046 | 1082.07 | 693 | 668 | 147.3 |
| C | 15 | 224 | 1366873 | 7455.54 | 670 | 660 | 183.2 |
| C | 12 | 254 | 236969 | 1289.56 | 670 | 660 | 183.2 |
| C | 12 | 252 | 171126 | 930.25 | 670 | 660 | 183.2 |
| D | 8 | 160 | 783508 | 4091.4 | 670 | 638 | 191.3 |
| D | 8 | 240 | 765634 | 3997.99 | 670 | 638 | 191.3 |
| D | 2 | 120 | 153759 | 800.23 | 670 | 638 | 191.3 |
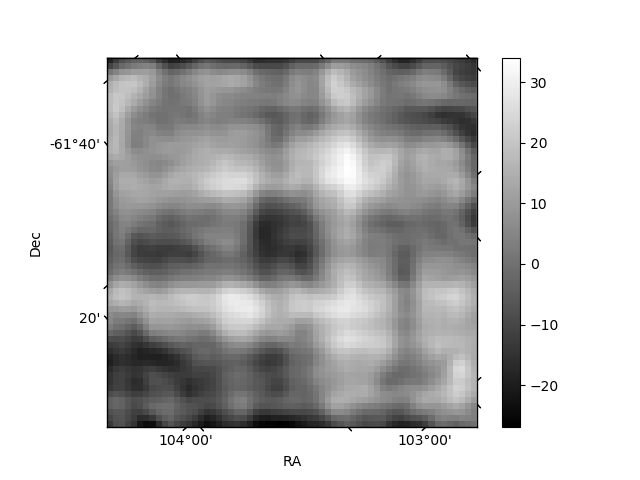
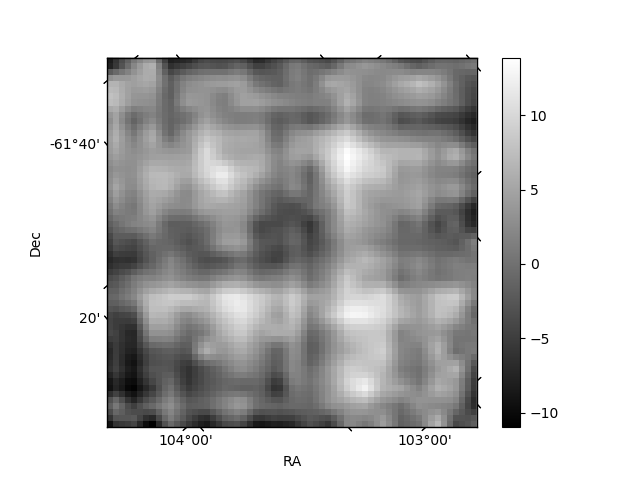
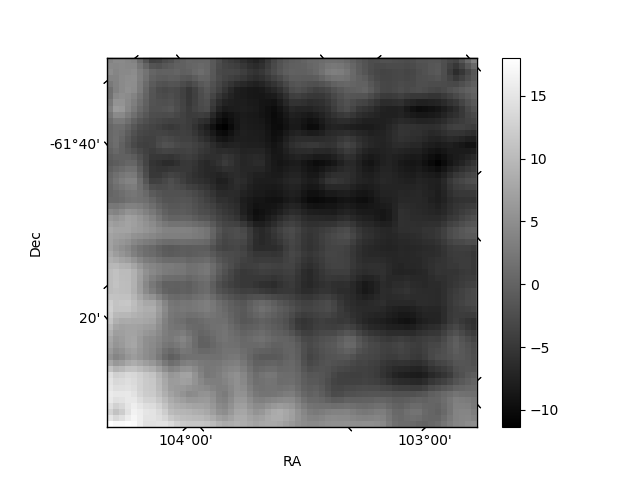
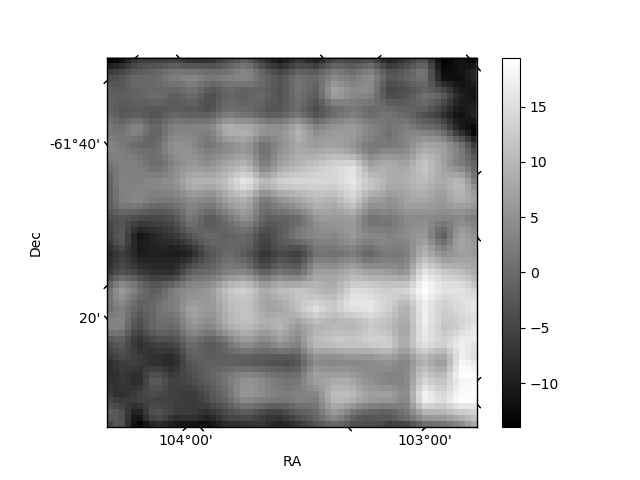
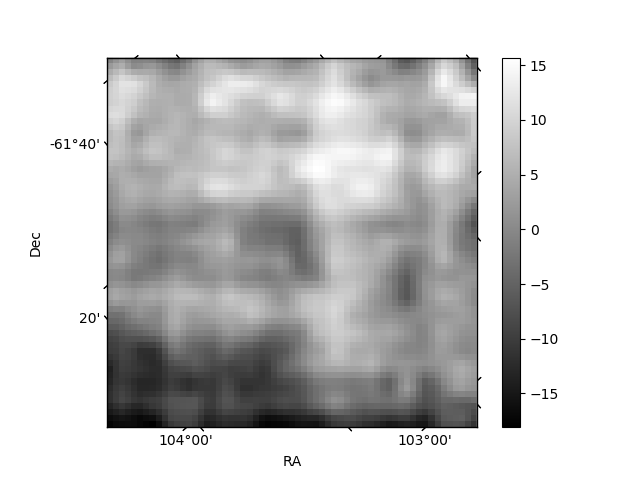
Histogram calculated using DETX and DETY for each event in the final _common_clean file
| Quadrant A | 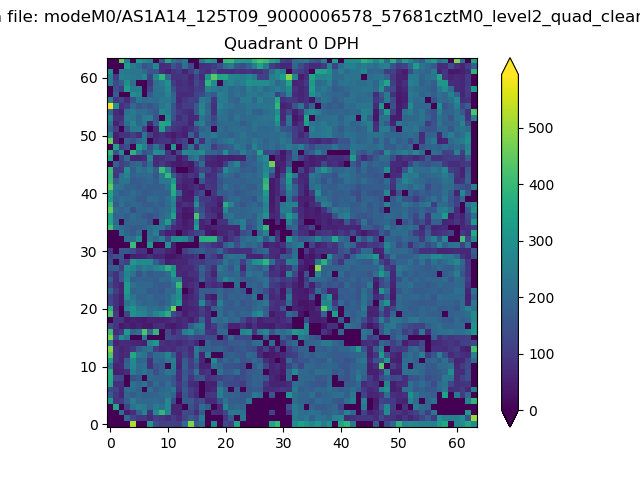 |
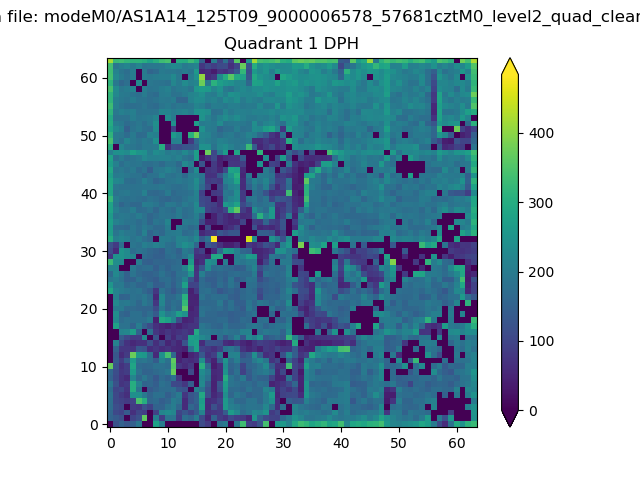 |
Quadrant B |
|---|---|---|---|
| Quadrant D | 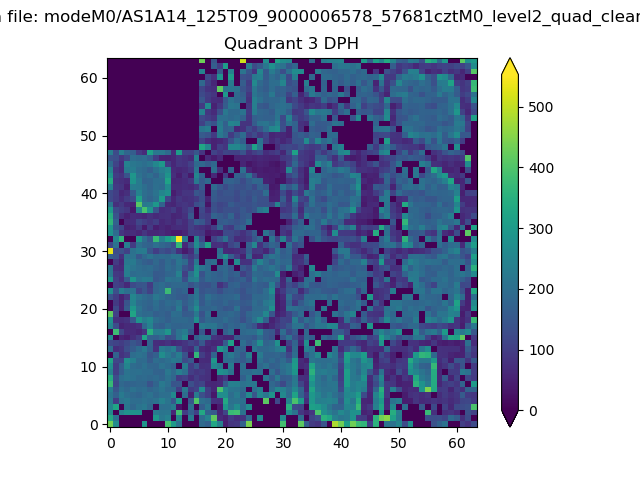 |
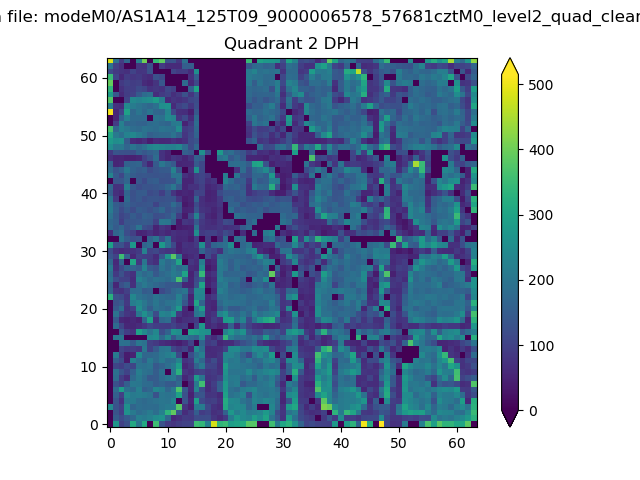 |
Quadrant C |
| Plot type | Count rate plots | Images |
|---|---|---|
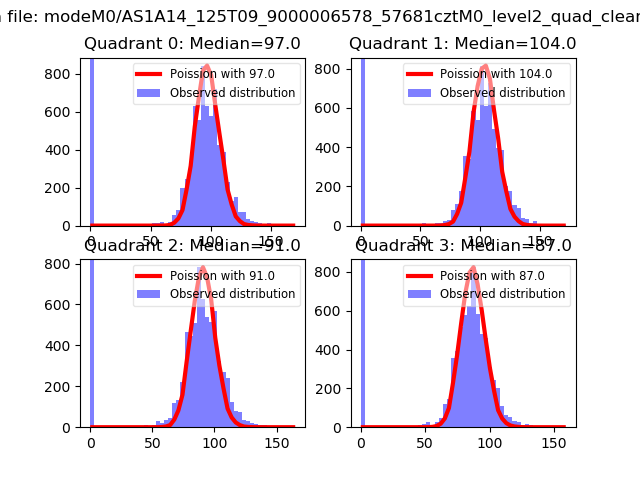
| Comparison with Poisson distribution Blue bars denote a histogram of data divided into 1 sec bins. Red curve is a Poisson curve with rate = median count rate of data. |
 |
 |
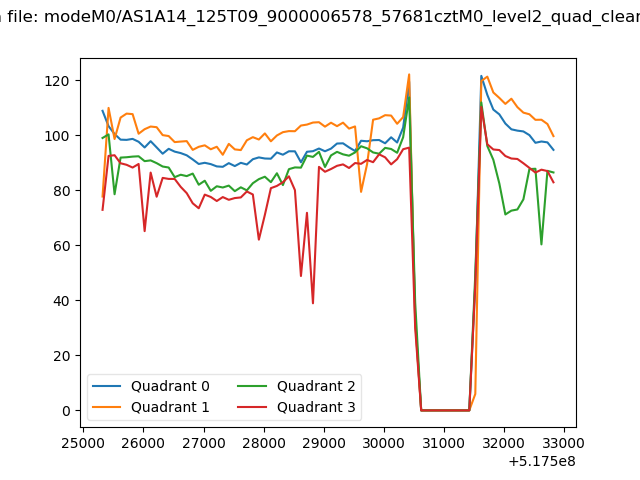
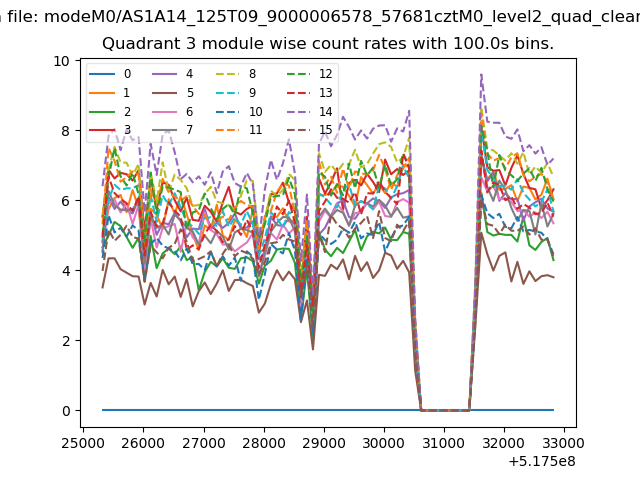
| Quadrant-wise count rates Data is divided into 100 sec bins |
 |
|
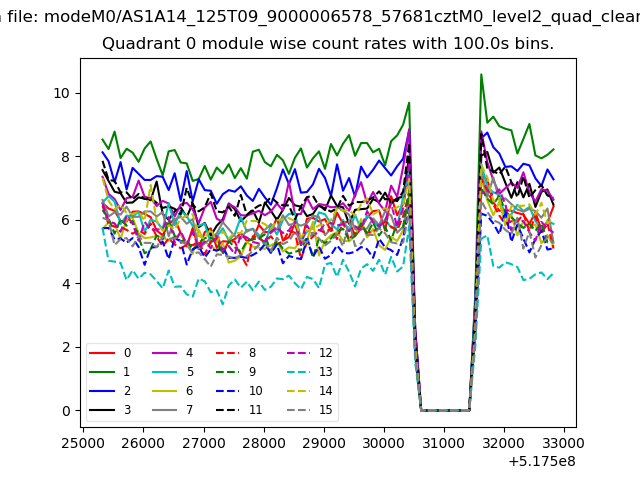
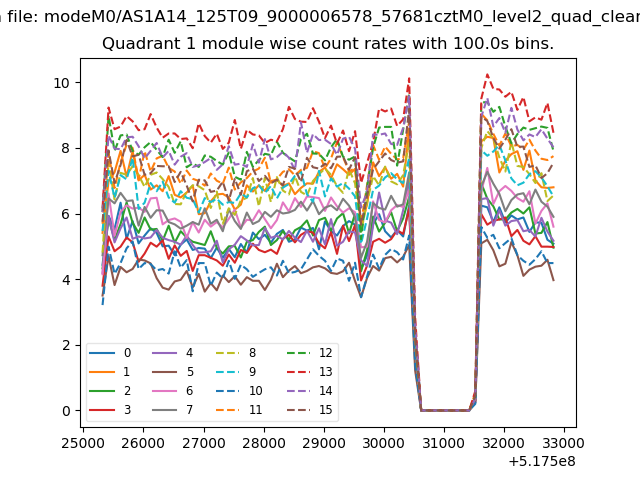
| Module-wise count rates for Quadrant A Data is divided into 100 sec bins |
 |
 |
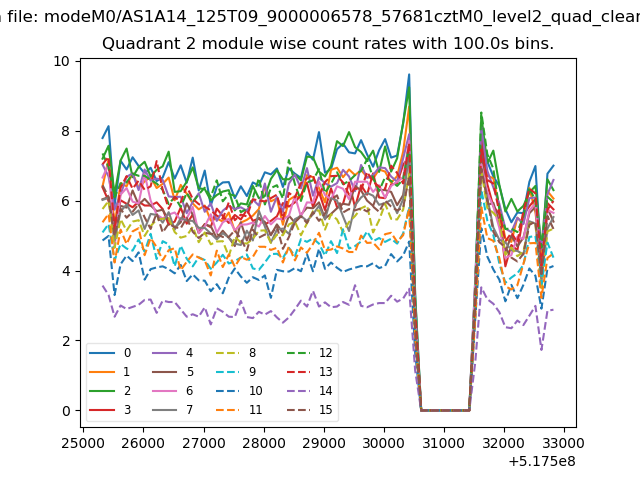
| Module-wise count rates for Quadrant B Data is divided into 100 sec bins |
 |
 |
| Module-wise count rates for Quadrant C Data is divided into 100 sec bins |
 |
 |
| Module-wise count rates for Quadrant D Data is divided into 100 sec bins |
 |
 |
| Parameter | Plot |
|---|---|
| CZT HV Monitor | 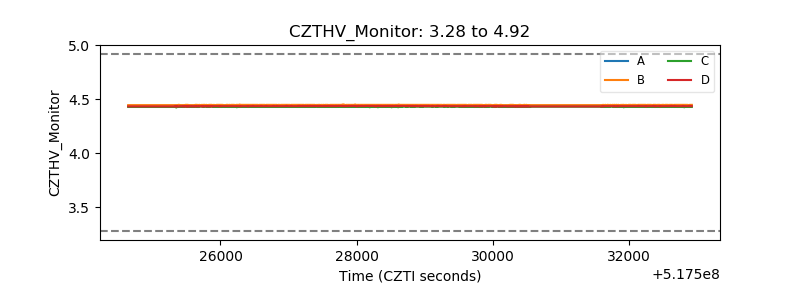 |
| D_VDD | 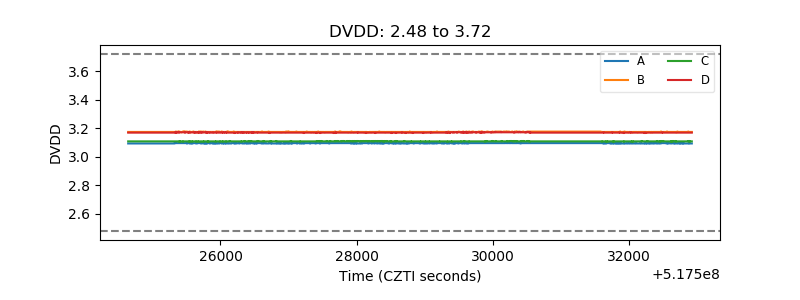 |
| Temperature 1 | 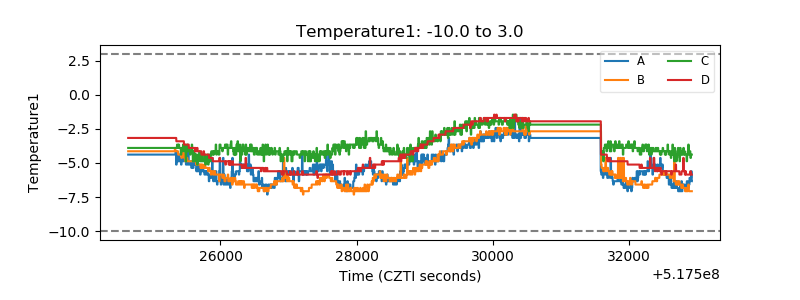 |
| Veto HV Monitor | 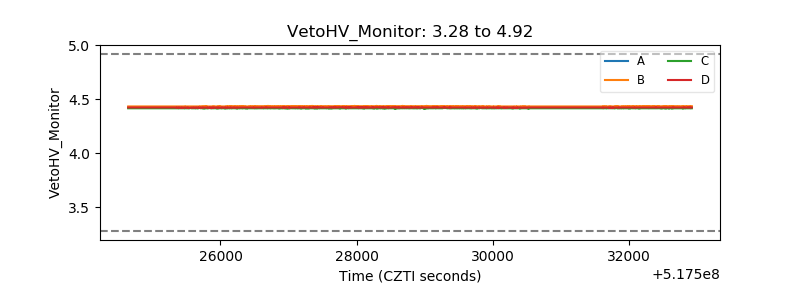 |
| Veto LLD | 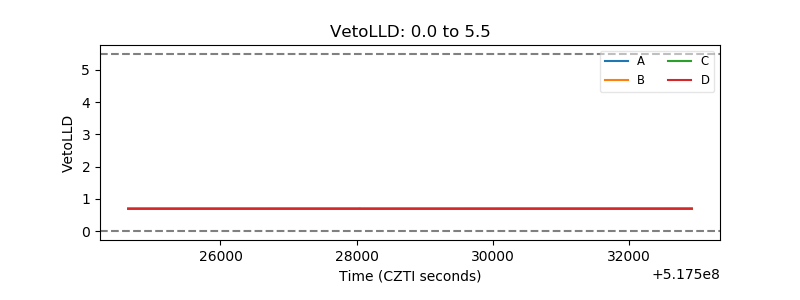 |
| Alpha Counter | 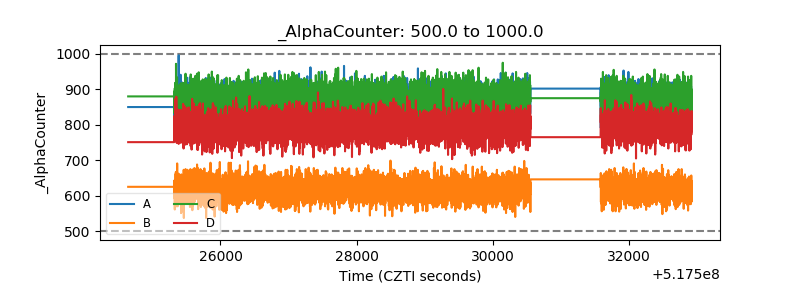 |
| _CPM_Rate | 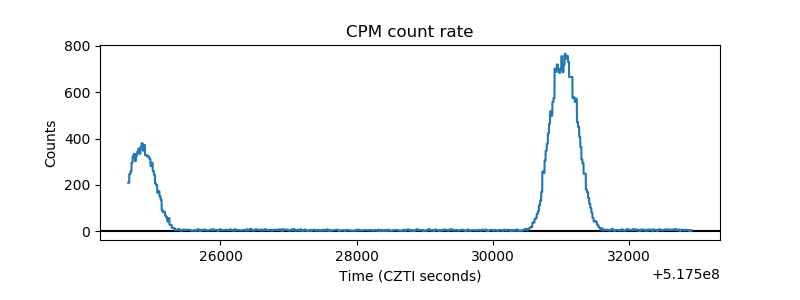 |
| CZT Counter | 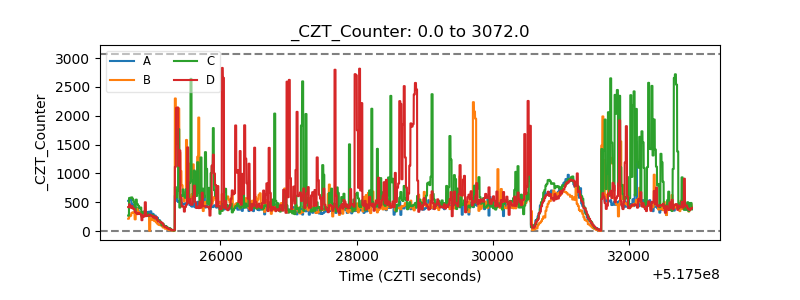 |
| +2.5 Volts monitor |  |
| +5 Volts monitor |  |
| _ROLL_ROT | 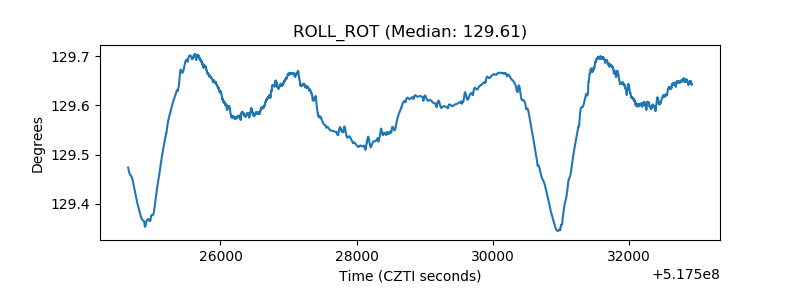 |
| _Roll_DEC | 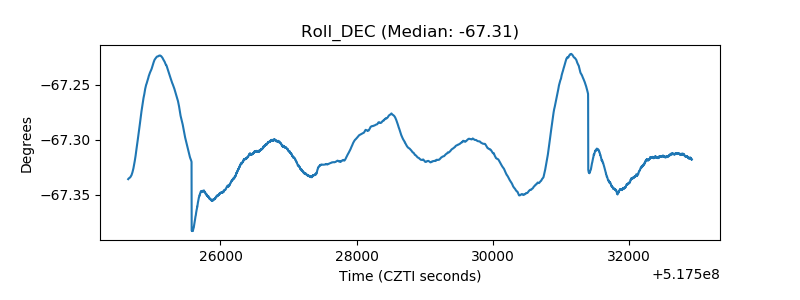 |
| _Roll_RA | 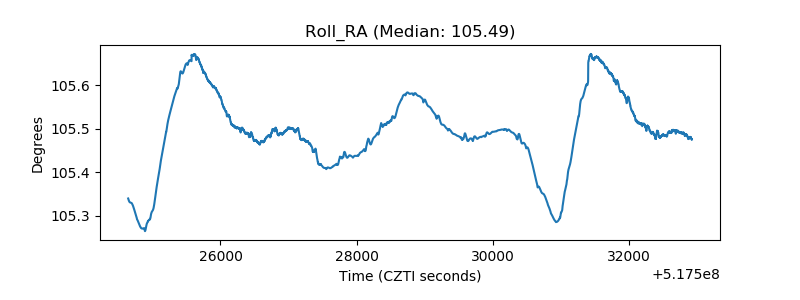 |
| Veto Counter | 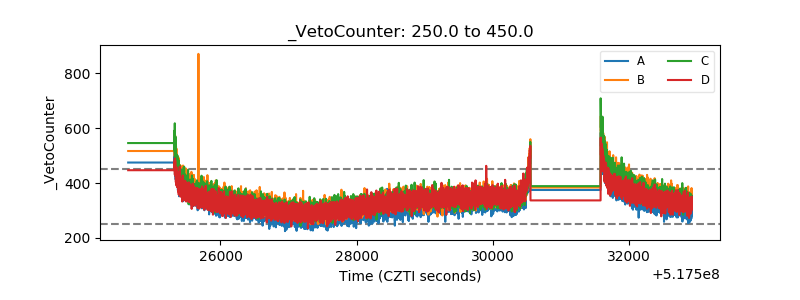 |